
Abstract
1. Introduction
As the times and technology progress, people pay increasing attention to health. Modern people go to hospitals not only for medical treatment but also for health examination. Therefore, the number of people going to hospitals increases continuously. However, the incidents of hospital infection still occur occasionally, endangering those in hospitals. The SARS crisis burst out in 2003 frightened Asian countries causing many health care workers to be infected. The H1N1 flu in 2009 even caused worldwide infection; although the lethality was not high, the number of infected people was much larger than SARS, and the death toll was higher than that in SARS. Besides the abovementioned constantly occurring viruses or bacteria, 9 million people are infected with tuberculosis which is an old disease in the world annually. More shockingly, the number of drug resistant tuberculosis cases is increasing. The negative-pressure isolation wards are required for the patients with these diseases. In order to be prepared for mass epidemic of respiratory infection diseases similar to SARS and H1N1, the negative-pressure isolation ward has attracted wide attention in recent years.
There are many studies on air conditioning in negative-pressure isolation rooms in recent years, such as Hay Den II et al. [1] who experimentally investigated the air volume migration from negative-pressure isolation rooms during entry/exit. Phillips et al. [2] studied and analyzed the age-of-air and the patient comfort in the negative-pressure isolation room. Tang et al. [3] demonstrated in their experimental model that, despite negative pressure, opening the door could have resulted in transport of infectious air out of the isolation room, leading to a breakdown in isolation conditions. Huang and Tsao [4] used CFD and experiment to discuss the steady state (breathed) and transient (coughed) bacteria removal in one-bed negative-pressure isolation room, considered the thermal buoyancy effect. They also analyzed the difference between the patient's lying on back and lying on side. Kao and Yang [5] indicated that the parallel-directional airflow pattern was the most effective means of controlling flows containing virus droplets. Cheong and Phua [6] simulated the air flow pattern in hospital isolation ward by changing the positions of three air outlets and diffusers. Noakes et al. [7] used CFD to simulate ventilation system to reduce and prevent tuberculous bacteria infecting health care workers. Saravia et al. [8] investigated the performance of 678 airborne infection isolation rooms was evaluated and compared with construction design guidelines. Ching et al. [9] suggested the hospital curtains should be used in multibed hospital ward to isolate a possible airborne infectious patient. Richmond-Bryant [10] numerically examined the characteristics of the spatial velocity and concentration profiles in an airborne infection isolation room. Tung et al. [11] presented an experimental modeling of contaminant dispersion in a mock-up isolation room with different negative pressure differentials and ventilation rates. Li et al. [12] numerically investigated the biological pollutant concentrations in a hospital isolation room with ultraviolet (UV) light devices. Balocco and Lio [13] numerically investigated the air flow patterns, distribution and velocity, and the particulate dispersion inside an existing typical hospitalization room equipped with an advanced HVAC and VAV system. Adams et al. [14] experimentally compared containment efficiency in an anteroom-equipped hospital isolation room at differential pressures ranging from 2.5 to 20 Pa under conditions of no provider traffic and simulated high provider traffic. Bolashikov et al. [15] numerically investigated the exposure of a doctor and a second patient in a two-bed hospital isolation room. The effect of the distance between the doctor and the coughing person, the posture of the coughing patient, and the position of the doctor was examined.
Earlier studies concerning hood in ventilation system including Cascetta et al. [16–18] experimentally investigated the velocity fields in front of the opening of several kinds of hoods. The empirical correlations which were accurately fitting with the experimental data were provided for the designers. Recently, Laverge et al. [19] present a multizone simulation based performance assessment of residential mechanical hood exhaust ventilation systems, using five common dwelling typologies and the sizing rules put forward in several residential ventilation standards.
As discussed above, the pathogenic bacteria removal in negative-pressure isolation room requires improvement, and it is very difficult to remove the pathogenic bacteria derived from the patient's breath, cough, and sneeze effectively. Even if the inlet and outlet positions of air conditioner are changed, the bacteria removal effect is not always good as the patient changes lying position. Two patients in one ward is a more complicated case. Therefore, a high air change rate is required to dilute the concentration of pathogenic bacteria that will consume a great deal of energy. An additional hood is set on the sickbed in this study, trying to determine a design for excellent bacteria removal effect at lower air change rate, and to discuss the influence of hood geometry, air exhaust allotment, patient's lying position, and air change rate on bacteria removal effect, so as to make the negative-pressure isolation room have a high IAQ and low energy consumption.
2. Physical Model and Equations
The ward in this study is a one-bed negative-pressure isolation room in a hospital. This ward is 6 m in length, 2.2 m in height, and 3.6 m in width. The toilet is 2.2 m in length, 2.2 m in height, and 2.2 m in width. The bed in the room is 2 m in length, 0.8 m in height, and 1 m in width. The hood is as wide as the bed, and its length and height are variables. The hood can be made of transparent materials such as glass or acrylic, so that the patient can have adequate visual field and lighting. The geometric shape is shown in Figure 1. In Figure 1, length and height of the hood are 1 m and 0.6 m, respectively. In this study, all the outlets are located on the hood when there is a hood on the sickbed.

Schematic of geometry of isolation room (Case 1).
The assumptions of physical model in this study are described below.
The fluid is incompressible flow; the physical properties of fluid other than density are assumed to be fixed values.
The toilet door is closed, and there is no air interchange between the toilet and the room.
The phlegm droplets coughed out by the patient are in very small diameter (0.58∼5.42 μm, Yang et.al [20]). They are assumed under very slight influence of drag force and gravity, and their movements are completely controlled by the air flow, so that they are regarded as a part of gas. Memarzadeh et al. [21] proved that the results from species concentration and particles tracing are quite consistent. Species concentration approach is applied in this study.
There are two kinds of working fluid in this study, one is fresh air, and the other one is the GWB (Gas with Bacteria, Huang and Tsao [4]). The GWB contains bacteria or fine sputum droplets exhausted from the patient's mouth and nose. The mass composition of GWB is CO2 7.2%, N2 75%, H2O 3.8%, O2 14% (Huang and Tsao [4]).
The boundary conditions in this study are described below.
The wall surfaces are assumed to be insulated.
The inlet parameters of the fresh air include flow velocity (determined by air change rate), temperature (21°C), and area (0.3 m × 0.3 m). The inlet gas consists of 100% fresh air and 0% GWB.
The pressure in the room is negative, so there is external air flowing into the room through the door clearance. If it accounts for 10% of total air change rate, the door clearance area is 0.005 m × 1.4 m, the temperature is 21°C, and the gas consists of 100% fresh air and 0% GWB.
The heat generated from the patient's body is 116 Watt (100 kCal/hr), the body accounts for about 85% of total calorific value, and the patient is covered with a quilt. The calorific power of body is emitted from the quilt. The patient's face temperature is set as 38°C.
The GWB is coughed out of the patient's mouth, the average exhaling speed is 2 m/s (Huang and Tsao [4]), the area is 0.05 m × 0.05 m, the temperature is 38.5°C, and the gas consists of 0% fresh air and 100% GWB.
This study used commercial CFD package STAR-CD for flow field simulation analysis. The equations adopted are continuity equation, turbulence momentum equations (with buoyancy effect), turbulent energy equation, and turbulent species equation.
3. Numerical Solution Methodology and Experimental Measurement
3.1. Numerical Methodology
The turbulence model used in this study is the “standard high Reynolds number
The grid test was carried out in this study. The parameters for grid test are shown in Table 1. The mean concentration of GWB is used as the comparison subject of grid test. The definition of concentration and computing formulae are shown below:

where
Grid test results.

The cell numbers used for grid test are 105158, 200264, 411160, and 588272. The relative errors of the room mean GWB concentration (defined as (1)) at different cell numbers are compared. Table 1 shows that the relative error of GWB concentration between the cell number of 40 thousand and the cell number of 59 thousand is about 0.89%. The cell number about forty thousand is used for the following flow analysis.
The transient analysis in this study simulates the GWB concentration decay with time within 50 seconds following the stop of 3-second coughing of the patient. The time step is 0.01 second. The normalized GWB concentration Φ


where Φ
3.2. Experimental Setup
Figure 2 is the schematic diagram of experimental measurement of CO2 as tracing gas; S1∼S6 are the locations of CO2 sensors. The CO2 is discharged from a cylinder, and it reaches the hood bottom through a pipe and enters a columnar container upward. A fan at the top of the container sucks air in the hood and mixes with CO2 and blows the mixture (CO2 concentration is fixed at 7000 ppm) into the hood. The volume flow rate delivered by a DC fan is controlled at 0.236 m3/min ± 2% (average air velocity 2 m/s) to simulate the patient coughing out GWB continuously. Flow rate of the fan is measured by a wind tunnel constructed according to AMCA210-99. One of the six CO2 sensors is in the hood and is located on the rear end of hood, and the other five are outside the hood catching leaked CO2. There is a heater at the exit end of the fan to keep the blown gas temperature at about 38.5 ± 0.5°C. The experimental hood is shown in Figure 2, 0.6 m long and 0.6 m high. The inlet flow rate of conditioning air is measured by ALNOR Balometer capture hood EBT721 with accuracy ± 0.2 m3/min. The CO2 was sensing by Sensecube CO2 controller KCD-DA with accuracy ± 3% of reading. The total uncertainty of this experiment is about 8.4%. The experimental measurement was repeated three times and results shown in Figure 3 were their average.
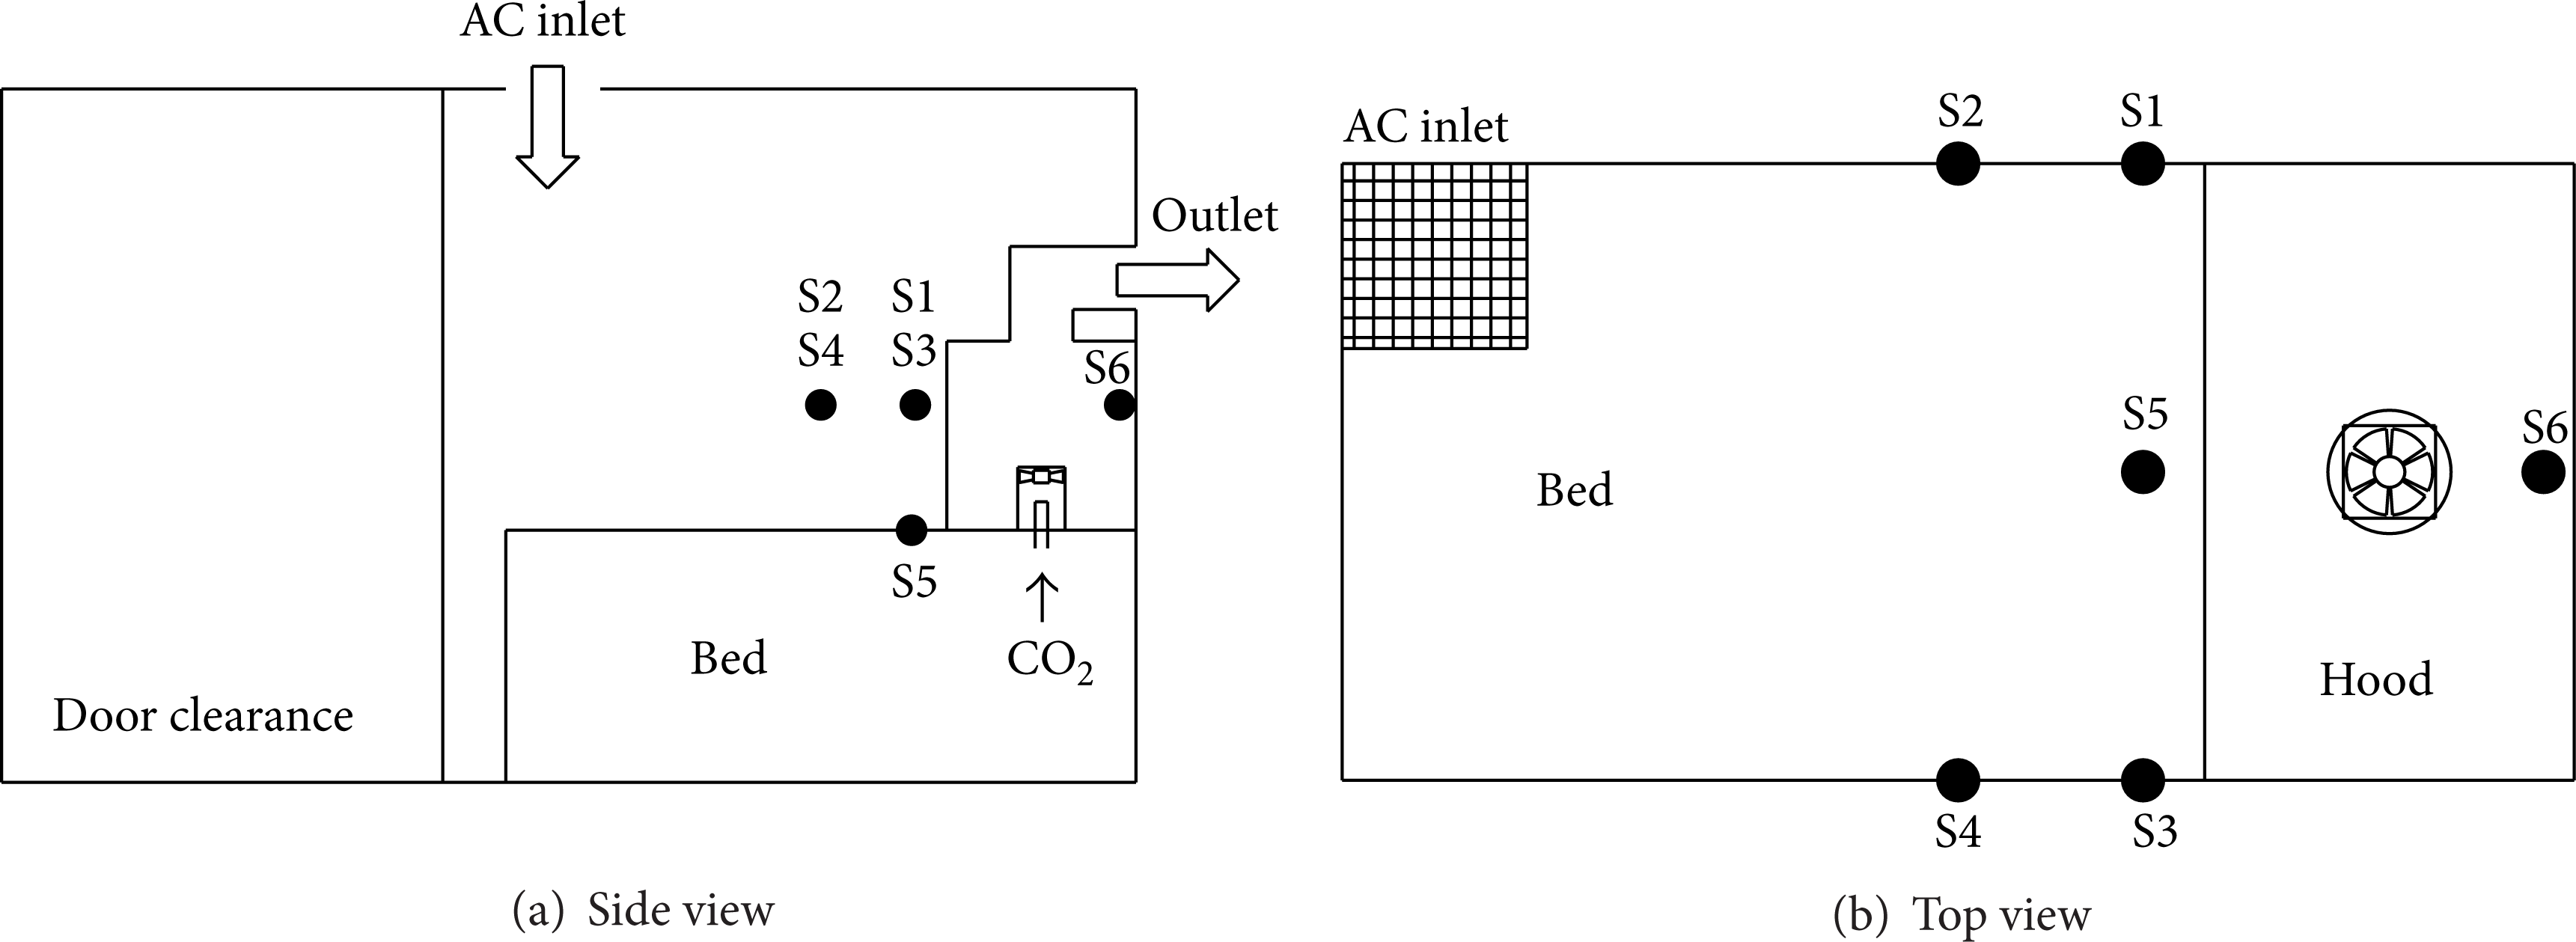
Locations of CO2 sensors.

Experimental CO2 concentration varied with time at various monitoring points.
4. Results and Discussion
4.1. Steady State Analysis
Based on the geometry of Figure 1, Table 2 shows the influence of hood on the room mean GWB concentration in room when the patient keeps coughing, and the air change rate is 12 ACH. According to Table 2, the GWB concentration of lying on back and lying on side without hood is as high as 0.41 and 0.87, respectively, at a high air change rate (12 ACH), whereas the room mean GWB concentration with hood is 0.0036 and 0.015, respectively. The GWB is removed from the hood effectively, so that the risks of airborne infection are reduced greatly. In addition, the conditioning air enters the hood inlet, blocking the residual GWB, so that it is unlikely to leak out of the hood. The function of hood is obvious. It has excellent effect even if in the difficult case of continuous coughing. However, there is still 1.5% GWB residue in the hood at such a high air change rate of 12 ACH when the patient coughs lying on side.
Influences of hood on mean GWB concentration and leakage (numerical results).

In addition, Table 2 shows the influence of air change rate on the GWB leakage from hood. It is observed that there is a small amount of GWB leakage when the patient lies on back or lies on side at 6 ACH, whereas there is no leakage at the air change rate of 12 ACH. However, the leakage is zero at 6 ACH as the outlet is located on the top of hood.
In order to verify the function of hood, a qualitative experiment was performed by using CO2 as contaminant gas to test the hood in Figure 2. After the air conditioning system was stably operating at 6.3 ACH, the CO2 gas continuously delivered into hood. Figure 3 shows that no CO2 (or insensible) leaked out of hood during 10-minute upward or leftward release. The steady state concentration at S6 is 1063 ppm. A steady state numerical simulation according to this experiment is carried out and compares with the experimental results. The numerical CO2 concentration at the position S6 is 1006 ppm, which is within the uncertainty of the experiment. The numerical results also show that no pollutant leaks out as lying on the back or lying on the side. The numerical results agree well with the experimental results. When the CO2 releases upward, it is almost entirely removing by the outlet at the first second. Therefore, the CO2 concentration at S6 is very close to the background value (about 350 ppm). When the CO2 releases leftward, the CO2 is not removing at the first second and it diffuses within hood. Part of the releasing CO2 is removed when it is near the outlet; the other needs a period of time to reach the location of S6. From the above comparison, the effect of hood and the reliability of numerical computation are confirmed.
4.2. Transient Analysis
4.2.1. Results of Case 1
The geometry of Case 1 is shown as Figure 1. Figure 4 shows the Φ

Φ
Figure 4 also shows that, when the patient lies on back, the higher the air change rate is, the faster the concentration decays. However, when the patient lies on side, although the air change rate is increased to 12 ACH, the concentration decay is similar to that at 6 ACH. Since the GWB cannot be discharged through the outlet immediately, it diffuses in the hood. Even if the air change rate is doubled, the GWB is only dispersed; the removal effect is not improved, not only failing to attain the effect, but also wasting energy.
4.2.2. Results of Different Locations of Outlets
Figure 5 shows several outlet designs, which are Case 2∼Case 5. The length and height of hoods in these cases are the same as Case 1. This study attempts to find some good designs by changing hood geometries and outlet locations. In order to confine the GWB within the hood at lower air change rate and to remove it completely within a short period of time, the air change rate discussed below is 6 ACH.

Schematic of outlet locations in hood.
The variation of Φ

Variation of Φ
The effect of the allotment of exhaust flow rate for every outlet on the decay of Φ

Influence of exhaust allotments on the variation of Φ
4.2.3. Results of Variable Hood Geometries
Figure 8 shows the variation of Φ

Influence of length of hood on the variation of Φ
Figure 9 shows the influence of height of hood on the variation of Φ

Influence of hood height on the variation of Φ
4.2.4. Discussion of Using a Tall-Short Hood
The major problem resulted from the bed with an additional hood is inconvenience. It is an obstruction when the patient wants to get up and when the health care workers are to diagnose and treat the patient. The patient's getting up problem can be solved by heightening and shortening the hood. When the height is 1 m, most of patients can get up without lifting the hood. However, it is known from the analysis results that heightening and shortening the hood are disadvantageous to the removal of GWB. Besides, lower air change rate may result in GWB leakage. Therefore, it is necessary to discuss the limiting conditions for using hood. Figure 10 shows the leakage rate in different hood heights at different air change rates when the length of hood is 0.6 m and the allotment of exhaust flow rate is 4: 6 in Case 5. Figure 10 simulates the situation after 20-second cough of patient (drastic cough), testing the pollutant removal function of hood in severe condition. The leakage rate herein is defined as the total amount of leakage GWB divided by total amount of GWB inside hood. As shown in Figure 10, when the patient lies on back, a higher hood leads to higher GWB leakage rate; a lower air change rate leads to higher leakage rate. When the patient coughs seriously while lying on back, the air change rate is lower than 5 ACH, the leakage rate increases rapidly, and a higher hood makes this phenomenon more obvious. In addition, when the patient lies on side, even if the air change rate is only 3 ACH, the leakage rate is still very low in any height of hood. According to the results in Figure 10, this study suggests using Case 5 as the air conditioning design for hood (

Influence of hood height and air change rate on GWB leakage rate, exhaust allotment is 4: 6, Case 5.
According to the aforesaid results, when an additional hood is set on the sickbed, both the mixing of the fresh air with GWB and their removal process proceed in the hood, the GWB leakage is very small, and it has no marked relation to the space size outside the hood. In this situation, the air change rate shall be calculated based on the space in the hood, that is, the air change rate for hood (ACHH). For a 1 m high, 0.6 m long, and 1 m wide hood, 1 ACH (based on room space in this study) is about 61.5 ACHH, the aforesaid recommended air change rate of 5 ACH is about 307ACHH.
4.3. The Advantages and Defects in Applying a Hood on the Sickbed
The air conditioning designs for negative-pressure isolation rooms of hospitals are different, and the room sizes are also different. If a mass epidemic of a severe infectious disease as SARS or H1N1 happens, a large room with multiple beds may be used for holding patients as a result of short normal isolation rooms. In different room conditions, it is very difficult to control the pollutant at low concentration, and the patients’ cross infection is a trouble. If an additional transparent hood is set to the sickbed, it has excellent pollutant removal effect according to the results of this study. The pollutant removal process is limited to the hood, and it has no marked relation to the air conditioning mode of room, room size, number of patients, and furnishings in room. It can be regarded as an independent air-conditioning system. Therefore, the results of this study are general.
The other problem of hood is inconvenient for the health care workers to implement diagnosis and treatment, and the hood should have a lifting device. If the hood has several air conduits, lifting the hood will be more difficult. The hood lifting mode and type of conduit are problems in practical use of hood. There may be other problems not detected, but they may not be very difficult. Only a small air change rate is needed because of its excellent bacteria removal effect. For energy saving, independent air conditioning, and the protection for health care workers, the design of additional hood to sickbed shall be considered.
5. Conclusions and Suggestions
This study numerically investigated the influence of the bed with an additional semiopen hood on the bacteria removal in a negative-pressure isolation room. The following conclusions and suggestions are proposed.
The design of independent air conditioning formed of a sickbed with an additional hood can improve the bacteria removal effect greatly.
Three outlets on the hood are suggested, placed straight above the patient's head and at both sides; the allotment of exhaust flow rate for various outlets is recommended as 4: 3: 3.
The length of hood influences the bacteria removal effect slightly at the total air change rate above 6 ACH (360 ACHH), and the short hood has significant influence when the patient coughs lying on side and the allotment of exhaust flow rate is 6: 4.
The increase in the height of hood has negative influence when the patient coughs lying on back. When the side exhaust flow rate is high, the height of hood influences the removal of GWB slightly as the patient lying on side.
The air change rate for the negative-pressure isolation room with a hooded bed is recommended as above 5 ACH (307 ACHH). The hood size is recommended as 1 m high and 0.6 m long.
The main purpose of this study is to introduce the concept of a sickbed with a hood. The shape of hood is a simple rectangle. Different shape of hood might be more comfortable and more efficient. It could be considered as the future research work.