
Abstract
Over the past few decades the largest corporations in the United States have taken greater shares of net income, revenues, assets, and market capitalization. 1 The studies that have unearthed increasing concentration have also shown that big business charges higher prices while lowering wages, providing lower quality goods and services, and restricting output. 2 In the aggregate, corporate concentration has been blamed for the slowdown in productivity growth and a sluggish economy. 3 A recent paper by Germán Gutiérrez and Thomas Philippon even argues that the United States, once the poster child of economic dynamism, has lost its competitive edge relative to Europe because of its failures to combat concentration. 4 In addition to stifling competition, concentration has also been linked to rising inequality and the increasing political clout of big business. 5 With a growing number of people feeling the system is rigged in favor of elites, the concentration of wealth and power in the hands of a few giant corporations adds more fuel to the already seething flames of populist discontent. 6
How did we get into a situation where a few “superstar” companies dominate? Market processes of globalization and technological change are identified as two of the main drivers. 7 The former allows multinationals to expand the scope of their operations and to lower costs, while the latter entails network effects that may encourage “winner take all” dynamics. 8 Digital platforms tend toward monopoly. Social media users derive no clear benefit from having their contacts spread across various sites; the whole point is to connect everyone together in one network. Yet in the United States growing concentration has been pervasive in domestically oriented, brick-and-mortar sectors as well as globalized, high technology ones. 9 The ubiquity of oligopolistic giants throughout the US corporate landscape suggests that something more than just market processes is at play. That something is politics and, in particular, public policy. As large corporations command ever-greater shares of resources, regulatory bodies such as the Federal Trade Commission and the Department of Justice have come under fire for enabling concentration through lax antitrust policies and lenient merger enforcement. 10
Not long ago it was common for mainstream economists and policymakers to follow the Chicago School and downplay the consequences of corporate concentration. Growing size, they argued, simply reflects the growing efficiencies of large corporations relative to their smaller competitors.
11
In large part because of their abilities to exploit economies of scale, corporate behemoths are credited with boosting competition and improving consumer welfare.
12
But that view has come under fire, even within the Chicago School itself. In 2017 and 2018 the University of Chicago’s Booth School of Business held two events on the threats posed by corporate concentration. As the
The political aspects of corporate concentration have not been lost on politicians. Still reeling from the presidential election defeat in 2016, the Democratic Party announced a “Better Deal” strategy for the 2018 midterms. A throwback to New Deal progressivism, Democrats vowed to tackle oligopolistic market structures through antitrust reforms that would empower regulators to break up monopolies and make it harder for companies to merge if it is deemed to reduce competition. 14 Even Donald Trump has been unable to resist the trust-busting fervor. 15 During his presidential campaign he lambasted Comcast’s acquisition of NBC Universal in 2011 and vowed to stop a potential merger between AT&T and Time Warner. It is tempting to dismiss Trump’s rhetoric as a narrow sideswipe against the “liberal media.” But the fact that a Republican president (and self-styled business tycoon) would entertain these trust-busting taboos shows just how politically charged the issue has become.
From its origins in the Sherman Act of 1890 and the Clayton Act of 1914, antitrust policy has been the main weapon of the US federal government in combating the power of giant corporations. And given that concentration has increased alongside the rolling back of robust antitrust measures in recent decades, it makes sense for current debates to draw links between the two. Yet as important as antitrust may be, it is not the only facet of public policy bearing on the distribution of corporate wealth, income, and power. In this article, we examine another facet of public policy almost entirely absent from recent discussions of concentration: corporate taxation.
To be sure, the tax practices of large corporations have been subject to plenty of scrutiny. Exposés in major newspapers reveal how some business giants reap record profits while paying nothing to the US Treasury.
16
It has been acknowledged that globalization may confer a tax advantage on dominant firms, which are better equipped than their smaller counterparts to evade and avoid taxes by shifting their profits to low-tax jurisdictions.
17
There is also some recognition that large corporations draw on inordinate legal resources to lobby for favorable tax policies and to exploit loopholes in the byzantine US tax code.
18
The 2019
Investigating the relationship between corporate taxes and concentration, we address several key questions. How have the tax rates of US corporations of different sizes evolved over time? Do large US corporations enjoy a worldwide tax advantage compared to their smaller counterparts? What role do foreign and domestic tax systems play in shaping the distribution of income within the corporate universe? What does an inquiry into the relationship between corporate concentration and taxation reveal about the wider transformations of US capitalism over the past few decades?
To explore these questions, our research maps effective income tax rates (ETRs) within the nonfinancial sector, using the top 10 percent as our proxy for large corporations and the bottom 90 percent as our proxy for smaller corporations. 22 As far as we are aware, ours is the first study to develop estimates of what we term “jurisdictional tax rates” for US corporations disaggregated by size. Our findings point to a striking and persistent tax advantage for big business in recent decades. We find that in the 1970s the worldwide ETR of the top 10 percent was consistently higher than that of the bottom 90 percent. By the early 1980s, the ETR of large and smaller corporations had equalized at 29 percent. But from the mid-1980s onward, large corporations consistently have faced lower worldwide ETRs relative to their smaller counterparts. The gap is particularly pronounced in recent years, with the top 10 percent registering a worldwide ETR of 28 percent and the bottom 90 percent a worldwide ETR of 41 percent. We then break down the worldwide rate into its domestic and foreign components. From the mid-1980s, the earliest period for which jurisdictional data are available, up to the present, we find that the domestic ETR of the top 10 percent is consistently eleven to sixteen percentage points lower than that of the bottom 90 percent. The foreign ETRs of both the top 10 percent and the bottom 90 percent have steadily declined since the 1980s. From the mid-1980s to the 2000s, the foreign ETR of the top 10 percent was one to seven percentage points higher than that of the bottom 90 percent. But since 2010 the situation has reversed; large corporations now face a foreign ETR that is four percentage points lower than that of their smaller counterparts. Overall, these shifts suggest that the regressive worldwide ETR is due to persistently regressive domestic ETRs and a marked drop in the progressivity of foreign ETRs in recent years.
We go on to explore some implications of the findings that emerge from our mapping of jurisdictional ETRs. Building on the “capital as power” approach, we demonstrate how a sustained reduction in the relative tax burden of large corporations since the mid-1980s coincides with a sustained increase in the concentration of power as measured by relative net profit margins. 23 We also show that a reduction in the relative tax burden of large corporations since the mid-1980s has coincided with a reconfiguration of power relations within and beyond the firm. As large corporations become less disposed to investments that may indirectly benefit ordinary workers, they become more disposed to shareholder-value enhancement that directly benefits the asset-rich. What this means is that the corporate tax structure is bound up not only with rising corporate concentration but also widening household inequality.
The remainder of the article is organized into six sections. In the first section, we provide some historical context for our subsequent analysis and explore how changes in patterns of corporate taxation relate to broader shifts in the public finances of advanced capitalist countries. In the second section, we review the substantial body of literature that has emerged over the past half century on the relationship between corporate size and ETRs. Alongside this review, we develop a capital-as-power alternative to the theories employed in the existing literature, which analyze the nexus of size and ETRs in terms of political costs or political power. We outline our data and methods in the third section and present our empirical mapping of jurisdictional ETRs in the fourth section. We shift focus in the fifth section to discuss recent debates about the consequences of corporate tax reform. Those debates provide a foundation for thinking about the implications of our findings, a task we undertake in the sixth section. In systematically linking our map of jurisdictional tax rates to the changes in profit margins, capital expenditures, dividend payments, and stock buybacks, our aim in the sixth section is to substantiate empirically the theoretical claims set forth in the second section. We conclude by summarizing our main findings and underlining why we think that issues of taxation deserve much more attention within debates about corporate concentration.
From Tax State to Debt State
Our analysis begins by providing some historical context. Specifically, we draw on some of the recent work of Wolfgang Streeck that provides what we consider to be a useful, if stylized, account of profound transformations that have taken place in the public finances over the past half century. 24 In the post–World War II period, Streeck argues that advanced capitalist countries were “tax states,” characterized by gradually increasing government expenditures, increasing government revenues garnered through progressive taxation, and low levels of public indebtedness. But around 1980, the tax state gave way to a “debt state,” under which gradually increasing government expenditures have combined with stagnating government revenues, declining tax progressivity, and increasing levels of public indebtedness. 25
How did this shift in the public finances occur? According to Streeck, gradually increasing government spending is a functional corollary of capitalist development and the expansion of markets. There is, in Streeck’s own words, “a growing need for public investment and curative measures” to repair “the damage caused by capital accumulation, as well as creating the conditions for further growth.” 26 Yet stagnating tax receipts are more overtly political in the sense that they are a product of organized tax resistance from the top end of the income distribution. 27 In the 1990s, the pressure on tax receipts from the organized resistance of higher-income households was intensified by globalization, which made it easier for large corporations to shift income to low-tax jurisdictions. Increased capital mobility impelled governments to engage in fiscal competition by lowering their top statutory corporate tax rates. 28 In that way, stagnating tax receipts are bound up with the declining progressivity of the tax structure, as wealthy households and large corporations pay less in tax as a percentage of their total income. 29
The logical sequence of the debt state is illustrated in Figure 1. Here we see that the trio of gradually increasing government spending, stagnating tax receipts, and declining tax progressivity leads to increasing inequality and increased savings for wealthy households and large corporations, on the one hand, and increasing public debt, on the other hand. Completing the loop, the increased savings of wealthy households and large corporations are funneled into a growing supply of government bonds. Ultimately what this means is that the public finances have partly shifted from imposing tax liabilities on large corporations and wealthy households to issuing financial assets (i.e., government bonds) to them. The distributional implications of this dynamic are clear, as the debt state fuels asset concentration in the household and corporate sectors. 30

The Logic of the Debt State.
Empirical support for some of the main facets of Streeck’s account of the transformations in public finances can be found in Figure 2. The graph in the top left-hand corner of the figure shows government expenditures and tax receipts as percentages of GDP for the United States and the G7 as a whole. As we see, the gap between expenditures and tax receipts widens considerably from the 1970s onward, as the former gradually increases and the latter stagnates.

The Contours of the US Debt State.
In the graph in the top right-hand corner of Figure 2, we see how the widening gap between government expenditures and receipts translates into increasing levels of public indebtedness as a percentage of GDP. Most relevant for the purposes of our analysis are the changes to the corporate tax structure shown in the bottom two graphs of the figure. In the bottom left-hand graph, we find evidence to suggest that stagnating tax revenues are being driven in large part by the dramatic fall in corporate income tax receipts. The decline in US corporate income tax receipts as a percentage of total tax revenue begins already after World War II but experiences a major collapse from the late 1970s to the early 1980s. If we follow Streeck’s rough periodization, corporate tax receipts made up an average of 22 percent of annual government tax revenues under the tax state (1946–79), and only 10 percent under the debt state (1980–2017). Finally, in the bottom right-hand graph, we see, unsurprisingly perhaps, that the era of low corporate tax receipts was also an era of declining statutory corporate income tax rates. From the mid-1980s to the mid-1990s the US statutory rate is lower than the G7 average. Then from the late 1990s to 2017 the G7 average rate is lower than the US rate. With the passing of the Tax Cuts and Jobs Act at the end of 2017, the US statutory rate dips under that of the G7 average. What we see here is evidence of a downward spiral of fiscal competition in corporate tax policy alluded to in Streeck’s work.
The decline in corporate tax receipts and statutory corporate tax rates has contributed significantly to the stagnation of tax revenues over the past few decades. This suggests that a large part of the shift from the tax state to the debt state can be attributed to transformations in the structure of corporate taxation. For our purposes, the questions we are left with concern the relationship of these transformations in the corporate tax structure to tax progressivity. How has the distribution of tax liabilities changed within the US corporate sector since the rise of the debt state? Are large corporations the main winners of the long-term decline in corporate tax receipts and statutory tax rates? Do these changes in the corporate tax structure fuel concentration and inequality? As we will see in the next section, the existing literature is severely limited in helping us to address these questions.
The State of the Art: Political Costs, Political Power, and the Degree of Monopoly
In the introduction we noted that recent discussions of US corporate concentration tend to ignore issues of taxation. This neglect is puzzling, not only because tax is one area of public policy that has a direct effect on distributive outcomes but also because a significant body of research investigating the relationship between corporate size and ETRs has emerged over the past half century. 31 In diverse fields, ranging from accounting, economics, and finance to law and political science, researchers have been developing statistical models to explore whether the tax structure is biased in favor of large corporations. Why, then, have the findings of these studies been absent from recent discussions of corporate concentration? Part of the reason may be that the research efforts have produced nothing in the way of consensus on the relationship between corporate size and ETRs. 32
Existing studies are usually based on a linear regression model, either univariate or multivariate. Corporate size is specified as the independent variable, while the ETR is the dependent variable. Theoretically, the literature conceptualizes the relation of size to the ETR in terms of political costs or political power. According to political cost theory, large corporations are subject to greater public scrutiny and thus more susceptible to government meddling in the form of regulation and taxation. 33 Political cost theory predicts a positive relationship between size and ETR, resulting in a progressive corporate tax structure. According to political power theory, the inordinate resources of large corporations enable them to shape government regulations and policies in their favor. 34 Thus the key prediction of political power theory is the obverse of the one made by political cost theory: there should be a negative relationship between size and ETR, resulting in a regressive corporate tax structure.
The two theories provide straightforward predictions on the causal connection between corporate size and the ETR. But despite their simplicity, the studies operationalizing these theories have not come close to any consensus. A review of fifty-six existing studies on the relation of size to the ETR uncovers wildly varying results: twenty of the studies reviewed provide evidence for the political cost theory, eleven for the political power theory, fourteen no clear evidence for either theory, and eleven evidence for both theories. 35 Why are there such diverging assessments? One problem lies in research design. The findings of the regression analyses appear to be extremely sensitive to the specifications of each model. 36 Slight variations in assumptions about parameters, the definition of variables (e.g., firm size, ETR), the scope of the sample, and the time period analyzed lead to conflicting results. This fact makes it difficult to use the body of empirical evidence that has been amassed thus far to come to any firm conclusions regarding the size-ETR relation.
Our own research departs from existing studies in three important ways. First, we explore the diachronic relationship between concentration and ETRs. The results of existing studies are reported in static regression tables and give us no indication of how the size-ETR relation unfolds over time. 37 For our purposes, this static approach is of limited use. We are interested, where possible, in mapping the long-term transformation of the corporate tax structure in order to assess its degree of progressivity from the tax state to the debt state.
The second departure is theoretical and requires a lengthier explication. In existing studies, if the sign in the regression analysis is positive and significant, this is taken as satisfactory evidence for the claim that political costs explain or cause the progressive tax structure. If instead the sign is negative and significant, this is taken as satisfactory evidence for the claim that political power explains or causes the regressive tax structure. Rarely are efforts made to specify, let alone explore empirically, the causal mechanism by which size as cost translates into higher ETRs or size as power into lower ETRs.
A higher ETR is simply taken as evidence of large firms’ greater political costs and a lower ETR as evidence of large firms’ greater political power. How do we know whether large firms have greater political costs or greater political power? Because they face, respectively, a higher ETR or a lower ETR. 38 Rather than demonstrating the causal connection between costs or power and the ETR, both theories descend into intractable circularity.
How, then, do we move beyond the limitations of existing theories? We argue that the “capital as power” approach propounded by Jonathan Nitzan and Shimshon Bichler offers a promising alternative for analyzing the size-ETR relationship. 39 We draw on the capital-as-power approach because it endeavors to illuminate the workings of “dominant capital,” the corporate giants at the center of accumulation. Taking cues from the work of Michał Kalecki, Nitzan and Bichler identify the “degree of monopoly” (i.e., net profit margins) as a quantitative proxy for the concentration of power within the corporate universe. 40 In this approach, power is inherently relative. Put simply, the power of large corporations is registered in the degree to which they can raise their ratio of net profit to sales over and above that of other corporations.
This conceptualization of power differs substantially from the notion of “market power” commonly found in studies of concentration. 41 In that literature, “normal profits,” which arise from the marginal productivity of capital in a perfectly competitive environment, are juxtaposed with “economic rents,” which arise from market power (i.e., the capacity of firms to restrict competition and increase barriers to entry, in ways that boost their bottom line and reduce overall welfare). From the perspective of capital as power this dual framework is untenable. As revealed by the “Cambridge controversies” a half-century ago, there is simply no way to determine the marginal productivity of capital. 42 Without a measure of capital’s productivity, it follows that there is no way to determine what a normal profit level is and, as a result, no way of ascertaining the level of economic rents above normal profits. In our view, power is a defining feature of capitalism, and the relevant empirical question is whether power is concentrated or widely dispersed. Rather than juxtaposing market power with an illusory scenario of perfect competition, we are interested in exploring changes in power over time as measured by fluctuations in the degree of monopoly.
As a starting point, our own adaptation of the capital-as-power approach contends that the higher the relative degree of monopoly enjoyed by large corporations, the greater their implied relative power, and the lower their relative ETR. Note that, in contrast to political power theory, we make no hard claims about the line of causality running from power to the ETR. Even if the degree of monopoly is a reasonable proxy for the concentration of power, we argue that it is difficult, perhaps even futile, to try to disentangle its relationship with ETRs in terms of cause and effect. After all, power may enable large corporations to lower their relative tax burden; at the same time, a lower relative tax burden may augment the power of large corporations. Therefore, in our view, it is more fruitful to conceptualize the relationship between power and ETRs as co-constitutive.
This alternative framework allows us to overcome the circular reasoning of existing theories and relieves us of the burden of demonstrating a causal relationship between the two variables (i.e., in the case of political power theory, from size as power to ETR). But what is to be gained analytically from this conceptual maneuvering? Eschewing a rigid causal schema, our alternative framework has the potential to shed new light on the wider consequences of the co-constitutive power-ETR relationship as it unfolds over time. In fact, power, from this alternative vantage point, can only be known by its consequences. 43 A shortcoming of existing theories, whether cast in terms of political costs or political power, is that they have little to say about consequences beyond the simple claim that the ETR is an effect of corporate size. The anticipated consequences of the co-constitutive relationship between power and the ETRs are twofold.
On the one hand, we should expect decreasing relative ETRs and increasing relative power to result in decreasing relative investment by large corporations. Drawing on Thorstein Veblen’s concept of “business sabotage,” Nitzan and Bichler contend that large corporations are more disposed and better able than smaller companies to impose limits on productivity and innovation to maintain profit levels, to the detriment of society at large. 44 Increasing power bolsters the differential capacities of large corporations to engage in sabotage. In our empirical analysis we use capital expenditure data to gauge the relative commitment of large firms to advance productivity, innovation, and job creation through long-term investment.
On the other hand, we should expect decreasing relative ETRs and increasing relative power to alter relations between the firm’s main stakeholders. Here we draw on the expansive literature on financialization, which highlights how the shifts in corporate strategy toward shareholder value have contributed to growing household inequality by raising shareholder payouts and simultaneously reducing investment in operations that might generate gainful job opportunities. 45 Until very recently, this literature has had little to say about the relative susceptibility of large firms versus small firms to this shareholder-value model. 46 To the extent that large corporations decrease their relative tax burden and augment their relative power within the corporate universe, they also increase their relative capacities to alter power relations within the firm by diverting resources from workers to shareholders and managers. An increase in the oligopolistic power of large corporations means they feel less pressure to plough their tax savings back into the expansion of productive capacity. Shielded from competitive pressures to expand capacity, large corporations can instead channel more of their earnings into dividends and stock buybacks to satisfy ever-growing shareholder demands in equity markets.
To explore firm-level power relations, we develop proxies for the interests of firm stakeholders. As mentioned earlier, capital expenditures allow us to gauge the degree to which corporations are committed to advancing productivity, innovation, and job creation through long-term investment. Capital expenditures, in our view, can also be used as a proxy for the interests of ordinary workers, precisely because they provide the foundation for employment and wage expansion. We use dividend payments and stock buybacks as a proxy for the interests of shareholders and managers, and we see the interests of these two stakeholders as aligned because executive pay has become increasingly tied to stock market performance through restricted stock and stock options. 47
To recap, our theoretical approach can be summarized with the following propositions:
We should expect an increase in the degree of monopoly (power) of large corporations to be bound up with a decrease in their ETR relative to smaller corporations. Rather than simple cause and effect, the relationship between power and the ETR is co-constitutive.
As large corporations increase their power and lower their ETR relative to smaller corporations, we should expect them to decrease their relative investment.
As large corporations increase their power and lower their ETR relative to smaller corporations, we should expect them to increase their relative capacities to divert resources from workers to shareholders and managers.
The third and final way that our research departs from existing studies of the size-ETR relation is in examining jurisdictional ETRs. The common strategy is to regress size variables against the worldwide ETR, but that gives us no indication of the role domestic and foreign tax structures play in shaping the ETRs of corporations disaggregated by size. On the flipside, the scant literature on jurisdictional ETRs looks almost exclusively at large corporations. 48 This narrow emphasis gives us no sense of where large corporations stand relative to small and medium-size ones. In other words, these studies tell us nothing about the relationship between jurisdictional ETRs and corporate concentration. As far as we are aware, ours is the first study to systematically analyze jurisdictional ETRs disaggregated by size. Examining jurisdictional ETRs is especially important in the context of globalization. It is often implied in the literature that the type of corporation that enjoys a foreign tax advantage is a multinational one, specifically a large multinational one. 49 Mapping jurisdictional ETRs by size will allow us to assess whether large corporations do in fact enjoy a foreign tax advantage and how this advantage has changed over time.
Data and Methods
Our study uses the Compustat database of corporate financial statements. In Compustat, current income taxes can be broken down into three categories: federal income taxes, state income taxes, and foreign income taxes. 50 Compustat also offers data on pretax income, which can be further broken down into pretax domestic income and pretax foreign income. These items allow us to create four jurisdictional measures: the worldwide ETR (federal, state, and foreign income taxes as a percentage of pretax domestic and pretax foreign income), the foreign ETR (foreign income taxes as a percentage of pretax foreign income), the federal ETR (federal income taxes as a percentage of pretax domestic income), and the state ETR (state income taxes as a percentage of pretax domestic income).
Although Compustat is one of the best sources for detailed historical, firm-level data on ETRs, it has drawbacks. Compustat has data extending back to 1950, but specific data for computing worldwide ETRs go back only to 1970. Coverage for jurisdictional ETRs (federal, state, and foreign) is even more limited, going back only to 1984. The data allow us to examine worldwide ETRs for the entirety of the debt state but only the tail end of the tax state. For jurisdictional ETRs we can assess their transformations only under the debt state. Compustat includes data on listed firms. According to the World Federation of Exchanges data available from the World Bank, on an annual basis the average number of domestic (i.e., US-headquartered) listed companies from 1980 to 2018 is 5,796. 51 This means that for the worldwide ETR our coverage is very comprehensive, with a yearly average of 5,020 nonfinancial US corporations reporting relevant data from 1980 to 2018. For jurisdictional ETRs, however, the size of our sample decreases significantly, with a yearly average of 1,393 nonfinancial US corporations reporting relevant data items from 1984 to 2018.
The focus on listed companies has important implications for the study of concentration. Going public is usually associated with big business, and our sample does not encompass the thousands of much smaller companies, including so-called mom-and-pop businesses, that may have incorporated but have not listed on the stock market. The exclusion of those unlisted firms from our sample means that we cannot assess the extent of concentration for the US corporate universe as a whole. Nevertheless, for a number of reasons we think that Compustat is useful in exploring issues related to corporate concentration. First, despite the limited sample, there is still a wide variation in the size of listed corporations in our analysis. For example, the 2018 sample for the bottom 90 percent includes big players such as Keurig Dr Pepper, with assets of $49 billion, all the way down to lesser-known entities such as Plastic2Oil, with assets of $796,000. Thus, it should be stressed that our analysis is not just a comparison of giant and very large. Second, the significance of concentration relates in part to its bearing on competition. Large corporations are more likely to regard medium-size listed companies as a threat to their competitive position than the thousands of small unlisted companies. Part of the rationale for medium-size companies to go public in the first place is to raise finances in a bid to move into the upper echelons of dominant capital. The gap between large and smaller listed companies arguably tells us more about competitive dynamics than the gap between large firms and the corporate universe as a whole. Finally, the fact that we look solely at listed companies means that our findings are probably conservative. Whether we find evidence of a progressive or regressive corporate tax structure, the magnitudes would likely be amplified with a larger sample of smaller companies.
The first step in our empirical analysis is to gather together all US nonfinancial corporations that report the relevant data on ETRs and rank them annually from largest to smallest based on their total revenues. Next, we determine a cutoff point that allows us to compare the ETRs of large and smaller corporations. In the literature on corporate concentration, there are two main options for determining this cutoff point. We can follow the standard aggregate measure of concentration and focus on a fixed number of corporations (e.g., top 50 or top 100), or we can focus on a fixed proportion of corporations (e.g., top 1 percent or top 10 percent). 52 One problem with the standard aggregate measure of concentration has to do with the fact that the numerator (top corporations) is fixed, while the denominator (total corporations) is constantly changing. As a result, a change in the ETR of smaller corporations might be due to a change in the total number of corporations in the denominator rather than a meaningful change in the rate at which they are taxed. Given the ambiguities associated with the standard aggregate method, we follow the latter method and use the top decile as our proxy for dominant capital.
In our sample we include both profitable and unprofitable corporations. In this way our selection method differs from the standard procedure, which is to exclude loss-making companies.
53
Our decision is informed by our specific interest in how corporate taxation relates to concentration. In his landmark study
One final methodological aspect of our study worth noting concerns the calculation of the ETR. Anyone who has worked with firm-level tax data knows the frustrations involved in developing historical measures. For individual companies, the ETR can swing wildly from year to year; and during major crises, many companies report negative pretax income, which makes the tax rate impossible to interpret (on the surface, a negative tax rate may seem like a good thing for a company, but not if it is the product of a negative denominator and a positive numerator). A way around these problems is to follow a technique developed by Reuven Avi-Yonah and Yaron Lahav and calculate the aggregate ETR. 55 Instead of calculating the ETR for each individual company and then averaging those individual rates, an aggregate ETR sums together all companies’ income taxes during a certain period and divides them by all companies’ pretax income during that same period. To smooth out the business cycle, we can sum together the data in the numerator and the denominator over three-, five-, or even ten-year periods.
But even the use of a long-term aggregate ETR is often not enough to smooth out the effects of major financial crises. Heavy losses were incurred during the dot-com collapse and the global financial crisis, and those losses were particularly pronounced for smaller corporations, whose domestic pretax income turned sharply negative. Even when ETRs are aggregated across ten years, the inclusion of these crisis years still leads to a massive increase in the ETRs of smaller corporations. It would be easy for skeptics of concentration to dismiss the results of the disaggregate analysis, claiming they have been distorted by these crises. Erring on the side of caution, and ensuring consistency across the sample, we exclude data for years in which the annual profits for the top 10 percent or the bottom 90 percent as a whole are negative.
Mapping Jurisdictional Tax Rates
With some of the main methodological issues outlined, we now turn to our main findings. Figure 3 shows the worldwide ETR (federal, state, and foreign income taxes as a percentage of pretax domestic and foreign income) for US nonfinancial corporations in Compustat disaggregated by size. In the bottom part of the figure, we find bars with the ETRs. The dark grey bars plot the worldwide ETR for the top 10 percent in Compustat, and the light grey bars plot the worldwide ETR for the bottom 90 percent. The line above the bars allows for an easier comparison of the worldwide ETRs of the top 10 percent and the bottom 90 percent, expressing them as a ratio. The ratio can be interpreted as a measure of the progressivity of the domestic and foreign tax structures. 56 A ratio of one indicates a proportional tax regime (i.e., large corporations are subject to the same ETR as smaller corporations), a ratio above one indicates a progressive tax regime (i.e., large corporations are subject to a higher ETR than smaller corporations), a ratio below one indicates a regressive tax regime (i.e., large corporations are subject to a lower ETR than smaller corporations).
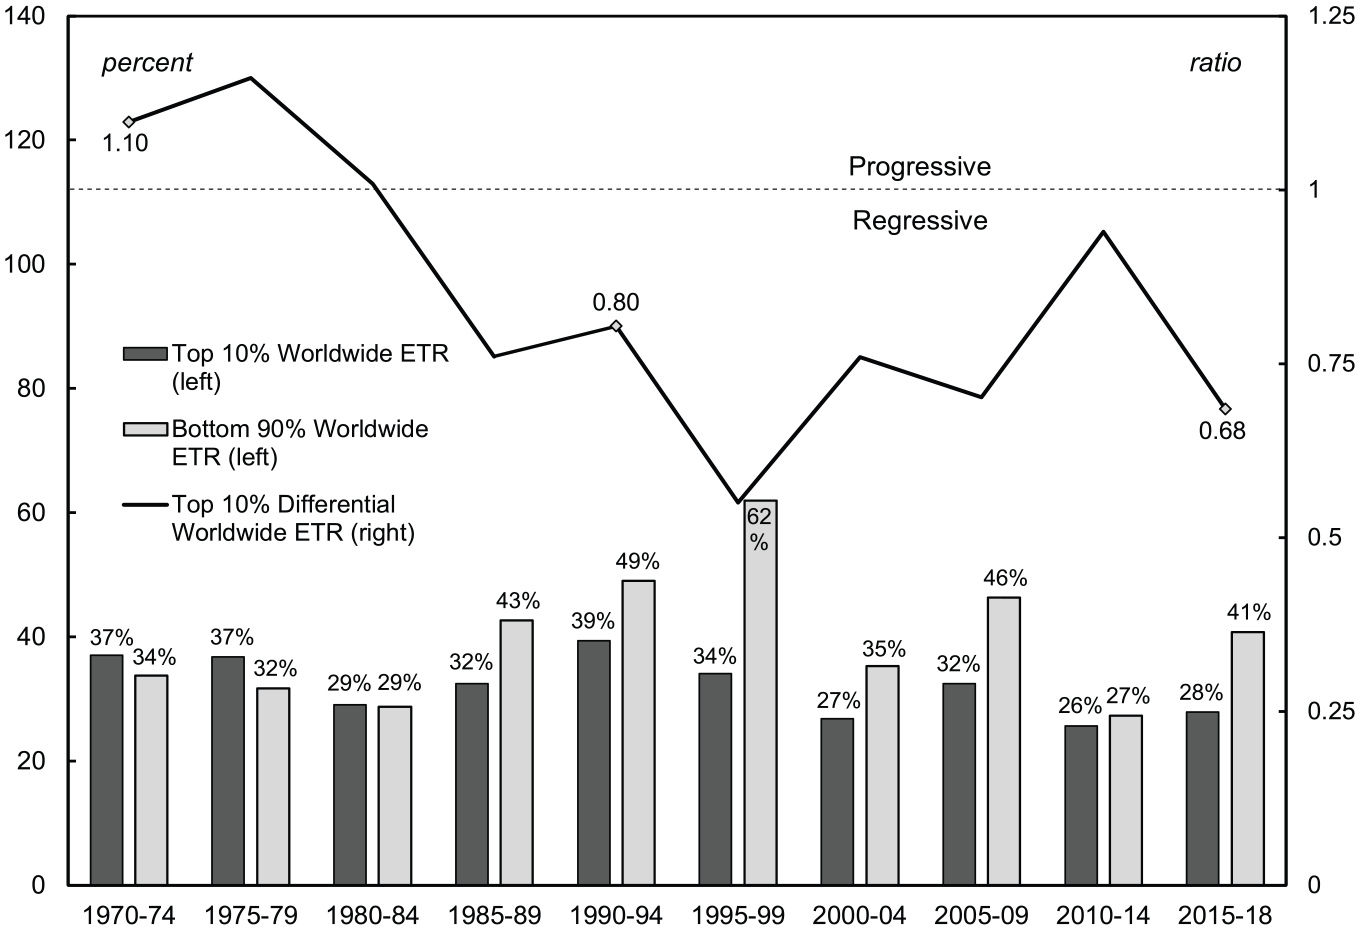
Worldwide Effective Tax Rates: Top 10 Percent versus Bottom 90 Percent.
Viewed over the entire period, the worldwide ETR for the top 10 percent declines from 37 percent in 1970–74 to 28 percent in 2015–18. The worldwide ETR of the bottom 90 percent exhibits an inverted U-shape. From 34 percent in 1970–74, it climbs to a high of 62 percent in 1995–99 before falling to 41 percent in 2015–18. What is most noteworthy in Figure 3 is the persistent regressivity in the corporate tax structure from 1980 onward. During the 1970s, at the tail end of the period of the tax state, the worldwide corporate tax structure is progressive, with large corporations facing higher ETRs than smaller ones. With the dawn of the debt state in the early 1980s, the tax structure turns proportional, with the worldwide ETR of large corporations equaling that of smaller corporations. From the mid-1980s the worldwide corporate tax structure turns regressive and has remained so for almost four decades. In the most recent period from 2015–18, the worldwide ETR of a large corporation is thirteen percentage points lower than the worldwide ETR of a smaller corporation. 57
What accounts for the persistently regressive worldwide ETR since the mid-1980s? Is the gap between the worldwide ETRs of large and smaller corporations the product of foreign tax structures? In what ways do domestic taxes, federal and state, contribute to this gap? A hallmark of the latest phase of globalization is the geographical dispersion of corporate activity. As a result, we need to take into account all three tax structures in order to determine what is driving the worldwide ETRs of the top 10 percent and bottom 90 percent.
Figure 4 presents our findings on jurisdictional ETRs. The graph in the top left-hand corner of the figure focuses on the domestic ETR, which measures federal and state income taxes as a percentage of pretax domestic income. As in Figure 3, the bars in the graph show the respective ETRs of the top 10 percent and bottom 90 percent, and the line gauges the overall progressivity of the tax structure. Here we see that the domestic ETR of the top decile increases slightly over the entire period, from 30 percent in 1984–89 to 34 percent in 2010–18. The same thing can be said for the bottom 90 percent, as its domestic ETR increases from 43 percent in 1984–89 to 50 percent in 2010–18. What is most remarkable about the top left-hand graph is the pronounced gap in the domestic ETR of large and smaller corporations. The domestic tax structure is persistently regressive throughout the entire period, and in 2010–18 the domestic ETR of large corporations is a mere 0.68 times the size of the domestic ETR of smaller corporations.

Jurisdictional Effective Tax Rates: Top 10 Percent versus Bottom 90 Percent.
The next two graphs in the figure break down the domestic ETR into its federal and state components. In the top right-hand corner, we see that the federal ETR of the top 10 percent increases from 25 percent in 1984–89 to 30 percent in 2010–18. Meanwhile the bottom 90 percent sees its federal ETR increase from 36 percent to 44 percent over the same period. The federal tax structure is persistently and highly regressive, with the ratio hovering between a high of 0.78 in the 1990s to a low of 0.70 in 2010–18. The graph in the bottom left-hand corner of Figure 4 shows the state ETR. As a percentage of domestic income, state taxes are obviously much smaller than federal taxes. But what we find is that the state tax structure is even more regressive than the federal one. Over the entire period the state ETR of the top 10 percent is considerably lower than that of the bottom 90 percent, and the state tax structure becomes increasingly regressive over time.
In the bottom right-hand corner of Figure 4 we find a graph with the foreign ETR. One thing that immediately stands out is the sharp decline in the foreign ETR of both the top 10 percent and the bottom 90 percent. For the top decile, the foreign ETR falls from 47 percent in 1984–89 to 25 percent in 2010–18. For the bottom 90 percent, the foreign ETR decreases from 40 percent to 29 percent over the same period. As for the progressivity of the foreign tax structure, we see that until most recently the foreign ETR is progressive, with large corporations consistently facing higher foreign ETRs than smaller ones. But in the latest period, 2010–18, the foreign tax structure dips sharply into regressive territory, with the foreign ETR of the top decile only 0.90 times the size of the foreign ETR of smaller corporations.
The dramatic fall in the foreign ETRs of both large and smaller corporations coheres with the widely accepted notion that tax competition has intensified with the increasing globalization that has come under the debt state. But our findings on the progressivity of the foreign tax structure may seem somewhat counterintuitive. It is common to assume that
Taken together, the mapping exercise in Figure 4 suggests that the regressive worldwide tax structure since the mid-1980s is due to the persistently regressive domestic tax structure, on the one hand, and the recent turn to regressivity in the foreign tax structure, on the other. According to our findings, declining corporate tax progressivity is, as Streeck suggests, a key feature of the debt state as it has evolved over the past few decades. How do we make sense of the persistently regressive worldwide tax structure? What is the significance, if any, of the finding that large corporations consistently face lower ETRs than their smaller counterparts? Before we address these questions, we pivot in the next section to a discussion of recent debates about the consequences of corporate tax reform. Evaluating both sides of this debate puts us in a better position to address questions related to the wider implications of our findings. This eventually bring us back to the thorny question of power.
Debating Corporate Tax Reform
In December 2017, Donald Trump and the Republican Party scored a major legislative victory as the Tax Cuts and Jobs Act (TCJA) was signed into law. The legislation introduced sweeping changes to the corporate tax code, replacing the global tax system with a territorial one, altering the system of deductions and credits, and imposing new charges on repatriated earnings. But the hallmark of the TCJA is undoubtedly the sharp reduction in the statutory corporate tax rate from 35 to 21 percent, which, as we saw earlier in our discussion of the transition from the tax state to the debt state, amounts to the biggest corporate tax cut in US history.
As with most of Trump’s policies, the TCJA has been controversial and has sparked a rather heated debate about its anticipated impact. 59 For supporters, the tax cut will play a significant role in reducing the cost of capital and thereby incentivizing companies to increase investment. As companies expand productive capacity in the wake of the tax cut, they will hire more employees, and the increased demand for labor will in turn drive up wages. The most sanguine among TCJA supporters claim that the tax cut’s boost to economic activity will be so immense that it will end up increasing government revenues. For critics, the tax cut is expected to have a negligible effect on investment. The more likely outcome is that corporations will simply replicate their response to George W. Bush’s tax cuts and use the windfall to increase dividend payments and stock buybacks. Given that the top percentile of households directly or indirectly owns 40 percent of corporate shares, and the top decile 84 percent, those skeptical of the TCJA argue that it is likely to fuel widening inequality. 60 And rather than paying for itself, critical voices also maintain, the tax cut will lead to higher budget deficits and public indebtedness.
It is probably too early to come to any definitive assessment of the effects of the TCJA, but preliminary studies are nevertheless beginning to surface. In the 2019 Economic Report of the President, Trump’s own Council of Economic Advisers (CEA) celebrates what it claims are the unequivocal successes of the TCJA. 61 The report emphasizes the results of business surveys, which show a slight post-TCJA increase in businesses’ reporting plans to increase capital expenditures in the next three to six months, as well as an increase in executives agreeing with the statement that “now is a good time to expand.” 62 The report also notes a post-TCJA downturn in Morgan Stanley’s index of planned capital expenditures but a considerable uptick in core capital goods orders. 63 When it comes to direct evidence of actual business investment, the CEA report shows a surge in the “real” dollar amount of private nonresidential fixed investment by noncorporate businesses during the first three quarters of 2018.
There is, however, preliminary evidence that tempers the CEA’s optimistic view. As an alternative to the CEA’s focus on
By far the most rigorous study of the early impact of the TCJA is from a group of economists at the IMF. 66 Again, the authors observe that growth in private nonresidential investment in 2018 was higher than had been forecast before the enactment of the TCJA. Yet according to their model, this growth had very little to do with the effects of the tax cut in lowering the cost of capital. Instead they attribute the investment surge largely to rising aggregate demand, which is a product of personal income tax cuts and government spending increases. Why, then, was the investment response to the TCJA so muted? According to the IMF researchers, the limited response is due largely to the rising “market power” of large corporations. Their analysis shows that the greater the market power of corporations (i.e., the higher their markup), the less likely it is that they will raise their investment in response to tax cuts.
The IMF report highlights one of the key dividing lines between supporters and critics of the TCJA. Those in favor of tax cuts base their claims about its positive impacts on the assumption of a “power-less” economy characterized by perfect competition and frictionless markets. 67 Animated by the equalizing forces of competition, all corporations, according to this view, are compelled to plough windfall profits from a tax cut back into productive capacity lest they lose ground to rivals. But critics point out that these competitive assumptions do not fit with empirical facts. In the real world where market power is seen to prevail, critics claim that a large portion of corporate profits represent so-called economic rents—returns to monopoly power—rather than the “normal” returns to investment that occur under competitive conditions. 68 Slashing taxes on monopoly profits, it follows, provides little incentive to invest.
These timely debates on corporate tax reform provide a foundation for exploring the consequences of our own findings, but with two caveats. First, whereas our analysis focuses on ETRs, the debate about the TCJA centers on the effects of changes to the statutory rate. For us, however, the difference is somewhat trivial. Both critics and supporters of the TCJA would likely agree that cuts in the statutory rate matter only insofar as they affect what companies actually pay in effective terms. 69 Second, and most significantly, even though the critics of the TCJA acknowledge power, their use of the concept differs substantially from our own. As mentioned earlier, we reject the concept of market power because it is anchored in the problematic assumptions of marginal productivity theory. Rather than juxtapose market power to a power-less scenario of perfect competition, we argue that power is always present in a capitalist system. What interests us is how the distribution of that power changes over time as measured by fluctuations in the degree of monopoly. This may seem like a trivial distinction, but in the next section we will see that it leads to a very different assessment of the consequences of changes to the corporate tax structure.
Taxes, Power, and the Financialization of the Firm
At this point, it is perhaps useful to restate our main theoretical proposition. Earlier we surmised that a higher relative degree of monopoly for large corporations implied greater relative power and a lower relative ETR. Thus far our empirical mapping has indeed shown that large corporations have faced lower relative worldwide ETRs since the mid-1980s. What remains to be explored is how changes in the relative ETR are intertwined with the relative power of the top decile of corporations and how that, in turn, affects the distribution of power within the firm.
In the upper left-hand graph of Figure 5 we present data on the degree of monopoly, our proxy for the concentration of power. The bars in the graph show the net profit margins of the top 10 percent and the bottom 90 percent, and the line above shows the ratio of their net profit margins. In the 1970s, when the worldwide tax structure was progressive, we see that the net profit margins of large and smaller corporations were more or less equal. But as the worldwide tax structure turns regressive in the 1980s, the relative profit margins of large corporations start to increase. Since the 1990s, the degree of monopoly for large corporations has been consistently double that of smaller corporations. A sustained reduction in the relative tax burden of large corporations over the past few decades is bound up with a sustained increase in their relative power.

The Degree of Monopoly and the Financialization of the Firm: Top 10 Percent versus Bottom 90 Percent.
The next step in our analysis is to investigate the impact of the co-constitutive relationship of power and the ETR on investment. To this end, we return to debates about corporate tax reform. Recall that for both supporters and critics, the primary indicator of the success of the TCJA was whether or not it spurred investment. Investment was the indicator of success because it would constitute evidence that the tax cut was creating widespread prosperity and not merely serving the narrow interests of shareholders. A tax-cut-induced surge in investment works in the interests of society at large insofar as expanding capacity should, in theory, provide the basis for increasing employment and higher wages. The power-less world of TCJA supporters envisions a
The graph in the upper right-hand corner of Figure 5 shows the capital expenditures, one of the most common measures of investment, for large and smaller corporations as a percentage of their total revenues. Previously, in Figure 3, we noted a decline in the worldwide ETR of the top decile, from 37 percent in 1970–74 to 28 percent in 2015–18. As the bars in the upper right-hand graph in Figure 5 indicate, the falling worldwide ETR of the top 10 percent has been accompanied by decreasing investment, with their capital expenditures falling from 9.2 percent of revenues in the 1970s to 6.6 percent most recently. Meanwhile, the capital expenditures of the bottom 90 percent, which has faced persistently higher ETRs over the past few decades, have been stable and in fact have increased in the most recent period. The relative measure of capital expenditures in the line above the bars of the graph presents an even more striking view of the relationship between tax and investment. In the 1970s, when the worldwide tax structure was progressive, the capital expenditures of large corporations were higher than those of smaller corporations. With the worldwide tax structure descending into persistent regressivity from the mid-1980s onward, the relative capital expenditures of large corporations steadily declined. By 2010–18 the capital expenditures of large corporations as a percentage of revenues were 0.63 times the size of smaller corporations.
We have seen that as power becomes more concentrated, large corporations face a lower relative ETR and simultaneously curtail their relative investment. Where does this leave the question of shareholder enrichment in our analysis? Critics of the TCJA claim that large corporations with market power use their tax windfall not to invest but to increase dividend payments and stock buybacks, thereby boosting the incomes of shareholders and top executives, the vast majority of whom fall within the top 10 percent of the population. Taking a longer-term view, we find that things are a bit more complex. The graph in the bottom left-hand corner of Figure 5 shows a metric of shareholder value, which is simply dividend payments and stock buybacks as a percentage of revenues. 70 In the bars of the graph we see a steady increase in the dividend payments and stock buybacks of the top decile since the 1970s. Yet what we also see is a corresponding rise in the dividend payments and share buybacks of the bottom 90 percent over the same period. As shown in the line above the bars, it is clear that, aside from a peak in the 1990s, large corporations have been only slightly more committed to shareholder value than their smaller counterparts. The secular rise in shareholder-value orientation evidenced here makes it difficult to link increasing dividends and share buybacks directly to the increasing regressivity of the worldwide tax structure. But that is not to say that shareholder enrichment is irrelevant or insignificant to our analysis. As a key aspect of the financialization of the firm, the rise of shareholder value can be viewed as a redistributive process that shifts power from workers to managers and shareholders. 71 We can therefore assess the relationship between the tax structure and shareholder value not only in terms of revenues dedicated to shareholder disbursement but also in terms of the attendant shifts in firm-level power relations. To this end, we construct an index of shareholder power, expressed as a ratio of dividend payments and stock buybacks, a proxy for the interests of shareholders and managers, to capital expenditures, a proxy for the interests of ordinary workers.
The graph in the bottom right-hand corner of Figure 5 presents our index of shareholder power for the top 10 percent and the bottom 90 percent. These indices of shareholder power offer a staggering picture of the transformations of power relations within large and smaller corporations over the past few decades. In the 1970s, when the worldwide tax structure was progressive and corporate concentration was relatively low, the ratio of shareholder power in large corporations was 0.28, slightly lower than the ratio of 0.30 in smaller corporations. But, with the regressive turn in the worldwide tax structure, the dynamic flips. In the 1980s, in the beginning phase of tax regressivity, the power of shareholders within large and smaller corporations equalizes at a higher ratio of 0.42. Since the 1990s, shareholder power within both large and smaller corporations has increased, but the upturn has been much more pronounced for the former than the latter. Now, in the last decade, for every dollar of capital expenditure, large corporations have spent ninety-three cents enriching their shareholders.
Although the contemporary rise of shareholder value is a common experience in the corporate universe, it has had altogether different effects on power relations within large and smaller corporations. A sustained reduction in their relative tax burden has not compelled powerful corporations to plough their tax savings back into productive capacity. On the contrary, our research demonstrates that as big business becomes more disposed to short-term shareholder-value enhancement that directly and disproportionately benefits the asset-rich, it becomes less disposed to advancing productivity, innovation, and job creation through long-term capital expenditures that benefit ordinary workers. This means that the corporate tax structure is bound up not only with corporate concentration but also widening inequality in the household sector. The dual rise of concentration and inequality is precisely what we expect under the debt state. Widening income inequality is usually attributed to declining progressivity in the individual or personal income tax system. 72 But our research suggests an important role for corporate taxation as well. For the past few decades, persistent regressivity in the worldwide tax structure has furnished big business with a distinct tax advantage, one that coincides with a bolstering of its relative power within the corporate universe and a reconfiguration of power relations within and beyond the firm.
Conclusion
Our article has explored the contribution of corporate taxes to concentration, building an analysis with reference to two different sets of ideas. First, we contextualized our analysis historically through an engagement with the work of Wolfgang Streeck, which argues that advanced capitalist countries were transformed in the 1980s from tax states into debt states. In particular, we explored one facet of this broad shift: declining tax progressivity within the corporate sector. We did this by developing the first map of the jurisdictional ETRs of corporations disaggregated by size. Our findings indicate that the worldwide ETR was progressive in the 1970s at the tail end of the tax state, but it has been marked by persistent regressivity since the rise of the debt state in the 1980s. Delving into jurisdictional measures of the ETR, we found that the regressive worldwide tax structure is a product of persistent regressivity of the domestic tax structure combined with the regressive turn in the foreign tax structure in recent years. Second, we examined some of the wider implications of our findings on jurisdictional ETRs by anchoring them within the capital-as-power approach. We empirically substantiated our main theoretical claims by demonstrating how persistent regressivity in the worldwide tax structure is bound up with the increasing relative power of large corporations within the corporate universe and a shift of power within large corporations from workers to shareholders and managers.
Overall, our findings suggest that issues of tax deserve much more attention within current debates in the United States about corporate concentration. In making this claim, we are not trying to diminish the importance of other policies aimed at tackling rising concentration. If anything, the pervasiveness of concentration necessitates a multipronged strategy, aimed not only at corporate taxation but also antitrust and any other area of policy that has a substantive impact on distributive outcomes. Perhaps most importantly, our findings put paid to the notion that lower corporate taxes will “trickle down” to the benefit of everyone in society. On the contrary, in a system in which successive rounds of corporate tax reform translate into a persistently regressive corporate tax structure, wealth and income become further concentrated at the top. The public, in many ways, already seems to have an intuitive grasp of these realities. Despite the concerted public relations efforts of the Republican Party and the right-wing think tanks that support it, the TCJA, both before and after its implementation, has never been popular with voters. 73 Channeling that intuitive discontent into support for restoring progressive taxation just might help to reverse some of the grave inequities of power that have built up under the debt state.