
Abstract
Keywords
Introduction
Numbers occupy a central place in global governance. From statistics of economic growth to democracy indices, they shape actors’ perceptions, and thus their decisions. Economic statistics in particular influence global governance in crucial ways. International organizations (IOs) such as the World Bank, IMF, and OECD have put economic data central to their contemporary approach to global economic governance. 1 It is the informational background to the Sustainable Development Goals (SDGs) and conditional lending, as well as to economic policy and socio-economic research more generally. Such data, so the idea, allows us to track national economies over time and to compare them with each other.
These aims have inspired the norms underpinning international economic statistics.
2
Three goals are particularly important for our analysis: first, countries should subscribe to a shared global statistical standard to make their data comparable, and hence use a harmonized set of standards (
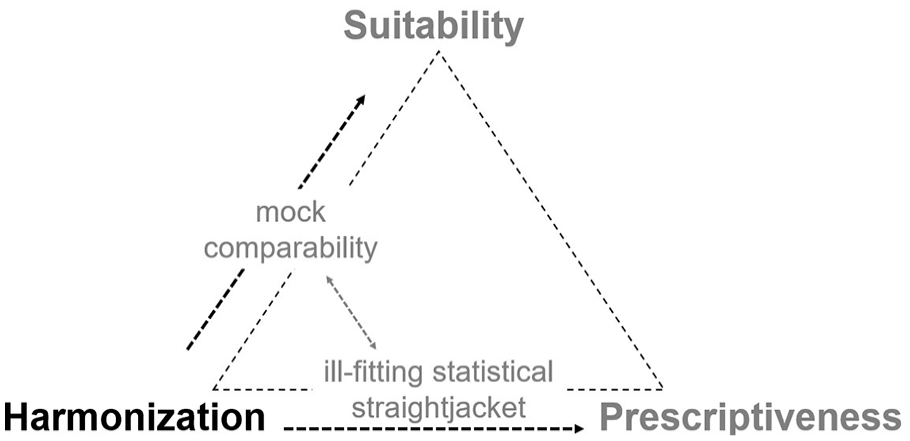
Yet as we show, far from being complementary, fundamental tensions exist between these desiderata of official statistics. In stylized terms, to achieve any two, the third must be sacrificed – a dynamic we label the statistical trilemma. Combining harmonization and prescriptiveness generates potentially
To illustrate the statistical trilemma at work, we discuss three prominent domains of statistics in detail: the gross domestic product (GDP) as the central metric in the System of National Accounts (SNA), poverty indicators, and unemployment statistics. For GDP, we find that standard-setters have prioritized harmonization and that many of GDP’s commonly diagnosed defects are rooted in the tension between suitability and prescriptiveness. The case of unemployment statistics is an example of mock comparability. Because differences in local circumstances are more obvious, the lack of data comparability is more conspicuous than for GDP. Poverty statistics, in contrast, are fragmented, because home-grown yardsticks dominate measurement. An International Poverty Line, meant to promote international comparison, offers only an unsatisfactory attempt to circumvent statistical fragmentation. To evidence the relevance of our trilemma-framework beyond these three cases, we also briefly discuss inflation, trade, and debt statistics as shadow cases, in which the trilemma logic surfaces equally. For all of these, we draw on international statistical guidelines and compilation manuals, in combination with secondary data. From the latter, we place existing findings within the trilemma framework.
The argument has broader implications for policymakers and for scholars of international politics, including International Relations (IR) and International Political Economy (IPE). For the growing literature on the politics of statistics and other numbers in global governance, we provide a framework for understanding the constraints on what statistics can achieve and on the actors that govern them. Echoing themes in previous work, our analysis implies that statistics as a knowledge format have
Thus, when international statistics betray our expectations, that does not necessarily signal a lack of political will, expertise, or resources. On the one hand, at least in part our argument exculpates statistical standard setters and data compilers for potential statistical shortcomings, for example poor comparability, data fudges, or low context sensitivity. On the other hand, it limits what we could expect from statistics as governance tools even under the most propitious conditions. 4
The following section briefly discusses the politics and history of economic statistics, and of numbers more broadly, in global governance and international development. This provides context for the three desiderata that make up our theoretical framework. We define each of these desiderata, describe the tradeoffs between them, and package this together in the framework of the statistical trilemma and its outcomes. The article continues with empirical case studies on GDP and national accounts, unemployment indicators, and poverty lines. We then more briefly apply the trilemma framework to statistics of debt, FDI, and trade. To conclude the article, we discuss the implications of our argument for researchers and policymakers.
Global statistical ambitions and their limits
Existing literature highlights the role of and power of numbers in global politics across a wide range of issue areas, including human trafficking, 5 the UN Human Development Index, 6 the Millennium Development Goals, 7 and corruption. 8 In general, such literature argues that numbers and indicators enable ‘governance at a distance’. 9
Economic statistics and indicators also carry authoritative knowledge about social and economic life in domestic contexts. 10 Policymakers, citizens, and investors draw on them to guide their decisions. Choices based on inaccurate information generate poor outcomes. 11 Data biases can systematically disadvantage people, for example along racial or gendered lines, 12 when whole sectors are unduly valorized, 13 or when entire countries’ economic contributions are unfairly distorted in the data. 14
Nevertheless, the ambition to ‘quantify the world’ and create a border-spanning statistical view of social life has flourished for roughly a century now. 15 The labor movement had championed systematic unemployment statistics already in the late 19th century. 16 Even if they were not formally harmonized, international discussions about such measures in the newly-founded International Labour Organization in the 1920s reflected the breadth of this concern. 17 National Income measures, the predecessors to present-day GDP, had initially been developed for isolated national contexts. 18 Yet after the Second World War, leading statisticians proselytized for them around the world. 19
Four factors came together. First, colonial metropolises had early on kept economic records of their transactions with dependencies, not least to monitor surplus extraction and its interaction for example with international payment imbalances. 20 Second, after decolonization, newly independent countries frequently empowered technocratic elites trained at leading British or American universities. 21 These technocrats diffused a predilection for fostering economic growth and quantitative macroeconomic management outside the West. Third, UN policy elites themselves championed and promoted a more quantified, evidenced-based approach to economic development, and advocated it around the world. 22 Finally, international organizations, in particular the IMF, were tasked to monitor financial flows, creating a need for frequent data provision from IMF member states. 23 Together, these factors universalized economic statistics as a tool of statecraft and turned the availability of comprehensive and comparable economic statistics into a common-sensical, hardly questioned ambition.
Since then, the role of economic statistics in international affairs has increased further. Initial development thought prioritized economic growth and hence GDP. While GDP has remained central, indicators for living standards and poverty levels gained prominence since the 1970s. 24 The Human Development Index (HDI) broadened the notion of development to include health and education alongside income. Since then, the dozens of indicators in the Millennium Development Goals (MGDs) and Sustainable Development Goals (SDGs) have heralded a data-saturated ‘World That Counts’, in the words of the UN-sponsored Data Revolution Group. 25
While often presented as technocratic and neutral, this ‘quantification’ of global governance is political. The translation of complex social phenomena into numbers obscures contestation over
Competing expectations of international economic statistics
For our purposes, three expectations are particularly important: (1) economic statistics should capture socio-economic realities on the ground, (2) they should be compiled according to unambiguous procedures (so that we actually know what is in them), and (3) they should be comparable across countries. We translate these ambitions into three desiderata of statistical standards:
Let us consider each of these briefly in turn. Suitability means that both the concepts underlying a measure and the actual measurement procedure should be relevant to a country’s social-economic conditions. It can be unproblematic when the entities being measured are unambiguous and directly observable – such as the number of containers leaving a sea port per year. Matters get complicated, however, once the concepts in question require translation into the local context. 28
Traditional unemployment measures, for example, may carry little information in a country where informal employment dominates. Classic debt measures can be seriously misleading when a government’s liabilities are tucked away in derivatives deals, or when one country issues debt in its own currency while another has to borrow US Dollars. Consumer price indices may miss rising costs of living when families’ disposable incomes are primarily squeezed through climbing real estate prices. How important such suitability gaps are differs across countries, depending on the structure of their economy, the strength of the welfare state, gendered and racial fault lines in society, factors such as a potential reliance on migrant labor, and so on.
The same applies to actual measurement approaches. Household surveys may offer little information when people move around frequently or their shelter has no unambiguous address. Official payroll data will systematically miss informal employment, just as growth figures ignoring the digital economy miss an important part of wealth creation. 29 Price developments in supermarkets are a poor guide to changing living costs where people grow most of their food on their land.
In consequence, it is essential that statistical standards are suitable to the country they try to reflect. That standard is a pragmatic one: it is inevitable that ‘complexity and contextual detail is “lost in translation” in the pursuit of quantification and comparability’. 30 Suitability means that there are no glaring mismatches between a country and a measurement standard and, easier to spot, that the mismatch does not vary enormously across countries.
Prescriptiveness means that measurement standards should be as unambiguous and transparent as possible. Clear guidelines allow government statisticians to adhere to internationally accepted practices faithfully and buttress public confidence in official statistics. International standards such as the SNA, the Balance of Payments Manual (BPM), or the Government Finance Statistics Manual are highly detailed publications. The most recent SNA, for instance, spans more than 600 pages and is supported by over 40 handbooks and compilation guides. Prescriptiveness is meant to avoid random noise in or deliberate manipulation of data, particularly when getting the numbers wrong might obscure critical problems such chronic payment imbalances. Therefore, the IMF permits little flexibility in the production of financial and macroeconomic statistics, and monitors compliance with standards through Article IV consultations. 31
Harmonization, finally, requires that countries subscribe to shared standards such as the SNA, and the concepts, classifications, and definitions specified in them. 32 The demand for comparable data took off after the Second World War, with increased foreign trade and growing foreign exchange markets. 33 Systematic comparisons of country ‘performance’ have become common in the form of benchmarking. 34 As economic globalization has progressed and policy has become increasingly quantified, the demand has grown further.
Yet, harmonization is not necessarily rigid. Shared standards often allow flexibility to encourage international take-up despite diverse data sources or compilation methods and varying degrees of quality. Desrosières called this the harmonization of ‘products’ as opposed to harmonization of ‘methods’. 35 That is, the outputs can be harmonized even if the inputs are not. Ambiguity of this sort is common in international agreements, frequently by design. 36
We contend that there are substantial trade-offs between suitability, prescriptiveness, and harmonization. When two are maximized, the third will suffer. Statistics that are both prescriptive and widely suitable cannot be globally harmonized, because prescriptive measurement guidelines will be tailored to domestic, local, or regional contexts. We label the resulting condition

The statistical trilemma and its outcomes (figure created by authors).
These criteria could also be understood as analogous to more common quality criteria in social science methodology, namely, construct reliability, external validity, and validity. In spite of the analogy’s limitations, outlined below, it helps clarify the three nodes of the trilemma.
First, reliability is associated with the ‘replicability or repeatability of results or observations’.
37
A ‘research instrument’ is considered reliable ‘if the results of a study can be reproduced under a similar methodology’.
38
Reliability can be compared to
Second, external validity addresses how and whether a finding ‘might be generalized to a broader population of cases’.
39
It is often used interchangeably with ‘generalizability’. A measurement tool or research result is considered externally valid if it can be generalized, or extended, to a broader population beyond the case or sample being studied.
40
This has affinity to
Finally, construct validity (sometimes also called ‘conceptual validity’) concerns ‘the correspondence between a concept’s definition (its attributes) and the chosen indicators’.
41
It is about operationalizing a concept in a way that actually captures what it claims to, rather than only one dimension of it or something else entirely.
42
This corresponds to our definition of
Our framework is consonant with constructivist accounts of economic and social statistics or other metrics, which highlight that the imprint dominant economic ideas leave on metrics. 43 As DeRock 44 argues, for example, GDP measurement has been constrained largely by taken-for-granted ideas about the boundary between the market and non-market. ‘Acceptable’ revisions to methodologies are typically those consistent with neoclassical economics (ibid.).
Yet, we argue that such constructivist accounts have missed the outer limits within which social construction can operate. Widmaier 45 has argued that the ‘impossible trinity’ of capital mobility, a fixed exchange rate, and monetary policy autonomy is rooted in faulty neoclassical assumptions rather than material factors. The statistical trilemma, in contrast, reflects not a particular economic theory but incompatible demands. For example, there are good arguments for standards’ flexibility, and good arguments for their rigidity. But there remains an inescapable tension and trade-off between the two, which goes beyond any particular worldview. This hard-wired character distinguishes our trilemma from that for example in international finance.
Empirical case studies
Our case studies apply the statistical trilemma framework to prominent indicators in macroeconomic and development policy and analysis. For each, we show how the indicator is limited by the statistical trilemma and how standard-setters have responded to these limitations. GDP is globally harmonized and is characterized by trade-offs between suitability and prescriptiveness. While neither of these ambitions is fully sacrificed, GDP can be neither as universally suitable nor as prescriptive as its users demand. The case of unemployment statistics is one of mock comparability, where a general ILO definition covers up a lack of prescriptiveness and also of suitability. Poverty statistics are fragmented, a result of countries prioritizing suitability and prescriptiveness over harmonization. While countries share certain best practices, each country sets its own guidelines and the resulting figures lack comparability. Statistics of trade, debt, and FDI constitute additional examples of ill-fitting statistical straightjackets and mock comparability.
GDP and National Accounts
GDP is one of the world’s most widely-used economic indicators, and also the most criticized. Its success stems partly from its promise to capture the total economic output of a given country and for the resulting figures to be comparable worldwide. 46 With GDP’s simplicity and its centrality in policymaking, expectations are high for what it should deliver.
Of the three possible outcomes described by the trilemma, standard-setters are least willing to countenance statistical fragmentation. Users – especially those using GDP for analytical (rather than administrative) purposes – expect GDP to be harmonized. The United Nation Statistical Commission and its members have pursued harmonization since the 1950s. 47 Most recently, it has been coordinated through The Implementation Programme for the System of National Accounts 2008. Even when GDP shared the stage with centrally planned countries’ Net Material Product (NMP), the UN led efforts to convert this Soviet Union-developed indicator to GDP, and the World Bank and IMF nudged countries under the Soviet sphere of influence toward adoption of the SNA. 48
With fragmentation out of the question, the biggest challenges for standard-setters and the most salient objects of criticism have been shaped by tensions between suitability and prescriptiveness. Prescriptiveness is particularly urgent for users concerned about manipulation or misrepresentation of GDP figures, whether intentional or not. 49 Reflecting these worries, IOs promote compliance with the SNA and monitor data quality through programs like the IMF’s Data Quality Assessment Framework and the UN’s National Accounts Questionnaire.
Debates about GDP’s suitability are often framed in terms of ‘developed’ versus ‘developing’ countries. This is an oversimplification, to some extent. Accounting for the digital economy, for example, is not strictly a developed country issue, considering the importance of mobile banking in many Global South countries. Nonetheless, GDP’s largest suitability deficits have indeed been biased against poorer countries.
The second official publication of the SNA in 1968 forced statisticians to confront the poor fit of the standard to dozens of new UN member states following post-colonial independence. Ward summarizes two main shortcomings. 50 First, the SNA was ‘internally’ focused, whereas the main problems facing developing countries were ‘external’, such as unequal trade relations and the operations of foreign firms within their borders. 51 This problem persists. For example, as Smith argues, GDP undervalues the contributions of low-wage workers in global value chains. 52 Second, and also still relevant today, developing countries’ economies were heavily concentrated in ‘nonmarket’ activities that can only be valued indirectly through imputations. 53 Many nonmarket activities – such as unpaid care work – are considered to be outside of the ‘production boundary’. In practical terms, this simply means that the good or service in question is not counted in GDP figures.
As of the most recent publication of the SNA in 2008, many of the suitability deficits biased against developing countries have been amended. Although subsistence farming was already counted toward GDP according to the rules of the 1953 SNA, other forms of subsistence production, such as water collection, were added in 1993. 54 Also noteworthy is the adoption of the ILO definition of informal sector enterprises in the 1993 SNA. 55 Most of these changes have entailed either imputations for non-market activities or more detailed guidelines for estimating hard-to-measure activities, as with the informal sector.
For the most part, however, changes to the production boundary in the 1993 SNA and 2008 SNA have increased suitability primarily for rich, highly industrialized countries. Changes to the treatment of financial intermediation services, research and development (R&D), and weapons production have disproportionately increased the GDP of countries that have seen structural shifts toward these industries. 56 Financial intermediation services did not contribute to GDP until the 1993 SNA. Since then, their prominence has grown, however, with a 2008 SNA in which ‘even banks’ own money could now be used to create . . . “production,” without the pretext of providing an intermediation service’. 57
Military expenditures, too, have shifted further inside the SNA production boundary. The 2008 SNA redefined all government weapons spending as government investment, which is substantially higher for high- and middle-income countries compared to low-income countries. 58 R&D, too, is concentrated in developed countries. R&D began contributing to GDP only in 2008, whereas before it was considered intermediate consumption rather than a productive activity.
Such expansions of the production boundary are plausible efforts to keep GDP up to date with technological change and to increase suitability to countries that have shifted away from manufacturing. But these changes are puzzling in relation to GDP’s continued exclusion of unpaid household services. The SNA production boundary excludes own-account household services – specifically, ‘activities undertaken by households that produce services for their own use’ – with the exception of services of owner-occupied dwellings such as home repairs. 59 This exclusion does not necessarily affect developing countries more than developed ones, but it is highly gendered within countries. Worldwide, women spend an average of three times longer than men on unpaid care work, including cooking, cleaning, childcare, and caring for the sick and elderly. 60
According to the SNA, this limitation is necessary because, if a product cannot be exchanged, ‘there can be no division of labour, no specialization of production and no gains from trading’. 61 When pushed, however, statisticians concede the arbitrariness of this exclusion. 62 Services produced and consumed inside households remain outside the production boundary because it is nigh impossible to quantify their market value in a convincing way. Trying to do so would thus open the door to arbitrariness and undermine the comparability of data across countries. Rather than measuring something important imprecisely, it is not measured at all. 63
In essence, this move avoids statistical fragmentation at the expense of suitability. The 2008 SNA does give countries the choice not to quantify R&D if it is a small or nonexistent sector, or if capacity constraints make such data collection impossible. But to open up GDP to services such as unpaid care work would – at least, according to standard-setters – have threatened the comparability of GDP at its core.
Standard-setters also emphasize the ‘flexibility’ of the SNA. 64 The SNA allows countries to adapt the guidelines, to ‘give greater emphasis . . . to one part rather than another’. 65 Flexibility accommodates differences in countries’ policy applications of the data as well as statistical capacity and data availability. 66 To be sure, statisticians recognize that, given the wide variation between national economies, certain details of the SNA may have to be locally adapted or even ignored. 67 For example, some countries, such as Australia and others, measure pension contributions in ways that diverge from the international guidelines. 68
The flexibility of the SNA, however, is moderated by demands for prescriptiveness. The SNA does not allow deviation from core concepts such as the production boundary, financial assets, or capital formation – concepts that are built upon the experiences of industrialized countries. 69 Today, ‘the basic concepts and definitions of the SNA depend upon economic reasoning and principles which should be universally valid and invariant to the particular economic circumstances in which they are applied’. 70 In sum, GDP is not quite an ill-fitting straightjacket or only superficially comparable. But it is neither as locally suitable, nor as prescriptive, as many users would want (see Figure 2 below). The tension between the three poles of the statistical trilemma means that trying to mend defects in one dimension will always entail concessions in the others.
Trade-offs in the harmonization of GDP (arrows indicate unresolved tensions; figure created by authors).
Unemployment
Unemployment indicators aim to capture a crucial dimension of socio-economic life – to what degree large groups of people are structurally unable to find paid employment. While such difficulties are widespread, the specific metrics to quantify them have their roots in what are today heavily industrialized and relatively rich countries in the Global North (Salais, Baverez and Reynaud 1986; Baxandall 2004; Zimmermann 2006).
71
In Baxandall’s words, unemployment statistics had originally aimed to capture
[an] able-bodied, prime-age male industrial breadwinner with plant specific skills who [had] been laid off from full-time formal work as the result of a plant closing in a declining industry.
72
Even though it is not obvious how readily this concept travels to other parts of the world, the 1982 ILO standards build on this image when they identify unemployed people through three core criteria: they do not have paid employment, they are available for it, and they are actively looking for it. 73
These three criteria make intuitive sense. The first is self-evident. The second means that a person must be able to take up a job more or less directly to qualify as unemployed. If she had other structural obligations, for example by being enrolled in an educational program, she might still want a job (eventually), but would not count as unemployed. The third criterion acknowledges that people may be voluntarily jobless. After all, unemployment is only meant to capture a lack of jobs for those people who actually want one.
Once we try to operationalize these criteria and make unemployment measurable, things become much more difficult, however. What is the lower threshold for employment? ILO guidelines suggest that 1 hour of paid work per week is enough not to count as unemployed – a remarkably low bar. Also, ‘having a job’ is readily equated with salaried wage labor. But people can earn money with their work in ways that fall below the radar of authorities. Such informal labor for example includes unregistered self-employment or small enterprises, as well as unregistered day-laboring. 74
The second criterion is equally tough to operationalize in a comparable manner. National authorities typically build employment statistics from survey data, meaning that respondents have to report on their own availability. Some countries offer cheap and easy access to re-training or other educational programs for people without work, such that de facto unemployed people would seem to be unavailable. At the other extreme, people in poor regions in particular may be heavily tied up in subsistence agriculture or care for other family members, without potential recourse to public services. In those situations, people might experience a chronic shortage of jobs, but fail the availability criterion.
This problem ties in directly to the third requirement – the need to look for a job actively. This criterion is the most thorny of all. Operationalizing it requires specifying which activities count as active search and then measuring it. Different proxies are conceivable: actual job applications, visits to job centers, review of job adverts online or in newspapers, and so on. But such criteria are based on an image of highly formalized labor markets, potentially with public institutions in place to aid job search. Job centers or fairs of the kind that may be common in rich, industrialized countries are often absent in poor ones.
Yet structural differences between national labor markets mean that they are hard to compare using one and the same yardstick. For example, the extent of informal work varies widely around the world: recent ILO data see it ranging from more than 90% in many sub-Saharan African countries Africa to 10 in many Western European ones. 75 Roughly 60% of employment worldwide is classified as informal. Globally, the experience of people in rich countries with highly structured labor markets is the exception, not the rule.
To be sure, statistical agencies can devise ways to measure it still, for example through large-scale surveys. 76 These efforts are costly, however, and Labour Force Surveys are commonly customized on a national basis to accommodate inter-country differences. 77 They do not generate internationally comparable figures, and by that token, they are unable to mend the lack of comparability of unemployment statistics.
More importantly still, however, relatively disconnected areas may lack the infrastructure to allow people even to apply for formal employment, for example because such employment opportunities are far removed from where they live, or because a life in poverty leaves little time and resources to invest into active job search. A uniform criterion can therefore fail to do justice to the diverse conditions under which people can or cannot seek paid employment if they want it.
Consider the case of Philippine employment statistics. 78 In 2005, the Philippines adapted its labor force survey to track the three standard criteria for unemployment: having no job, being available for one, and actively seeking one. In contrast to international best practice, however, it relaxed the last criterion to increase the local suitability of the definition. Henceforth, Philippines authorities would still count someone as unemployed if they had not been actively job-hunting, provided they reported being too tired, believed no work was available, awaited results from previous applications, expected to be rehired or recalled to their former (informal) work soon, or could not search for jobs because of bad weather. On the other hand, people reporting not to be looking for work because of family duties were not counted as unemployed but simply outside the labor force. The appropriate way to define and measure employment conditions is locally specific.
Reflecting such diversity, ILO statistical standards are clearly less prescriptive than in the case of the SNA. Many countries report unemployment rates that claim to be based on the ILO

Mock comparability of the ILO definition of unemployment (figure created by authors).
Poverty statistics
We look to poverty statistics to find out whether, on the whole, livelihoods in a given country are improving or worsening. We also expect the data to tell us if one country or region has a higher rate of poverty than another, and whether the world as a whole is achieving poverty reduction. These are important but deceptively simple questions to ask. 79
Users of poverty statistics have to grapple with the co-existence of national poverty lines and the World Bank’s International Poverty Line (IPL). While the IPL has enabled cross-country comparison, it has also obscured national differences. The IPL is not an international standard. Poverty statistics are fragmented, and the IPL is a centralized attempt by the World Bank to convert incomparable statistics into comparable ones. The IPL is instructive, however, because its travails illustrate why harmonization has not been achieved in the first place.
National poverty lines are set individually by countries and are typically based on household surveys. Poverty statistics then combine those with a welfare indicator. At the household level, that is typically measured in terms of current income or consumption expenditures, with income the more common indicator for OECD countries and consumption for developing countries. 80 Once statistics on income poverty are obtained, the next step is establishing a poverty line, below which people are said to be poor (ibid.). The final step in measuring poverty is calculating the poverty rate – the number or percentage of people living in poverty based on the poverty line.
There is no fixed approach to choosing a national poverty line. Most developing countries follow a ‘cost of basic needs’ approach. 81 It starts with a food poverty line, based on the cost of a minimum caloric intake for a certain level of health, to which a non-food component is then added. Both are estimated from survey data for households clustered around the poverty line. 82
‘Basic needs’ obviously vary across countries, if only because people have been socialized into different expectations and because of the social stigma attached to be on the lower rungs of any given society. But there are also concrete differences: ‘In a poorer country, for example, participating in the job market may require only clothing and food, whereas someone in a richer society may also need access to the internet, transportation, and a cell phone’. 83
In 1990, based on the observation that the national poverty lines of several of the poorest countries clustered around US$1 per day, the World Bank adopted the so-called dollar-a-day line as the first IPL. 84 The IPL has been updated several times and was last raised in 2015 to US$1.90 per person per day at 2011 purchasing power parities. 85 The IPL is obtained by averaging the 15 lowest poverty lines out of a sample of 74 national poverty lines. 86
The World Bank now also reports on two higher poverty lines of US$3.20 and US$5.50 per day, to reflect that ‘the majority of people and most of the world’s poor now live in middle-income countries’. 87 In fact, this proliferation of international poverty lines implicitly appreciates that no single poverty line can do justice to all the divergent socio-economic circumstances. The higher ones of course give a less rosy picture compared to the level of ‘extreme poverty’ depicted by the IPL. Almost half the world’s population falls below the $5.50 line, and a quarter falls below the $3.20 line. 88 Conclusions about poverty rates are even more pessimistic if the benchmark is a ‘living wage’ rather than any of the World Bank’s poverty lines. The living wage concept, such as that formulated by the Asia Floor Wage Alliance, 89 incorporate a more holistic (and realistic) range of basic needs, including dimensions of social and physical reproduction like ability to access healthcare, safe housing, and education. IPE research on global value chains (GVCs) that apply the living wage concept instead of the World Bank’s IPL are far more doubtful about the benefits of low-wage participation in GVCs. 90
The actual situation in the case of poverty statistics is one of statistical fragmentation. Jolliffe and Beer argue that national poverty lines are fundamentally incomparable.
91
The IPL attempts to circumvent this problem by sidestepping the problem of local suitability (see Figure 4), but simply averaging out the lowest national poverty lines results in ‘a conceptually incoherent average value for the IPL’.
92
The result, consistent with the trilemma heuristic, is a severely ill-fitting global yardstick. As with the other case studies, the constraints imposed by the trilemma do not force the World Bank into making any

Trade-offs in national poverty statistics and the International Poverty Line (figure created by authors).
The ambition for comparable poverty statistics is understandable and appeals to benchmark-minded IOs, NGOs, and their member countries and donors. 93 But the IPL obscures more than it reveals, and it arguably underestimates the true extent of global poverty. At the same time, abandoning an IPL altogether would entail giving up on comparable poverty statistics, thus leaving the SDGs and other global development agendas without a fixed target. As with GDP, the simplicity of a single, comparable figure gives staying power to the IPL, even if a great deal of information is lost along the way.
Additional shadow cases
To highlight the breadth of the trilemma dynamic, this final section briefly outlines how it reverberates in three additional cases, namely the measurement of public debt, foreign direct investment, and in trade statistics.
Debt
Public debt figures are meant to reveal the fiscal burden governments have assumed. They are meaningful when they can tell us something about public authorities’ ability to carry that burden – which is why we typically express debt in relation to GDP as a measure of the ‘size’ of the economy.
While public debt as a concept sounds straightforward, it is riddled with measurement problems. 94 For our purposes, several challenges stand out: considering liabilities in isolation obscures that governments may have substantial assets that, in theory, could be sold to service debt. While less ‘hard’ than regular debt, public pension liabilities can constitute debt-like fiscal burdens. 95 Debt structures can vary significantly, for example because liabilities may come due soon or only decades from now, and they may be owned by relatively loyal domestic creditors, or by much more fickle international investors. And crucially for global comparisons, public debt varies according to the currency in which it is issued, which may or may not be the domestic one.
The most authoritative set of public debt figures is compiled in the IMF’s Government Finance Statistics (GFS) data base according to the IMF’s manual. 96 Debt figures are consequential for governments because they feed into public borrowing costs. 97 Within the range of measurement options, public authorities therefore have an incentive to choose that which portrays them in the most favorable light, rather than the one that might seem most appropriate. 98 Recognizing this, statistics manuals for debt tend to be relatively prescriptive.
Prescriptive, harmonized standards mean that local conditions remain unheeded in headline figures. The actual fiscal burden that any nominal amount of debt constitutes – the ultimate object of interest – can vary enormously depending on the specific conditions of any country. Countries in the Global South typically borrow from international investors, in foreign currency, and relatively short term. From a fiscal sustainability perspective, a debt burden of, say, 60% of GDP may be much more of a concern than the more than 200% of GDP that the Japanese government owes other domestic creditors. Standardized debt measures therefore lead us to compare apples and oranges. Without further contextual information, they create ill-fitting straightjackets – especially once we leave the OECD world and compare across the globe.
Foreign direct investment
FDI statistics exemplify how multiple options for data compilers can undermine international comparability. Again the underlying concept seems simple enough: FDI statistics should capture investments from people or companies from one country in another. The ‘direct’ element signals that FDI is unmediated; through the investment, the investor becomes actively involved in the business in question. This criterion separates FDI from portfolio investment (FPI), for example through the acquisition of a small number of shares.
In practice, FDI is tracked through financial flows. Any particular flow, however, does not advertise who the ultimate originator or target is, and whether it is meant as a passive or active investment. 99 Source and destination of a flow can be hard to track because investors may have structural incentives to deceive authorities on these counts. 100 Investments are frequently channeled through multiple countries and holding companies to arbitrage tax rules. 101 The uneven distribution of financial conduits around the world systematically distorts our image of which countries invest, and where. 102 In consequence, IMF researchers have lamented that up to 40% of globally registered FDI may in fact be phantom investments – FDI that exists on paper but in fact is something else, for example domestic investment through offshore vehicles. 103
Equally difficult to pin down is the difference between FDI and FPI. Balance of Payments Manuals (BPMs) before the 1990s had acknowledged the importance of contextual information and emphasized the importance of national discretion. 104 Later versions, in contrast, have included a highly prescriptive but equally arbitrary ‘10% rule’, according to which investments over that threshold would count as direct investment, and everything else would not.
Where new rules for measuring FDI
Because the best measurement approach depends on case-specific circumstances, the current BPM offers no less than seven BPM-compliant valuation techniques for FDI stocks. 106 Using the Danish example, Damgaard and Elkjaer show that estimates for inward FDI stock vary between 22% and 156% of Danish GDP, depending on the technique used.
FDI statistics are thus a good example of how adherence to international standards is bought at the expense of multiple measurement options that ultimately generate mock comparability. Indeed, given the commercial and political stakes attached to measuring and reporting FDI flows and stocks, we can expect data reporters to be opportunistic in the figures they produce. Data is neither really comparable internationally, nor are standards prescriptive enough for us to know at least on a country by country basis what exactly is in the figures.
Trade
Trade data, too, is compiled in line with the BPM. But in contrast to FDI, the measurement of stocks is not a central concern, and tracking flows is riddled with relatively fewer problems. The internationally harmonized classification of trade flows in the BPM is therefore relatively prescriptive.
Nevertheless, problems abound. 107 Countries measuring one and the same bilateral flow commonly arrive at very different numbers, meaning that a single set of measurement rules still leads to widely diverging figures. 108 Some of these divergences reflect genuine uncertainty and measurement errors; others, however, stem from the distortions that national idiosyncrasies introduce. Examples include that trade hub countries typically report high import and export figures even though they only function as conduits. Countries in which components are assembled into final products – say, cars or consumer electronics – look as if all the value of their exports was locally produced (‘German’ cars or ‘Chinese’ smartphones) even though they, too, partially pass on value added created elsewhere. National statistical authorities would need to make locally specific adjustments to get figures into line. Harmonized standards generate discordant numbers – making trade statistics a case of an ‘ill-fitting straightjacket’.
Things become more complicated once we move from merchandise trade to trade in services. Imagine a New York branch of a Dutch bank arranging a transaction in Japanese Yen between a Russian and an Italian party, both of whom use offshore vehicles to execute the transaction. Which country is exporting a service where, in this example? Any rule set trying to capture this transaction will be found wanting – squeezing such a deal into the conceptual corset of international trade does violence to its transnational character. In parallel to the FDI example above, whatever universal rule we establish may end up substituting technical precision for common sense. Importantly for our argument, whichever dimensions of the deal we would privilege to define the two trading countries, we would end up inflating trade figures for one kind of country at the expense of another. ‘Heavily trading countries’ might be those with the actual headquarters, or transacting branches, the currency in question, or the legal but fictitious offshore incorporation of either service provider or client. Prescriptive standards clash with the diverse trading profiles of countries around the world.
Conclusion
Statistics have become increasingly important in international economic governance in the pursuit of transparency, evidence-based policy, and a clear sense of economic developments in the global economy. At the same time, recent scholarship has highlighted the limitations and biases of these statistics. Economic statisticians are now recognized as agents in global politics rather than simply as technocratic experts. 109 The methodologies that they design – either domestically in national statistical offices, or internationally in the creation of standards – shape how we see and interpret the world.
We have argued there are inherent limits to what these statistics can achieve – what level of detail they can provide, how many stakeholder demands they can satisfy, and so on. In particular, the trilemma we have outlined entails that they cannot simultaneously be prescriptive, harmonized, and locally suitable. This argument builds upon critiques of economic statistics, such as the reductionism of poverty lines and unemployment figures or the biases and blind spots of GDP. Without question, these political features of economic measurement have real and potentially harmful impacts as they shape how policymakers see the world and act upon it. However, as the empirical examples above aim to demonstrate, underlying structural factors limit the degree to which these problems can actually be tackled. The deficiencies of international economic statistics are therefore not the result of professional incompetence or indifference, but of endemic constraints global economic quantification confronts. Our trilemma complements other arguments about the shortcomings of statistics, and the consequences thereof, by offering a structural explanation for their emergence.
Our argument also sheds light on the social construction of statistics – and its limits. As constructivists have argued, standard-setters indeed have substantial agency over economic quantification. But where a purely constructivist perspective would suggest that statistics’ shortcomings could be overcome through ideational struggles, we have argued that this agency has limits: the qualities we commonly look for in international statistical standards entail serious trade-offs, captured in the trilemma that we have outlined. That does not free statistical experts from responsibility for the distributional consequences of measurement choices, but it should temper our expectations of what, even under the best circumstances, could be achieved through global economic quantification. It also helps pinpoint which criterion is sacrificed in the inevitable trade-offs, or which one has been compromised due to them. Such an awareness, in turn, can inspire more realistic choices as statistical standards are developed further in the future.
Next to economists, scholars of global politics are central users of international statistics, both regarding the macroeconomic indicators we discussed here, and a broad range of other harmonized figures, spanning global health, environmental and educational indicators. While we are no experts regarding these other fields of statistics measurement, we feel that the argument we presented readily travels to statistics that aspire to cross-country comparability more broadly. Attentiveness to statistics’ built-in limitations can help improve the quality of quantitative and mixed methods research in a way that is not captured by traditional criteria of reliability and validity. It can also help qualitative researchers who use descriptive statistics to place them in a more accurate social context. As long as we do not lose that contextual knowledge, statistics can continue to help revealing important societal dynamics, and buttress our collective debates about how to address them.
Footnotes
Declaration of conflicting interests
The author(s) declared no potential conflicts of interest with respect to the research, authorship, and/or publication of this article.
Funding
The author(s) disclosed receipt of the following financial support for the research, authorship, and/or publication of this article: This work was supported by the European Research Council under the European Union’s Seventh Framework Programme [FP/2007-2013]/H2020 European Research Council (ERC) [Grant Agreement number 637683].
