
Abstract
The Importance of Risk Assessment and Risk Communication
Risk assessment is a central component of the risk-need-responsivity (RNR) framework, an evidence-based theoretical model developed to understand, predict, and address individual variation in criminal behavior (Bonta & Andrews, 2024). The model is widely used in criminal justice systems, including in the development of structured tools to assess recidivism risk and inform intervention for justice system-involved individuals. Meta-analyses and systematic reviews have demonstrated the accuracy of risk assessment tools in predicting general, sexual, and violent recidivism in adults and youth (e.g., Koh et al., 2020; Olver et al., 2009, 2014).
Despite the documented usefulness of risk assessments, the tools are more limited in the context of risk communication. It can be difficult to compare scores on assessment tools because each tool is unique in that it considers and weighs risk factors differently and there is no set specification about the terminology used to describe risk categories across tools; thus, definitions of each category vary (Coulter et al., 2022; Olver et al., 2022). For example, Barbaree et al. (2006) compared risk levels among five instruments used with adults with sexual offenses and found that only 3% of adults assessed were identified as high risk and 4% were identified as low risk across all five instruments. Beyond the absence of standardized category definitions, there is lack of consensus about the meaning of different labels in terms of reoffending probability and the specific needs profile at each risk level (Hanson et al., 2017).
When risk levels across tools are clearly defined, results can be more effectively used to support programming, supervision, and case planning (Coulter et al., 2022; Olver et al., 2022). Using standard risk terminology enables more precise communication between service providers and correctional personnel, and professionals across jurisdictions and justice settings can better interpret risk labels regardless of the instrument. Well-defined and evidence-informed risk levels can also ensure that assessment results are used to match individuals with the most suitable types and levels of program and supervision resources. A standardized language of risk also facilitates the aggregation of research across studies, supporting evidence-based policy and practice.
Hanson et al. (2017) contend that risk levels should be accompanied by individual-level information, including percentile ranks, risk ratios, and recidivism rates. Percentile ranks, which indicate a score’s position relative to others in a distribution, are sample-dependent and do not convey an individual’s reoffending probability (Hanson et al., 2016). Risk ratios provide a stable measure comparing an individual’s risk with the average score on the risk tool, allowing for comparisons across samples (Hanson et al., 2017; Lehmann et al., 2016). However, the risk ratio is also a relative measure that does not provide information about the absolute likelihood of reoffending. Recidivism rates express the likelihood of reoffending for individuals with the same risk score (Olver et al., 2022). To provide more useful information about risk for recidivism, researchers have computed all these metrics for adult risk measures, with studies revealing differences in applicability and stability across samples (Hanson et al., 2016; Lehmann et al., 2016; Olver et al., 2018, 2022).
A Five-Level Risk and Needs System
In addition to emphasizing the importance of multiple metrics, Hanson et al. (2017) proposed a common language for risk communication and, within a Five-Level system, created guidelines to classify and communicate risk to inform intervention and risk management. Researchers, program administrators, analysts, and clinicians came together (Council of State Governments [CSG] Justice Center, 2014; Hanson et al., 2017) and, after field testing, concluded that the five levels are highly recognizable in corrections and align with current practices. Level I represents the group with the lowest, and Level V the highest, risk of reoffending. The Method section has additional detail on the levels, which are developed in three steps (e.g., Kroner & Derrick, 2022; Kroner & Hanson, 2023; Kroner et al., 2020): (1) calculating the tool’s median score (middle level, Level III), (2) determining boundary scores for Levels II and IV (distance from Level III) using odds ratios for reoffense corresponding to the reduction in recidivism that typically results from published interventions, and (3) calculating the boundary scores between Levels I and II and IV and V, which typically uses predicted probabilities of reoffending from logistic regression modeling. Studies by Hanson et al. (2016) and others support the effectiveness of the Five-Level system in accurately classifying risk levels with adult risk assessment tools. For example, Olver et al. (2022) noted the system’s utility in assessing violence risk via the Violence Risk Scale, demonstrating its correlation with psychopathic traits and lower protective scores. Kroner et al. (2020) found that scores produced using the Five-Level system better aligned with observed recidivism rates than the original Level of Service Inventory-Revised categories.
To date, no published studies have presented multiple quantitative risk metrics and the Five-Level system for youth risk assessment measures. Given the developmental context of offending and differences in the youth and adult justice systems, it is unknown whether the five levels operate in the same way as they do for adults. In the present study, we aimed to generate multiple risk metrics and apply the Five-Level system to a youth risk assessment tool: the Youth Level of Service/Case Management Inventory YLS/CMI 2.0 (Hoge & Andrews, 2011).
Risk Assessment and Communication With the YLS/CMI
Developed based on the RNR framework, the YLS/CMI 2.0 is a 42-item risk assessment tool for youth aged 12 to 18 years that produces numerical (eight domain scores and a total score) and categorical (Low, Moderate, High, Very High risk) risk information (Hoge & Andrews, 2011). Moderate to strong area under the curve (AUC) coefficients for the YLS/CMI 2.0 indicate that the total score predicts general recidivism well (e.g., Peterson-Badali et al., 2015; Schmidt et al., 2011), including when completed by youth probation officers (Perrault et al., 2017). Youth who score high on the YLS/CMI 2.0 are likely to reoffend sooner and at a higher rate than youth with lower scores (e.g., Onifade et al., 2008; Schmidt et al., 2011).
Based on a normative sample of over 12,000 justice system-involved youth from Canada and the United States, percentile ranks, developed separately for four groups (males and females in community and custodial settings), informed the boundaries of the risk categories. Because YLS/CMI risk categories are tied to percentile ranks and not recidivism rates, they are sample dependent. For example, the Low risk category comprises scores from 0 to 19 in custodial males and 0 to 9 in community males. Furthermore, studies reveal varying recidivism rates within risk categories. For example, in two studies of youth on probation, the reoffense rates were 11% and 29% for Low risk youth, and 39% and 60% for High risk youth, respectively (Onifade et al., 2008, 2009). In other studies, reoffense rates ranged from 15% to 28% for Low risk youth and from 52% to 55% for High risk youth (Bechtel et al., 2007; Schlossman & Anderson, 2021).
The fact that the YLS/CMI’s exclusive use of percentiles leaves risk categories untethered to actual rates of reoffending means that a youth whose risk score falls into the Low risk category has a risk score lower than others in their particular normative sample, but this does not necessarily indicate that the youth is at low risk of reoffending. This issue represents a substantial information gap–and one that may not be understood by practitioners who use risk assessment information to make decisions about sentencing and case management. When risk categories are tied to reoffense rates, results can be more effectively used to inform sentencing and support planning, programming, and supervision (Coulter et al., 2022; Olver et al., 2022). Incomplete or unclear communication of risk information may lead to misinterpretations, potentially resulting in ineffective or inappropriate interventions. Thus, providing transparent and comprehensive risk information is essential to fully leverage the utility of youth assessments.
The Present Study
To begin to address this information gap, the first goal of the present study was to provide more comprehensive risk metrics for the YLS/CMI, including absolute and relative risk metrics (Hanson et al., 2017), using field-generated data from justice system-involved youth in Ontario, Canada. To do so, we calculated percentile ranks, risk ratios and recidivism rates separately by gender for the YLS/CMI risk categories on two groups of youth: a general sample of youth on probation and a sample of youth who received a forensic assessment at a mental health facility prior to sentencing. Second, while multiple risk metrics and the Five-Level system have been developed for several assessment tools in the adult justice system, the system has yet to be applied to the field of youth risk assessment. We explored the application of a Five-Level system with the YLS/CMI by developing it separately within each sample and conducting a preliminary examination of the convergent validity of the five YLS/CMI levels with three risk-relevant constructs: psychopathy, aggression, and pride in delinquency, an approach consistent with previous studies in the adult literature (e.g., Olver et al., 2022).
Method
Participants
Data were obtained from two samples of justice-involved youths from Ontario, Canada, who underwent risk assessments between 2001 and 2014 (with over 80% of assessments occurring after 2005). The first (clinical-forensic) sample comprised 540 youths (474 young men and 66 young women) drawn from a database of youth who completed court-ordered risk assessments to assist in judicial decision-making at an outpatient mental health center in Toronto, Canada. Youth were assessed by psychologists and psychiatrists specializing in adolescent forensic mental health and trained in the use of the YLS/CMI. While a small number of youths were in custody awaiting disposition of their charges, most resided in the community at the time of the assessments, which were completed prior to sentencing. All youths who provided research consent for use of their clinical information, and who had data on the variables used in the study, were included. There were no differences between youths who consented to use of clinical data for research compared with those who did not on key variables, including age, gender ratio of young men to young women, severity of index of offense, and average YLS/CMI score, suggesting the study sample is representative of the population of youth assessed in the clinic.
The second (community probation) sample comprised data on 880 youths (772 young men and 108 young women) provided by the government ministry responsible for youth on probation, matched to the clinical forensic sample on year of assessment, age at assessment, and gender (but not YLS/CMI scores), with individual cases randomly drawn within those matching parameters. Per ministry policy, probation officers, formally trained in using the YLS/CMI, assessed youth at the outset of probation and at least annually thereafter; 63.3% (
As Table 1 shows, the samples did not differ in age or proportion of young men and young women. Race/ethnicity data were missing in nearly half of the community sample because the youth justice ministry did not consistently collect this information. The largest groups in both samples were Black youth and White youth, with a larger proportion of Black, South Asian, and West Asian youth in the forensic sample than the community sample.
Demographic and Criminal Justice Variables for Forensic, Community and Total Samples

Measures
Youth Level of Service/Case Management Inventory (YLS/CMI 2.0; Hoge & Andrews, 2011)
Details for this measure are included in the Introduction. As noted, the YLS/CMI has strong internal consistency and concurrent and predictive validity.
Hare Psychopathy Checklist: Youth Version (PCL: YV; Forth et al., 2003)
The PCL: YV evaluates psychopathic traits in 12 to 18 year olds in four domains: Interpersonal, Affective, Lifestyle, and Antisocial. It comprises 20 items, each scored on a 3-point scale of trait presence/severity. The PCL: YV has strong psychometric properties including predictive validity with respect to reoffense (e.g., Edens et al., 2007).
The Aggression Questionnaire (AQ)
The Aggression Questionnaire (AQ; Buss & Warren, 2000) is a 34-item self-report instrument that evaluates physical, verbal, and indirect aggression, anger, and hostility, producing scale and total scores. Each item is scored on a 5-point scale, with higher scores representing higher levels of aggression. The five scales are internally consistent, and scores positively correlate with other measures of anger and aggression (e.g., Novaco, 1994). Researchers have found a significant association between dimensions of aggression, such as anger, and recidivism among adolescents (e.g., Kelly et al., 2019).
Pride in Delinquency Scale (PIDS)
The Pride in Delinquency Scale (PIDS; Shields & Whitehall, 1991) is a 10-item self-report questionnaire measuring the degree to which youth feel pride or shame when involved in criminal behaviors. Responses range from −10 (
Recidivism
Recidivism was defined as a conviction for one or more new youth or adult offenses within a 2-year follow-up period from the assessment date. Information was obtained from a national police criminal record database. Reconvictions were coded as violent but nonsexual (e.g., robbery, assault), nonviolent (e.g., theft, drug-related), sexual (e.g., sexual assault), and administration of justice (e.g., failure to comply with a probation condition). The number of days between the risk assessment date and the date of conviction for the reoffense, minus any days spent in secure custody in this period, constituted a “days to reoffense” variable.
Analysis
Group differences (gender and sample type) in YLS/CMI scores were examined via two-way analysis of variance (ANOVA) (total score) and chi-square analyses (risk categories). To explore the overall predictive power of the YLS/CMI in relation to recidivism, we conducted receiver operating characteristic (ROC)/area under the curve (AUC) analyses. Percentile ranks for each risk category were defined as the average percentile rank for cases in a particular risk category. Risk ratios were calculated using hazard ratios via Cox regression. Consistent with Lehmann et al. (2016), we computed hazard ratios for YLS/CMI scores as =
The Five-Level YLS/CMI risk levels were generated using the recommendations of the CSG Justice Center (Hanson et al., 2017). We followed the three-step approach used in the adult justice field (e.g., Kroner & Derrick, 2022; Kroner & Hanson, 2023; Kroner et al., 2020). Median YLS/CMI scores were calculated, and the boundary scores for the levels were determined using odds ratios. The odds ratio of .70/1.43 from the median value determined the boundary scores between Level II and III and between Level III and IV (Kroner & Derrick, 2022; Kroner & Hanson, 2023; Kroner et al., 2020). This magnitude was chosen to correspond to the reduction in recidivism that typically results from the published interventions (i.e.,
The third step was calculating the boundary scores between Levels I and II and IV and V. As noted, the predicted probabilities of reoffending from logistic regression modeling are usually used for this step (Helmus et al., 2012; Kroner & Derrick, 2022; Kroner et al., 2020). In the current study, no YLS/CMI scores corresponded to a reoffending probability of 5% or below, so there were no cases in Level I. The lowest YLS/CMI score (raw score of 0) provided the lower boundary for Level II. In the community sample, the statistical probability of a reoffending rate of ≥85% (raw score of 39) provided the Level IV/V boundary (Hanson et al., 2017). The forensic sample had no cases in Level V (the statistical reoffending probability was < 85%). To create further distinction in the lower and upper levels of risk, Levels II (in both samples) and IV (in the forensic sample) were split into IIa and IIb and IVa and IVb levels. These levels were determined by an odds ratio of 3.0. Previous studies (e.g., Hanson et al., 2017; Kroner et al., 2020) have used a 1.5 odds ratio to split the levels, but in the current study, a standardized doubling of the 1.5 odds ratio better fit the data. Using an odds ratio for the Level IIa and IIb and IVa and IVb distinction is in keeping with a systematic approach to developing risk levels and allows for consistency among risk assessments (Kroner et al., 2020).
To explore the convergent validity of the Five-Level system, we used one-way ANOVAs with Tukey beta post hoc multiple comparisons to examine scores on the PCL: YV, AQ, and PIDS across the five risk levels. These measures were only available for the forensic sample.
Results
Preliminary Analyses
Approximately half of youths reoffended, with no sample difference (Table 1). Youths who reoffended in the community sample had a shorter time to reconviction than those in the forensic sample. The forensic sample had a higher YLS/CMI score than the community sample, but there was no significant main effect of gender,
Percentiles
For each YLS/CMI risk category, Table 2 provides the percentage of participants (broken down by gender and sample type) with a score in a lower category, a score in the same category, and a score in a higher category, with percentages adding to 100. To illustrate the context-dependence of percentile ranks, perusal of Table 2 shows a score of 21 in young women or young men in the forensic sample corresponded to percentile ranks of 45 to 53. The same score corresponded to the 90th to 92nd percentile in the community sample.
Percentages of Forensic and Community Youth Across YLS/CMI Risk Categories

Risk Ratios
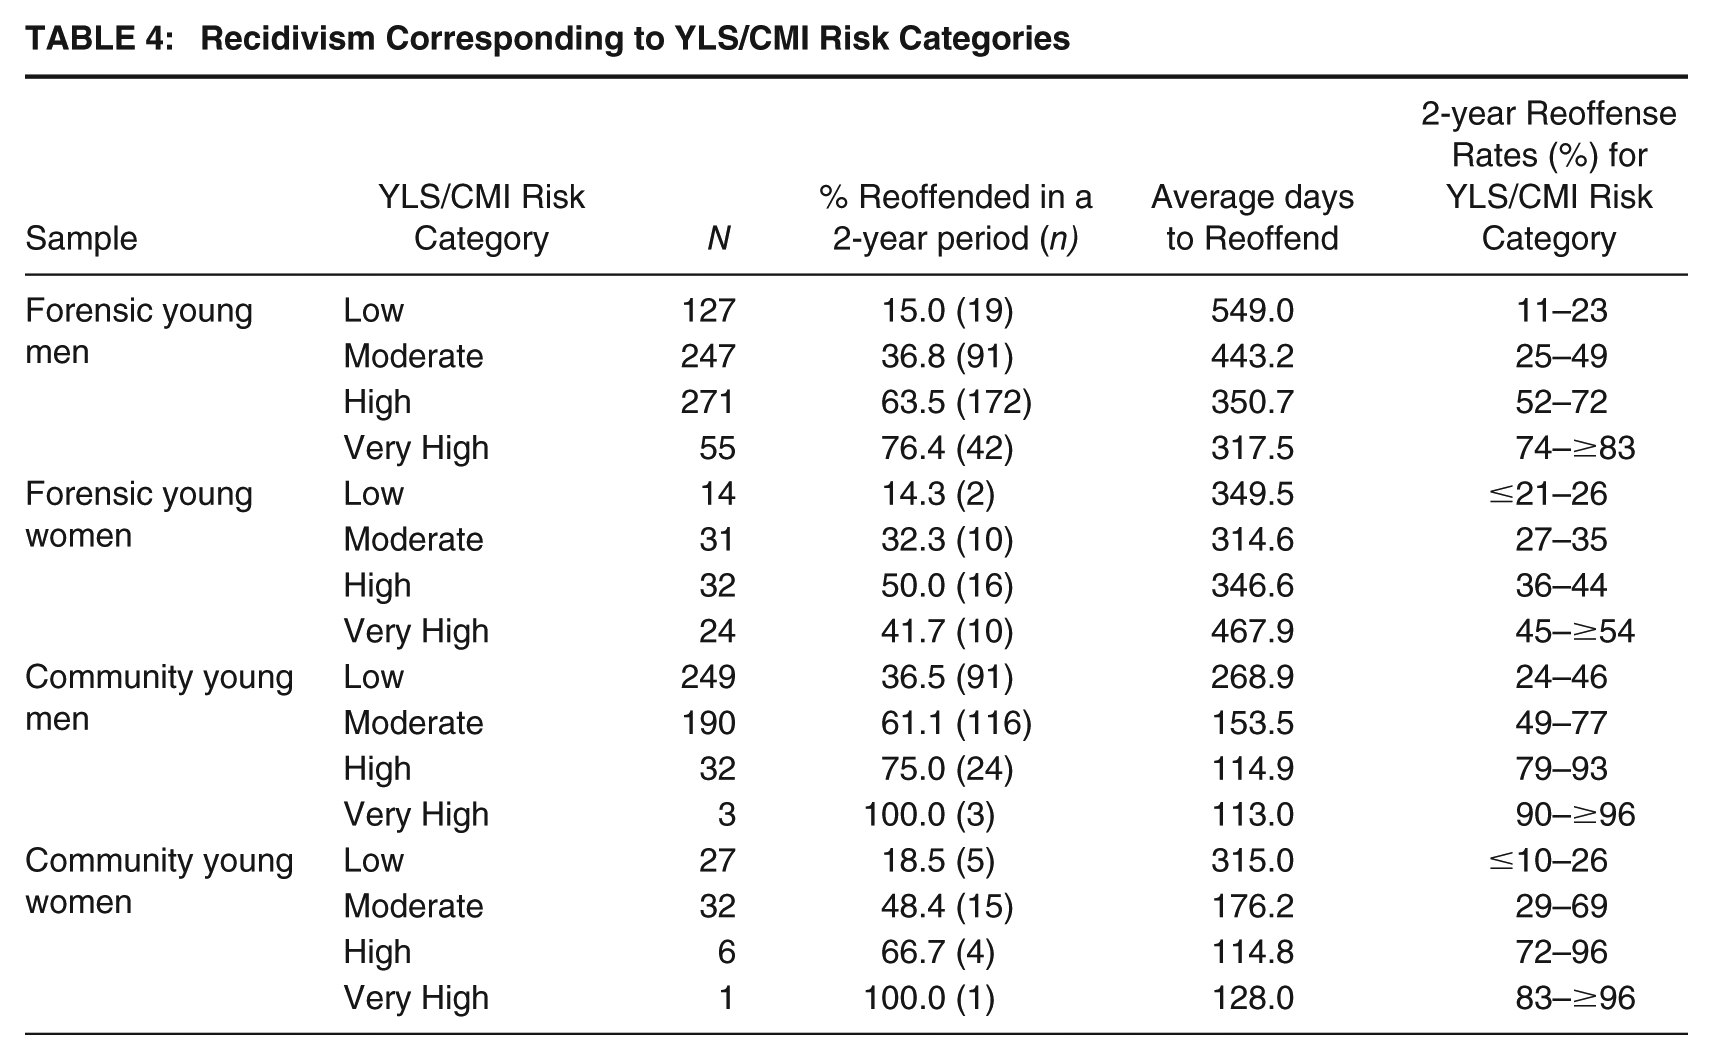
Risk ratios were computed as hazard ratios for each YLS/CMI risk category for forensic and community young men. It was not possible to calculate the risk ratios for young women due to the small sample size (e.g., Ogundimu et al., 2016). The High risk and Very High risk categories were combined due to the small number of cases in the Very High risk category in the community sample (Table 4). Cox regression analyses indicated that the risk ratios were only significant for young men in the Low risk category in the community sample, who were 68% less likely to reoffend than young men in the Moderate risk category in the community sample. Hazards ratios for all other risk categories and the forensic sample were nonsignificant (see Table 2).
Recidivism Rates
Table 3 displays the logistic regression values, presented as odds ratios, used to calculate 2-year recidivism rates. The logistic regression models were significant for both samples, correctly classifying 66.4% of cases in the forensic sample and 64.2% in the community sample. For both samples, risk scores were significantly and positively associated with the likelihood of recidivism. For each point increase in the YLS/CMI total score, the odds of recidivism increased by 12% in the community sample and 9% in the forensic sample.
Recidivism Odds Ratios for the Forensic, Community and Total Samples

The predicted probabilities from the logistic regression model were used to estimate recidivism rates. The recidivism rates for each YLS/CMI risk category varied by sample. In the forensic sample, the recidivism rates for Low risk young men (i.e., total YLS/CMI score ranging from 0 to 9) ranged from 11% to 23%, while the rates for Low risk young men in the community sample ranged between 24% and 46% (Table 4). Table 4 also shows days to reoffense in each risk category for both samples. Each increase in YLS/CMI risk category corresponded to a decrease in days to recidivism, except for the forensic female sample.
Recidivism Corresponding to YLS/CMI Risk Categories
CSG Justice Center Five-Levels
We used recidivism rates derived through logistic regression to apply the Five-Level system to the YLS/CMI (see Table 5). YLS/CMI scores within the five levels varied by sample. For instance, in the forensic sample, Level IIa encompassed YLS/CMI scores ranging from 0 to 10. However, in the community sample, the scores ranged from 0 to 3 for the same level. Across samples, most youths fell into Level IV (33% of the forensic sample and 40.6% of the community sample). This differs from the distribution in our original YLS/CMI risk categories where, despite similar reoffense rates, most of the community sample was classified Low risk (e.g., 52.5% of young men) and most youths in the forensic sample were classified High risk (e.g., 38.7% of young men). One-way ANOVAs indicated that YLS/CMI scores differed significantly across the five levels in both the forensic and community samples; all pairwise differences were significant.
Five-Level Risk and Needs Categories for the YLS CMI Scores

Construct Validity of the Five Levels
One-way ANOVAs indicated significant differences across the five levels on the PCL: YV, AQ and PIDS (see Table 6). Significant pairwise differences were most consistently found on the PCL: YV, where Lifestyle, Antisocial, and Total PCL: YV scores consistently increased across all five risk levels, with large effect sizes. With respect to aggression, youths in Levels IIa and IIb had significantly lower total AQ scores than the other risk levels. Youths in Levels IIa and IIb also had significantly lower Verbal, Anger, and Indirect aggression scores than youth in Levels IVa and IVb. Youth in Levels IIa and IIb had significantly lower PIDS scores than those in Levels III, IVa, and IVb; no other pairwise differences were significant.
Mean PCL-R: YV, AQ, and PIDS Scores for Each of the YLS CMI Five-Levels

Discussion
Given the importance of accurate and clear assessment and communication of risk information for the effective administration of youth justice, we aimed to explore the development of multiple risk metrics and a Five-Level system for the YLS/CMI, a widely-used youth risk assessment tool. Drawing from Hanson et al.’s (2017) recommendations on risk communication, we first established percentile ranks, risk ratios, and recidivism rates for the YLS/CMI risk categories in two samples of justice system-involved youth. We next used the Five-Level system to create risk levels using normative and criterion-referenced psychometric principles (Kroner et al., 2020), including using a sample median, odds ratios, and recidivism rates. We examined YLS/CMI scores and explored the system’s convergent validity by examining psychopathy, aggression, and pride in delinquency scores across the five levels.
Risk Profiles by Sample Type
The forensic sample had significantly higher YLS/CMI scores than the community sample, which is expected as youth referred for forensic assessments typically have more complex risk/need profiles (Schmidt et al., 2011). Despite this difference, the samples did not differ in reoffense rate. While the YLS/CMI significantly predicted reoffending in the community sample (as in the forensic sample), the reoffense rates were surprisingly high considering the low YLS/CMI scores, and the community sample reoffended earlier than the forensic sample. These findings have implications for the current YLS/CMI risk category definitions, which are discussed in more detail below. That said, the percentile ranks in the community sample mirrored those of the community normative sample and the forensic sample’s percentile ranks align with the custodial normative sample of the YLS/CMI 2.0 (Hoge & Andrews, 2011), highlighting the relevance of these original norms to the current samples. As the YLS/CMI 2.0 manual does not report risk ratios and reoffense rates, it is unclear how the current samples compare to the normative sample with respect to these metrics.
Risk Metrics for the YLS/CMI
The YLS/CMI 2.0 manual offers percentiles derived from extensive normative community and custodial data. As a risk metric, percentile ranks are easy to understand and provide a stable reference point for nominal risk categories. In addition, when allocating resources, using locally developed percentiles to communicate relative risk, as emphasized by Lehmann et al. (2016), is useful. To illustrate, consider a justice-involved youth with a YLS/CMI score of 19, whose level of follow-up and surveillance would depend on the assessment setting. In a forensic or custodial environment, where risk scores are generally higher, a score of 19 would fall in the low range, suggesting less follow-up or surveillance compared with youth in a community setting with the same score, who would fall in the moderate range.
Whereas percentile ranks indicate the relative placement of a given risk score in a group, risk ratios provide insight into how much riskier a youth is compared with a designated reference category. Per established practices (e.g., Hanson et al., 2013; Lehmann et al., 2016), we used hazard ratios as the chosen form of risk ratio. Significant risk ratios were observed only among Low risk community young men, who were 68% less likely to reoffend over two years than Moderate risk community young men. This finding suggests that the YLS/CMI 2.0 risk categories for community youth were largely undifferentiated in terms of the likelihood of reoffense, which speaks to the need for criterion-based risk categories. Our findings diverge from Onifade et al.’s (2008) study of 328 probationary youth in the Midwestern United States, which identified a significant difference in the time to reoffend across Low, Moderate, and High risk youth, with High risk youth being 60% more likely to reoffend over time than Low risk youth. These differences support the notion that risk categories generated by relative risk metrics are population-specific and may apply differently across settings. In an applied setting, Hanson et al. (2013) emphasize the utility of risk ratios in matching interventions to varying degrees of risk. When a risk category has a higher risk ratio, it implies a need for more interventions addressing the factors contributing to the increased risk. In the present study, this principle can be applied to Low risk community young men who, given their lower risk ratio, should receive relatively less monitoring/intervention. Of note, though, the recidivism rate for this “Low” risk group (36.5%) highlights that low risk does not necessarily equate to no needs and/or a low rate of reoffending.
A key point, and impetus for this study, is that neither risk ratios nor percentile ranks indicate a youth’s absolute probability of reoffending. To assess the likelihood of reoffending for youth with a given risk category score, we calculated 2-year recidivism rates for each YLS/CMI score. Logistic regression analyses revealed that YLS/CMI scores corresponded to a wide range of reoffense rates. For instance, among community young men in the Low risk category, recidivism rates varied from 24% to 46%—higher than expected given their Low category status. It is possible that some youth in the community sample had needs that were missed at time of assessment. Hoge and Andrews (2011) emphasize that the YLS/CMI is a dynamic risk assessment tool designed to capture developmental and life changes, allowing reassessments every 6 to 12 months. The range in recidivism rates among Low risk community young men may reflect the diverse developmental trajectories and individual circumstances of these youth over time.
The same YLS/CMI risk category also corresponded to different recidivism rates across samples. For example, 15% of young men in the Low category in the forensic sample and 36.5% of Low category young men in the community sample reoffended. Recidivism rates of low risk youth in previous studies of US youth are consistent with the forensic sample rate: 11% (Onifade et al., 2008) and 17% (Schlossman & Anderson, 2021). Variations in reoffense rates across settings may partly be explained by factors such as effective risk management processes (Lehmann et al., 2016). Settings with well-developed risk management strategies, including supervision, monitoring, and intervention programs, may be more likely to address the specific needs of individuals, reducing the likelihood of recidivism (e.g., Hanson et al., 2017).
The precise reasons for the higher reoffense rates in the current community sample compared with other community settings remain unclear. We did not have access to additional information for this community probation sample and therefore could not explore this issue further; a study limitation that needs to be addressed in future research. Nonetheless, these findings emphasize the gap between risk classification based on YLS/CMI norms and recidivism rates, as well as the notable variation between samples. In addition, the recidivism rates per risk category, particularly in the community sample, leads to some concern about whether the Five-Level system adequately accounts for factors influencing recidivism in youth. These results continue to emphasize the importance of local validation of the YLS/CMI to ensure the tool accurately reflects the characteristics and needs of the specific population within a given community. Different regions and jurisdictions may have unique demographic, cultural, and socioeconomic factors influencing youth’s risk and need profiles. Through local validation studies, practitioners can fine-tune their risk assessments to enhance their relevance and reliability in predicting recidivism and guiding effective interventions for the local context.
Applying the CSG Justice Center Five-Levels to the YLS/CMI
The YLS/CMI scores increased across each successive risk level, and the percentiles and recidivism rates associated with all five levels were comparable across the two samples. For instance, in the forensic sample, Level III was linked to reoffense rates ranging from 45% to 49% (percentiles: 47–56), and in the community sample, rates ranged from 42% to 47% (percentiles: 41–57). These rates also align reasonably well with the Level III reoffense rates (30%–49%) that Hanson et al. (2017) outlined in their white paper. In contrast to the current YLS/CMI categories, which are based on percentiles within large normative samples, the five levels were generated using both normative (median score) and criterion-referenced information (odds ratios and recidivism rates). The resulting system produced greater consistency in risk communication across samples and with recidivism outcomes. For example, consider a justice-involved community based young man with a YLS/CMI score of 8. According to the YLS/CMI, he would be classified as Low risk, but his percentile rank would fall between the 41st and 47th percentile in a community setting and the 14th and 15th in a forensic setting. Associated reoffense rates would also differ based on setting. Under the Five-Level system, the youth would be categorized as Level III in a community setting and Level IIa in a forensic setting, with corresponding percentiles and reoffense rates aligned with that risk level. The primary distinction between the original YLS/CMI classification system and the Five-Level system is that while the numerical risk metrics (e.g., percentiles and recidivism rates) would be consistent within the assessment context (e.g., community vs. forensic), the nominal label would change. Thus, the Five-Level system may offer a more consistent qualitative understanding of risk.
Overall, the five levels were also associated with differences in scores for psychopathy, aggression, and pride in delinquency, constructs that contribute to recidivism risk. The PCL: YV scores for antisocial, lifestyle and total psychopathy increased across each of the five levels, with large effects. Previous studies have consistently linked lifestyle and antisocial behavior features to recidivism, with meta-analyses supporting their significant association with both violent and general recidivism (Braga et al., 2023). Youth scoring higher on psychopathic traits are also more likely to have higher levels of aggression and greater recidivism risk (e.g., Andershed et al., 2018). Youth in the first and second risk levels also had lower aggression and pride in delinquency scores compared with those in higher risk levels, though there was no difference between the first two risk levels. Regarding the higher risk levels, although YLS/CMI scores and recidivism rates differed significantly, the AQ and PIDS scores did not, raising questions about the utility of distinguishing Level IVa from Level IVb. It is plausible that within the forensic sample, there are few significant differences in measures of aggression and procriminal thinking among youth in these higher risk levels. Given that the forensic sample had no youth with scores associated with the highest reoffense rates (the ≥85% criterion for Level V), it will be important to examine the construct validity of higher risk levels in the youth context, as the present finding raises some questions about the utility of the system for youth.
Interpretation of the highest risk level, including the validity findings discussed above, is constrained by the small
Youth Justice and the Five-Levels
We drew upon guidance from the CSG Justice Center and previous researchers (e.g., Kroner et al., 2020) in developing the statistical methods employed to create the five risk levels for youth. However, a set of youth recidivism rates linked to the five risk levels has not yet been established. A challenge inherent in applying a standardized, adult framework of recidivism to youth recidivism is the considerably higher base rates of general youth recidivism, particularly within shorter time frames (e.g., Clarke et al., 2019). Consequently, in both study samples, no youth had scores associated with Level I (i.e., reoffense rates ≤ 5%). Hence, an important avenue for future research is to determine the base reoffense rates that define the lowest risk levels within the population of justice-involved youth and investigate potential differences in these rates across different jurisdictions and settings. The youth in the two samples studied were all adjudicated, indicating some significant involvement in the justice system. For example, the community sample of youth were all serving probation sentences and while they were similar to the YLS/CMI 2.0 normative sample with respect to percentile ranks, these youth may not represent the least risky youth involved in the youth justice system, who are potentially receiving diversion or other types of sanctions that do not bring them in contact with probation services.
When assessing the applicability of the five risk levels, it is also necessary to consider the developmental context of youth crime. The classic age-crime curve describes the phenomenon that crime increases from early- to mid-adolescence and peaks between the ages of 15 and 19 before significantly declining and leveling off in young adulthood (Farrington, 2003). Thus, youth may offend at peak rates during certain ages without becoming persistent offenders in adulthood. One way of incorporating the age-crime curve in the five risk levels is by generating the risk levels separately by age group (e.g., early, mid, and late adolescence). It may also be the case that older adolescents (i.e., 18 and 19 year olds) whose reoffense rates do not decrease after this peak are represented in the highest risk category, Level V/IVb.
Although it was not a primary focus of the current study, the Five-Level System aims to present risk and needs alongside treatment recommendations (intensity and duration) for each risk level. Adolescents may require more intense treatment services as certain dynamic risk factors have been shown to increase during adolescence (Clarke et al., 2017). For example, substance use has been identified as a dynamic risk factor that increases as youth age. In contrast, education and employment needs may remain stable over time (Haqanee et al., 2015). Thus, when considering the application of the five levels, substance use may be considered a dynamic risk factor that would increase across risk level, whereas education and employment needs may not. In contrast to the adult justice system, where the level of supervision increases as risk levels increase, it may be important to regularly monitor certain dynamic risk factors during supervision even for youth in lower risk levels such as Levels I and II, to ensure that these types of needs are identified and addressed appropriately (e.g., Clarke et al., 2017).
Overall, based on the current findings and the developmental issues outlined, the Five-Level system appears promising but needs further examination of its potential utility for youth populations. This may include developing and testing adaptations of the system that align with developmental considerations and justice system responses/structures that distinguish youth from adults. However, it is imperative that the pursuit of a reliable and valid risk communication continue given the importance of this issue for the field.
Study Limitations and Future Directions
Our application of the Five-Level system to the YLS/CMI was supported by sample of real-world, field-generated data representative of both forensic and community settings, comprehensive 2-year follow-up data, a substantial proportion of youth who reoffended, and a wide range of YLS/CMI scores. To have a sufficiently large sample with recidivism records, data span 13 years beginning in 2001, which could raise concerns about the relevance of findings to current practices. As noted, 80% or more of cases were assessed after 2005. In addition, it is clear that the percentile ranks for the forensic sample are very similar to the normative sample, the rates of reoffense increase as expected with risk category, and YLS/CMI scores significantly predict reoffending with strong AUC’s, all of which speak to the continued relevance of the data.
In addition, although we conducted a convergent validity analysis with the forensic sample, these data were unavailable for the community sample. While the overall reoffense rate for both samples was similar, as was the range of rates for most of the risk categories, it will be important to examine scores on measures of psychopathy, aggression, and pride in delinquency (among others) across risk levels and in different samples of youth. Further, while scores across these measures did increase with risk category as expected for some measures, it was not true for all measures. Further examination of the construct validity of the five levels is warranted using a wider variety of relevant measures and on different youth samples.
Aggregating YLS/CMI scores and corresponding reoffense rates from different demographic groups and assessment settings would also allow for a more thorough application and examination of the Five-Level system for youth. Exploring the score ranges that fit across the various risk levels and further clarifying each level’s boundaries as they pertain to reoffense rates is possible with additional data. Further, given the differences between the patterns of youth and adult reoffending, it would also be important for future research to explore and differentiate the various youth profiles of need (both dynamic and static) that emerge in each level of risk. In the current study, we did not examine changes in YLS/CMI scores. Thus, the YLS/CMI scores that comprised the current study’s risk levels essentially represent a “pre-treatment” score. Capturing change in YLS/CMI scores across time within each risk level is an important target for future research given that the YLS/CMI is a dynamic risk tool, the Five-Level system is intended to consider treatment change, and that developmental changes are expected over time.
Finally, it is critically important to understand better how youth risk information is conveyed and how users are supported to understand what is presented. Ensuring stakeholders (e.g., clinicians, judges, probation officers) have a clear and shared understanding of youth risk classifications is an important area of future study. Interventions in which risk information is presented differently (e.g., by risk category, reoffense rates, hazard ratios, and need profiles) will allow for examination of what best supports accurate understanding. It will also be important to examine the relationships between providing risk information, understanding that information, and decision-making by stakeholders in the youth justice system.
