
Abstract
Introduction
Climate change is driving frequent occurrences of extreme weather events, such as flooding, heatwaves, and draughts, which cause both direct damages on physical and human capitals and indirect impacts to the wider economy on a global scale. According to a recent study, a total of $2 trillion economic losses was estimated as a result of nearly 4000 extreme weather events across six continents from 2014 to 2023.
1
Climate resilience has become one of the top priorities of the UK government as required by the Climate Change Act 2008. The Act stipulates that the UK government must assess the risks for the UK from the current and the predicted impacts of climate change and publish a UK-wide Climate Change Risk Assessment (CCRA) every 5 years.
2
The standard risk assessment framework developed by Intergovernmental Panel on Climate Change (IPCC) involves three key pillars, namely
In the UK, achieving climate resilience for the building stock has always been a grand challenge, especially for the housing stock. Specifically, many dwellings in the UK suffer from overheating problems during summer owing to factors such as large glazing areas, lack of shading, as well as inadequate or inappropriate use of natural ventilation. The outlook is dire as extreme heat events are getting more frequent and severe due to climate change.4,5 As the leading authority on building service engineering in the UK, Chartered Institution of Building Services Engineers (CIBSE) has been dedicated to addressing the overheating problem in buildings and advocating for climate-resilient design. TM52, TM59, and the weather files from 16 locations commissioned by CIBSE are the industry standard methodology and data for overheating risk assessment in the built environment sector.6–8
The CIBSE weather datasets, including Design Summer Years (DSYs) and Test Reference Years (TRYs),
6
are used in the design of most building projects in the UK to assess energy demand and overheating risk, and to meet national and local standards for energy efficiency and occupant health and wellbeing. TRYs represent average weather conditions used for energy consumption assessment while DSYs represent extreme and near-extreme weather conditions used for the evaluation of overheating risk. The existing CIBSE weather files released in 2016 were created for a total of 16 locations in the UK. The overall process of creating future weather files follows three key steps, i.e., (1) creating observation base files to represent typical and extreme weather events; (2) analysing and extracting climate change signals from the raw climate projections; (3) creating representative future weather files based on observation files and climate change signals using
To overcome the above limitations and support the transition of the built environment sector into a climate-resilient future, we have created the state-of-the-art CIBSE weather files using machine learning, statistical downscaling, extreme event analysis, as well as the latest climate projections from UKCP18. Embedded in the methodology and pipeline of weather file creation, the major original contributions of this research, as compared to the existing UKCP09 based CIBSE weather data, are outlined as below: (1) the creation of 28 discriminative climate zones to enhance the representation of the UK climate; (2) the latest climate change signals from the UK Climate Projection 2018 (UKCP18); (3) the up-to-date observation record from 1994 to 2023 to base the new files on the recent record-breaking warming trend; (4) the integration of more authentic solar radiation data, namely the satellite based solar radiation data from CAMS (Copernicus Atmosphere Monitoring Service) data repository and the reanalysis data from ERA5 (the fifth generation ECMWF atmospheric reanalysis) data repository. In this study, the overall methodology developed for revising CIBSE weather files is reported to enhance the transparency of the new CIBSE weather files. A simple case study of overheating assessment is conducted to validate the spatial and temporal coherency of the new files, and demonstrates the potential impacts of climate change using a two-bedroom flat. The new CIBSE weather files will be a valuable asset for the built environment sector and lay a solid data foundation for future-proofing building design in the UK.
Literature review
The research on weather and climate data is very popular, and many countries are developing bespoke weather files for building performance assessment. Specifically, under the International Energy Agency’s Energy in Buildings and Communities project Annex 80, a set of weather files representing both typical weather conditions and extreme heatwaves were created for a total of 15 major cities across 10 climate zones worldwide. 10 A regional climate model developed by Max Planck Institute for Meteorology, referred to as MPI-REMO, was selected as the source of underlying data since its projection of future temperature is closest to the median temperature of all climate model projections. The raw climate variables were bias corrected using quantile delta mapping (QDM) and Multivariate Bias Correction with N-dimensional probability density function transform (MBCn) methods. 10 The Boland–Ridley model 11 was used to calculate the direct and diffuse components of global solar irradiance. The weather files were produced for three periods: historical (2001–2020), future mid-term (2041–2060), and future long-term (2081–2100). Three heatwave years were selected based on the three most extreme heatwaves in each 20-year period, according to three criteria: the most intense, the most severe, and the longest heatwaves. Bass et al. 12 published future Typical Meteorological Year (TMYs) for 18 cities in the United States based on six global climate models (GCMs). The GCMs were statistically downscaled for 1980–2014 in the historical period and 2015–2059 in the future period under the SSP5 scenario. The hourly data was derived from the daily downscaled output using the Mountain Microclimate Simulation Model. The TMYs were available for two periods: 2020–2039 and 2040–2059. Gaur et al. 13 created multiple typical-year based weather files for 564 locations across Canada using bias-corrected Canadian Regional Climate Model version 4 (CanRCM4) large ensemble simulations. The files include a typical meteorological year for building energy applications, a typical and extreme moisture reference year, a typical downscaled year, an extreme warm year, and an extreme cold year. The weather files were created for several global warming levels, namely 0.5°C, 1°C, 1.5°C, 2°C, 2.5°C, 3°C, and 3.5°C. Machard et al. 14 prepared typical TMY and future heatwave events (HWE) for France using data from European Coordinated Regional Downscaling Experiment (EURO-CORDEX) climate projections at 12.5 km spatial resolution under the RCP 8.5. The typical years were assembled following ISO EN 15927-4, which implements equivalent weight to temperature, humidity, and solar irradiance and secondary weight to wind speed. The heatwaves were selected following the French national heatwave definition, based on daily daytime and nighttime temperatures above specific thresholds. In addition to future weather data, some studies focus on the improvement of the underlying methods for weather data selection and representation. For example, Wu et al. 15 proposed a novel method that uses daily statistical distributions and probabilistic sampling to capture both average and extreme conditions for selecting a Representative Meteorological Year (RMY). Typical meteorological days were selected using Z-score based daily statistics from the cumulative density function (CDF) distributions at a number of percentiles, which correspond to the total number of days in a calendar month. RMY files capture extreme temperatures and dry-bulb temperature distributions more accurately. According to simulation results, they also reflect both the total and peak loads more truthfully and demonstrate stronger consistency with hourly load distributions. More detailed reviews on weather and climate data for building and energy applications can be found in Ref. 16 and 17.
Despite the differences in the choice of climate data among existing studies from different countries, the dominant trend shared in this area of research is to exploit the state-of-the-art climate projections with high spatial and temporal resolutions for weather file creation. As aligned with this trend, the latest UKCP18 projections were utilised to revise CIBSE weather files. Additionally, in our study the UK is divided into a total of 28 climate zones to guide weather file creation and selection by considering the variance of local climates, as opposed to the practices of arbitrary selection of a number of locations adopted in the existing studies and in the previous CIBSE weather files (2016 version). The climate zone is the major new feature that distinguishes our study from the existing works. The detail is elaborated in the Session 3 in the methodology as below.
Methodology
The efforts of revising CIBSE weather files can be divided into two categories, to satisfy both the basic and the advanced requirements from the industry on weather data. Firstly, the underlying data of observation and climate signals were updated to satisfy the basic demand for weather files with latest trend of climate change embedded. The up-to-date observation data from 1994 to 2023 were used to create representative weather conditions/events, whereas climate signals were extracted from the latest UK climate projections, namely UKCP18.4,5 Additionally, new methods were explored to enhance the quality, the availability, as well as the usability of CIBSE weather files. The most important new feature with the revised CIBSE files is climate zones. The zone-based concept is rooted deeply in every stage of weather file creation. Besides, non-linear morphing paradigms and equations were also experimented, as reported in our previous study. 18 In this section, we will focus on the overall process of revising CIBSE weather files in the following sequence, i.e., (1) the creation of climate zones, (2) the update of observation files, and (3) the creation of future weather files. The details are presented as below.
Creation of climate zones
Limitations with using 16 locations
The existing CIBSE weather files are provided for 16 locations in the UK, including 14 distinctive locations and 2 additional sites for London. Historically, the selection of the 14 locations was largely decided based on the availability of weather stations, rather than the climate patterns across the UK. There is a lack of justification as to whether they are truly capable of representing the UK climate. The concerns on representing the climate of Scotland using only two locations, i.e., Edinburgh and Glasgow, has already been raised. 19
The lack of consideration of the spatial pattern of the UK climate in the existing CIBSE weather files results in ambiguity when selecting weather files. The current practice is to select files based on geographical proximity, as shown in Figure 1. According to the National Calculation Methodology (NCM) modelling guide, it is recommended to select the weather file from the location which is closest to the building site. In the presence of a microclimate, one of the other 13 weather files may be used if the weather data is deemed more appropriate.
20
The guidance recognises the importance of using a weather file representative of local climate, but provides no explanation on how to identify a truly representative file. Distance-based zones using 14 distinctive CIBSE weather locations.
Method for creating granular climate zones
To resolve the lack of consideration of the spatial pattern of the UK climate in the existing CIBSE weather files, a two-tiered ensemble clustering method was designed to create granular climate zones in the UK, using the regional climate projections with 12 km resolution in UKCP18. The first tier identifies primary spatial climate patterns in the UK whereas the second tier further segments microclimate from each primary climate zone. The schematic of the proposed two-stage clustering process is presented in Figure 2.
21
Proposed two-tiered clustering method for climate zone identification.
Specifically, a total of 12 model projections over a 100-year period, i.e., 1981–2080, under the RCP8.5 emission scenario in the regional projections were employed as the raw dataset. Within the first tier, a total of 41 features, including 39 climatic features and 2 features of geographical location, were extracted from each model projection and used as the input variables for the ensemble clustering model. The ensemble clustering model encapsulates 12 base K-means (KM) models, where each member projection within the ensemble dataset was fed into a single KM model following the bagging method. A total of 12 variants of climate zoning results were produced by 12 base KM models and the finalised primary climate zones were generated subsequently using an agglomerative clustering process.
In the second tier, a similar clustering process was followed. The only difference lies in the climatic variables used for clustering analysis. Since temperature is one of the most important variables for building performance assessment and is widely used to measure the microclimate, such as the intensity of urban heat island (UHI), we only employ three temperature related variables in the second tier of clustering, namely maximum temperature (
The identified climate zones will provide a granular representation of the UK climate with clear boundaries defined. The selection of weather files becomes a simple look-up to identify the zone that a point of interest belongs to. The climate zones will be used to inform weather file creation. Specifically, a single grid cell which shows the highest similarity to the overall condition of the zone is identified to create weather files. Wasserstein distance of the climate variables between a single cell and the collection of all cells within the climate zone is employed as the selection criteria. As such, weather files created based on the selected grid cell is able to represent the climate condition of the whole zone.
Update of observation files
The prerequisite for creating CIBSE future weather files is to have observation files which can represent different types of weather conditions from a long period of historical record, such as average conditions for energy assessment (TRY) and extreme conditions for overheating assessment (DSY). The average conditions are identified using Finkelstein–Schafer statistics, whereas the extreme conditions are determined using extreme value theory.22,23 Three DSY files were defined and created by CIBSE previously to represent extreme events with different levels of intensities, and durations. Compared to the previous CIBSE weather files, the same statistical methods are followed to create the observation files for each climate zone, but with updated underlying data. The details of the statistical methods are not reported here, as this is not the focus of this paper but they can be found in the existing literature.22,23 In this section, we will focus on two major updates regarding the underlying observation data, namely the observation period and the solar radiation data.
Observation record
The representative weather conditions within the previous CIBSE weather files were established using the historical observation data from 1984 to 2013. However, according to Met Office, five out of the top ten hottest days since 1900 occurred after the year of 2014 in the UK. 24 The passing of time has made the existing weather files out of date. They are no longer based on the latest data and scientific understanding of climate change, which becomes a major concern among the file users. Hence, in the revised CIBSE files, we employ the most up-to-date observation data from 1994 to 2023 to extract representative weather conditions and events, and incorporate the latest trend of climate change.
Solar radiation data
Solar radiation plays an important role in causing building overheating. Historically, it has been a real challenge to obtain high-quality solar radiation data since very few weather stations records it. In the previous CIBSE weather files, the solar radiation data were estimated based on solar geometry and a simple cloud-radiation model. 9 Many doubts have been raised upon the accuracy of the modelled solar data.
Data availability is less of an issue nowadays, as remote sensing and reanalysis data are becoming increasingly available with a high spatial and temporal resolution. For example, the Copernicus Atmosphere Monitoring Service (CAMS) provides historic global, direct and diffuse solar irradiation based on satellite observation data. 25 The CAMS approach combines atmospheric models of aerosols, water vapour and ozone with the Meteosat Second Generation (MSG) satellite observations of cloud cover to provide an estimate of solar irradiation at the point of interest. 26 However, the CAMS data is only available for the time beyond January 2004. The ERA5 (the fifth generation ECMWF atmospheric reanalysis) reanalysis data repository is another great resource when observation data is absent. It assimilates satellite and ground observations with climate model predictions to recreate observations on a regular grid. 27
In the revised CIBSE files, both CAMS and ERA5 solar data are used to replace the previous modelled data. For the time after January 2004, CAMs data are used to fill in the global, diffuse and direct normal irradiation. For the time before January 2004, the global solar radiation data are extracted from the ERA5, and the direct normal and diffuse irradiation data are calculated subsequently from the solar altitude. The updated solar data will enable a more accurate assessment of overheating risk.
Creation of future weather files
The future weather files are created using the UKCP18, i.e., the latest generation of national climate projections for the UK.4,5 Four types of projections with different spatial resolutions are available in the UKCP18, including probabilistic projections (25 km), global projections (60 km), regional projections (12 km), and local projections (2.2 km).
Climate projection entails many layers of uncertainty, such as future carbon emissions, initial states of climate models, as well as imperfect knowledge of the climate system. The creation of future weather files needs to consider various scenarios and parameter settings to account for the uncertainty of climate change and enables assessments under different future scenarios, time horizons, as well as extreme events with various intensities. Among all climate projections, the probabilistic projections are most suitable for uncertainty quantification owing to the fact that they encapsulate the likely outcomes of climate change produced by 3000 models. 4 Therefore, the probabilistic projections are employed to extract various climate signals and create future weather files.
The technique used for creating future weather files is bounded weighted stretch morphing algorithm, which applies change factors of climatic variables to the observation files in a linear manner with bounded minimum and maximum values. The details of this bounded morphing method can be found in our previous paper. 9 The same method was also used to create UKCP09 based CIBSE weather files. Following a similar morphing routine, the UKCP18 based weather files were created for each climate zone, under four emission scenarios, i.e., RCP8.5, RCP6.0, RCP4.5, and RCP2.6, four time horizons, i.e., 2020s (2009–2029), 2030s (2019–2039), 2050s (2039–2059), and 2080s (2069–2089), as well as three percentile settings, i.e., 10th, 50th, and 90th. The future weather data yielded by morphing not only incorporates the climate change signal, but also retains the hour-to-hour variability of the observed weather time series.
Results and discussion
In this section, the key results of the UKCP18 based CIBSE weather files are presented in terms of the climate zones and the simulation results for a case study building.
Climate zones
As shown in Figure 3, a total of 28 granular climate zones are identified using the proposed ensemble clustering model. They capture local variations of climate at a range of scales from large urban areas, such as the Greater London Area, to national parks, such as Dartmoor and the Pennines. The results prove that the spatial pattern of the UK climate is very complicated and the current 14 locations used for CIBSE weather files are unable to capture such diverse patterns. Within the area of Scotland, 12 different climate zones are identified, but the existing weather files are only provided for two locations, i.e., Edinburgh and Glasgow. This means that even for a building located in the Scottish Isles, the weather files from Edinburgh or Glasgow would be used. In contrast, if weather files are developed according to the identified climate zones, such controversies can be eliminated ultimately owing to the enhanced representation of diverse climate conditions, such as the climate in urban area, costal area, mountain area, etc. The definitive boundaries of climate zones also eliminate the ambiguity of selecting weather files based on geographical proximity. 28 granular climate zones in the UK (left) and the selected representative cells within each zone (right).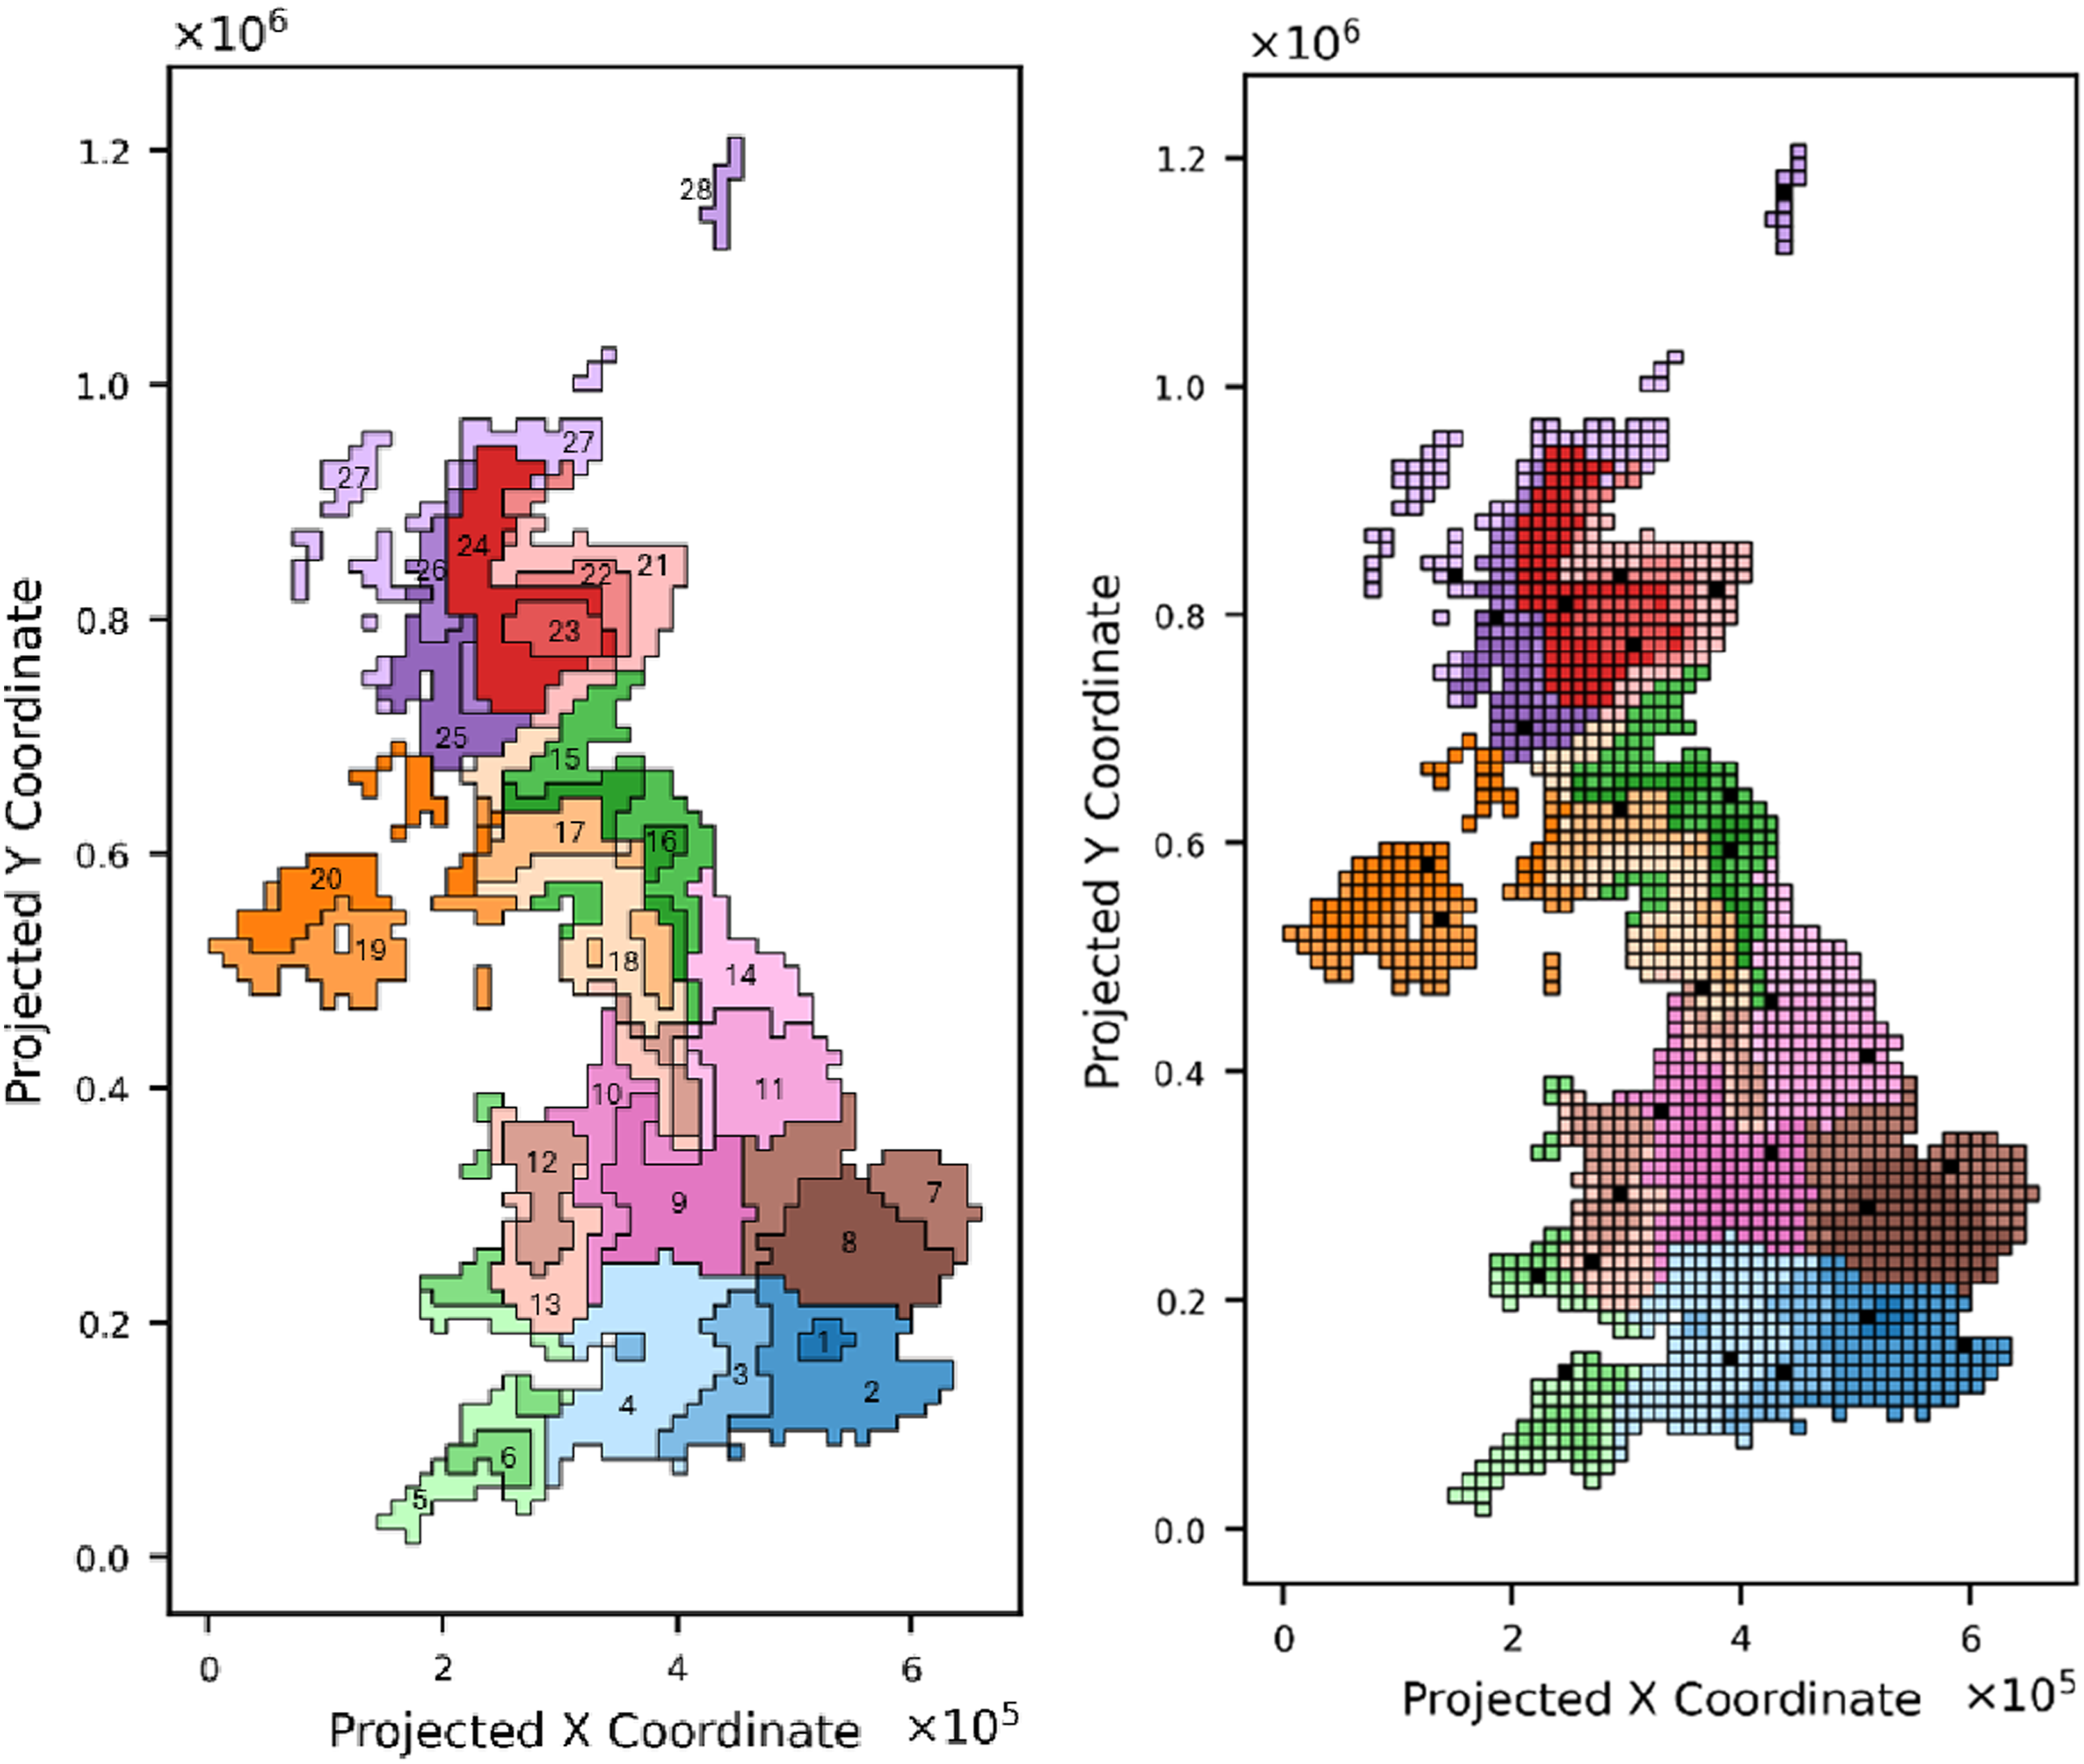
Therefore, using the identified 28 climate zones in the UK, the previous CIBSE weather files were revised using the UKCP18 climate data. The representative locations are firstly identified from climate zones, as indicated by the black dots in Figure 3 (right). Ideally, the observation data and climate signals should be extracted for the identified locations to create weather files representative of the whole zone. However, due to the availability of the observation data, the closest weather stations with sufficient amount of data are employed as the proxy for the identified representative locations. Subsequently, the observation files are created and morphed to obtain future weather files using probabilistic climate change signals from the UKCP18.
In total, the UKCP18 based CIBSE weather data product contains more than 5000 DSY and TRY files, taking into account four emission scenarios, i.e., RCP8.5, RCP6.0, RCP4.5, and RCP2.6, four time horizons, i.e., 2020s (2009–2029), 2030s (2019–2039), 2050s (2039–2059), and 2080s (2069–2089), as well as three percentile settings, i.e., 10th, 50th, and 90th. As such, the climate zones enable the creation of more localised weather files for building performance assessment.
Simulation results of the UKCP18 based CIBSE weather files
A case study about building overheating is conducted to evaluate the spatial and temporal consistency of the UKCP18 based files using DesignBuilder. The risk of overheating in 2050s under the highest emission scenario, i.e., RCP 8.5, across the 28 climate zones in the UK is demonstrated for a two-bedroom flat using DSY1 files at 50th percentile.
Building model
Key parameters and settings for the case-study flat.


Layout of the flat for case study.
Risk of overheating in 2050s
Overheating simulation results of 28 climate zones in 2050s using DSY1.
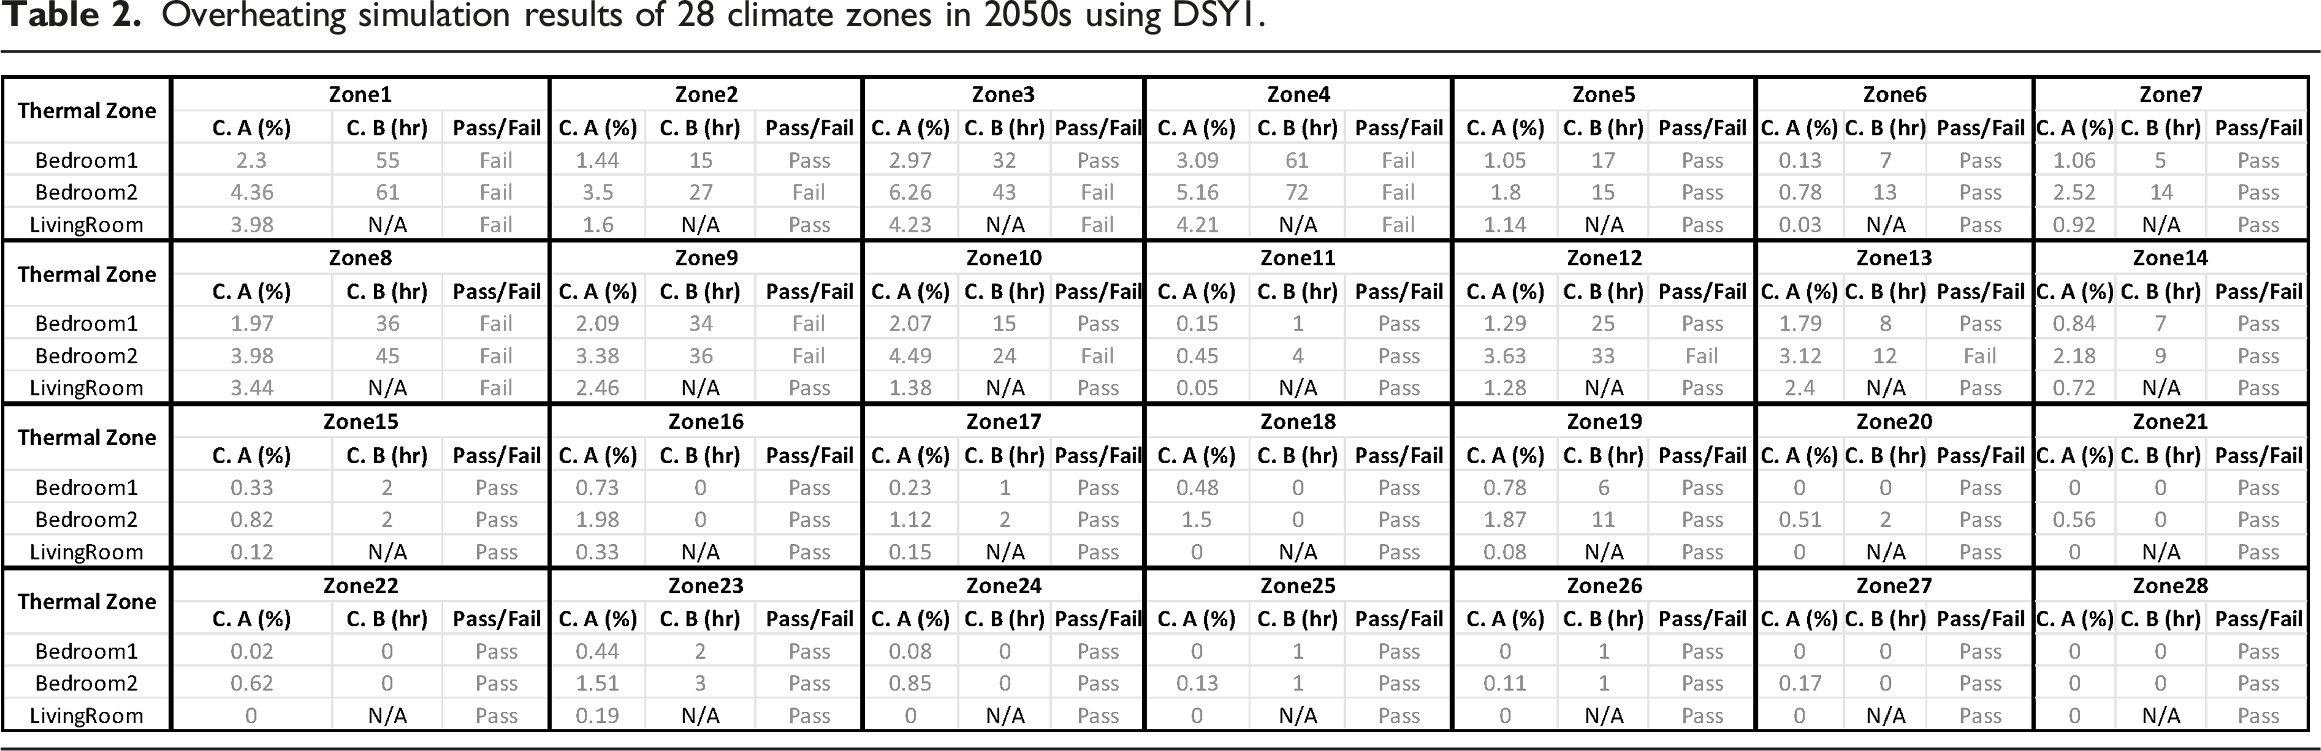

No overheating occurs for the rest of the country extending from Northern England to Scotland based on the results from the 2050s DSY1 files under RCP8.5 at 50th percentile. Please note this finding is based on DSY1 files only which represent a near extreme event with a return period of 7 years. Buildings in these regions could still overheat during more extreme heat events. DSY2 and DSY3 files can be used for stress testing building design under more intense and longer heat events. Besides, the current overheating assessment methodology (TM59) applies the same temperature threshold in the criteria, i.e., 26°C, across the whole country. Whether the large area in Scotland should use the same threshold as in London remains a research question to be investigated. The problem of overheating in the northern part of the UK might not be reflected properly by the current assessment criteria. In all, the spatial coherency demonstrated by the simulation results proves that the climate zone based weather files are reliable and enable more accurate assessment of building performance.
Comparison against the current climate
Comparison of overheating simulation between the current and 2050s.

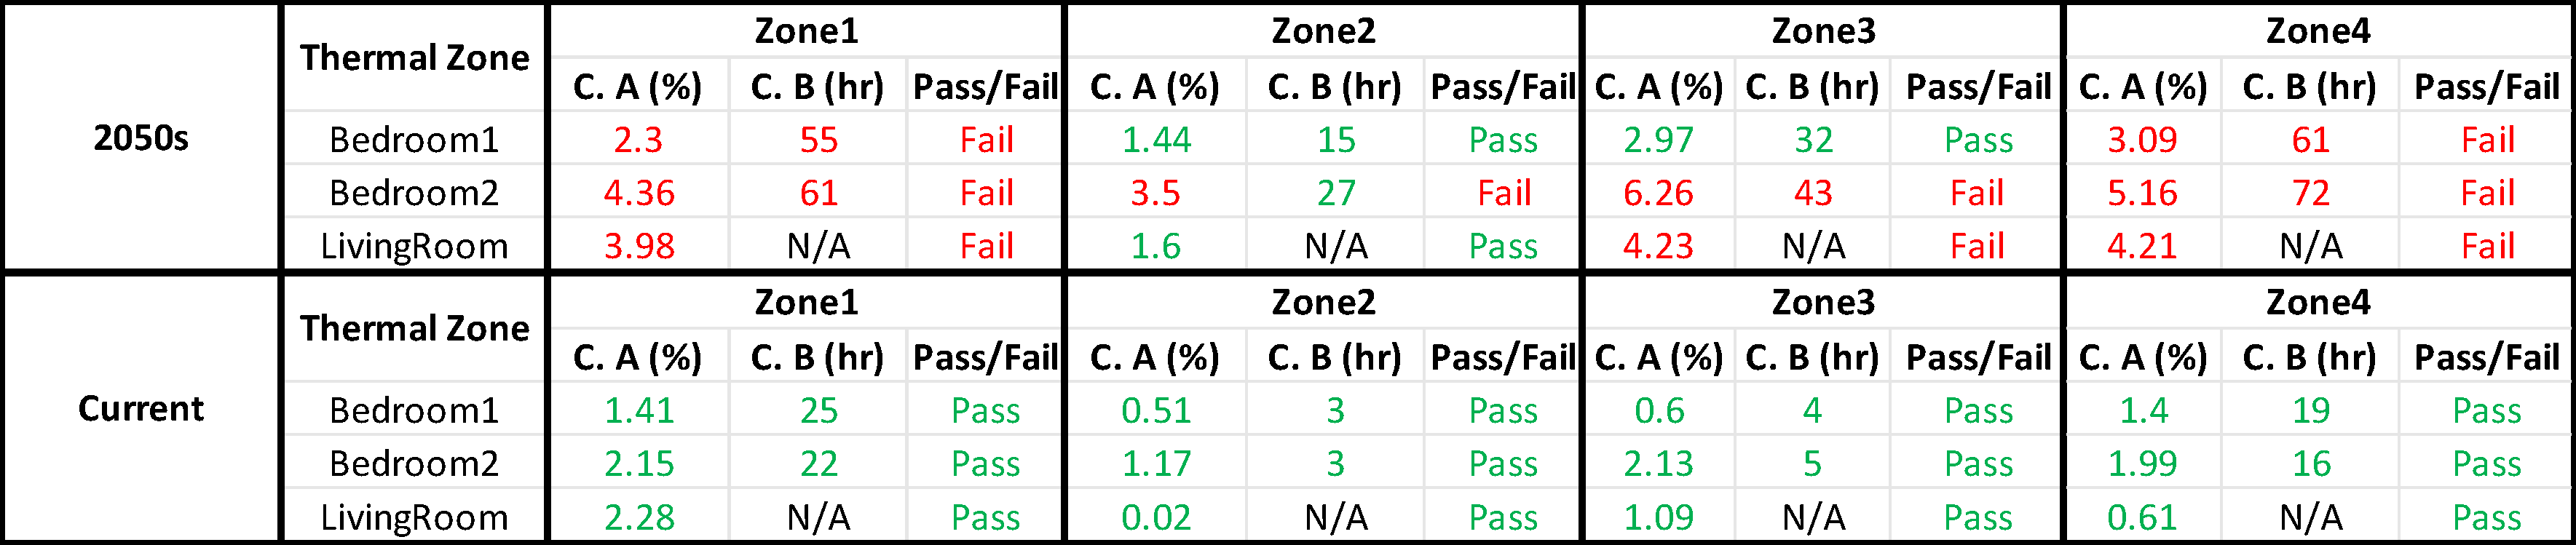
This case study indicates that certain types of building with poor thermal performance and large glazing area can be subject to significant overheating risks in future, as a result of climate change. This needs to be addressed to ensure that buildings, while having net zero carbon emission by 2050, are also future-proof. As outlined by the IPCC climate risk assessment framework, high-quality climate hazard data is the key to measure the scale and dynamics of possible damages from the impacts of climate change. Fit-for-purpose and reliable climate data is the prerequisite for data-driven decision making regarding climate adaptation. By including the representation of climate zones in the weather files, physical risk of climate change can be assessed more accurately using localised weather data and bespoke mitigation and adaptation strategies can be made subsequently.
Conclusion
In this research, the state-of-the-art CIBSE weather files were created and evaluated using building simulation. Four major updates were introduced in the new files, namely, (1) a total of 28 discriminative climate zones to enhance the representation of the UK climate; (2) the latest climate change signals from the UKCP18; (3) the up-to-date observation record from 1994 to 2023 to base the new files on the recent record-breaking warming trend; (4) the integration of more authentic solar radiation data, i.e., the satellite based solar radiation data from CAMS data repository and the reanalysis data from ERA5 data repository. The revised CIBSE weather files were tested using a case study flat to demonstrate the risk of overheating across all climate zones in the UK in 2050s. The overall results prove that the new files are reliable with the spatial coherency observed across 28 climate zones in the UK. Additionally, for a large geographical area in the UK, the case-study flat could be exposed to overheating risks by 2050s, especially in regions such as Greater London, Midlands, Southern England, owing to the poor thermal performance and the large glazing area.
The new CIBSE weather files are subject to several limitations. Firstly, there is limited consideration of urban heat island effects owing to the absence of long record of historical weather observations for urban centres across the UK. Secondly, the new CIBSE weather files use RCP (Representative Concentration Pathway) scenarios for different time horizons following the UKCP18. It can be further simplified by creating weather files under bespoke global warming levels, such as 2 and 4°C. Lastly, the simulation was only conducted for one specific building type using DSY1 files at 50th percentile in 2050s under RCP 8.5. Therefore, the findings in the case study should not be generalised for the whole building stock in the UK. In future, we will further improve the weather files by incorporating the urban heat island effects using high-resolution climate projections and replacing complex RCP scenarios and different time horizons with bespoke global warming levels. We will also run building simulations at large scales using all new weather files and various representative building types to investigate the best design and retrofitting practices for delivering a climate-resilient future for the UK building stock.
It is a great challenge to address the problem of building overheating at scale in the UK with a narrow time window between now and 2050s. To achieve climate resilience, it requires effective decision making upon mitigation and adaptation driven by good-quality and fit-for-purpose climate data. The revised CIBSE weather files provide a solid data foundation for achieving a climate-resilient future for the built environment sector in the UK.
Footnotes
Declaration of conflicting interests
The authors declared no potential conflicts of interest with respect to the research, authorship, and/or publication of this article.
Funding
The authors disclosed receipt of the following financial support for the research, authorship, and/or publication of this article: This work is funded by the Innovate UK through the Knowledge Transfer Partnerships (KTPs) programme, grant no. 12939.