
Abstract
Introduction
With the rapid development of industrial production, oil and natural gas resource demand has been increasing over the years. As conventional oil/natural gas resources have been gradually depleted, tight oil/natural gas reservoirs have recently become significant sources and have become a hot spot for exploration and development. China and North America are setting off a boom in nonconventional oil/natural gas and other resources (Lu et al., 2015; Tan et al., 2016; Zou et al., 2015). The nonconventional oil and natural gas resources that have been proven and put into production include shale gas, coal bed methane, tight oil and natural gas, etc. (Chew et al., 2014; Ding et al., 2016; Pan et al., 2017; Wang et al., 2016, 2017).
Sulige gas field in Ordos Basin, China, is a typical compact terrigenous sedimentary sandstone tight gas reservoir. Since 2005, as a typical large unconventional gas field, it has been put into large-scale development and has gradually become the largest tight gas field in China (Shad et al., 2016; Wu et al., 2015; Yang et al., 2011). This region contains a huge amount of resources. Development in a scientific and effective way will lay the foundation for the follow-up development for China’s oil and gas industry (Lu et al., 2015; Yang et al., 2006).
Considerable work was conducted by experts during the early exploration stage. Lan et al. (2007) studied the relationship between the sedimentary facies control, the diagenetic transformation, and the favorable paleogeography distribution and natural gas accumulation in the expulsion phase of source rocks and discussed the geological factors controlling the distribution of the “sweet spot” regions that have relatively high porosity. Yang et al. (2007) found that there were many similarities between the reservoir at the He-8 section in the Sulige region and the Xujiahe group reservoirs in the middle of Sichuan and that the Paleozoic Permian He-8 and Shan-1 gas reservoirs in Ordos Basin have the characteristics of large depth of burial, long burial time, and high degree of diagenesis (Liu et al., 2015). Those reservoirs are typical tight gas, high quality, developed reservoirs, and most of the natural gas is stored in these “sweet spot” layers (Ter Heege et al., 2015; Zhou et al., 2016).
Along with the continuous development of tight gas reservoirs in Ordos Basin, many experts and scholars have conducted in-depth studies on the accumulation mechanism of tight gas, the classification characteristics of oil and gas reservoirs, and the distribution characteristics of high efficient oil and gas reservoir sweet spots in this area. They have produced numerous key results and have successfully completed the early exploration and development tasks (Guo et al., 2017; Ran and Li, 2008; Yang et al., 2017). Ordos Basin is composed of lenticular reservoirs, and the effective sand bodies are small in scale (Guo et al., 2014; He et al., 2013). The control reserves of wells are low, and the reservoir structure is the typical “sand–sand” binary structure (Santagiuliana et al., 2015). The middle part of the layer, the lenticular reservoirs with higher porosity and permeability, is a coarse sand-based high-quality layer, while the surrounding and edge regions are a fine sand-based tight layer. The seepage characteristics of these layers are special (Luo et al., 2015) and are not applicable to any previous seepage mechanism. However, few experts have investigated the seepage mechanism of the reservoir layer that has binary composite structure. In order to fill this gap, it is necessary to conduct a thorough study on the seepage mechanism of the lenticular binary composite structure reservoir (Freeman et al., 2013; Ghaderi and Clarkson, 2016; Ghanizadeh et al., 2015).
The study of reservoir fluid seepage provides the basis of reservoir development. Based on the sweet spots in Sulige tight gas reservoir, Ordos Basin, China, in order to study the seepage of lenticular reservoirs in a comprehensive and quantitative way, a mathematical model of the lenticular reservoir needs to be developed (Baziar et al., 2014; Jiang et al., 2015; Ren et al., 2014; Zhuang et al., 2016), and the analytical solution can then be solved. The analytical solution is used to calculate the ideal model and derive the seepage mechanism by analyzing the calculation result. The gas supply characteristics and flow, as well as development mode of sweet spots in this region can eventually be obtained.
Basic geological characteristics of the tight gas reservoir in Ordos Basin
The tight gas reservoirs in Ordos Basin are pore-type reservoirs in which the sand bodies are distributed in the lenticular type. The reservoir structure is the typical “sand–sand” binary structure (Figure 1). The abundance of reserves is low, and the daily output of a single well and the accumulated yield of a single well are also low. However, the distribution range of the gas reservoirs is vast. There is no obvious gas boundary, and the overall reserve scale is large. It is the major component of the gas reservoir in tight sandstone in China (He et al., 2012; Lu et al., 2015; Santagiuliana et al., 2015; Wang et al., 2016).

The lenticular reservoirs with relatively higher permeability widely distributed in tight sandstone are the most essential features of this kind of gas reservoirs. However, not all sandstones are effective reservoirs. The permeability of the lenticular reservoirs is more than 0.5 mD, while the permeability of tight sandbody is less than 0.05 mD. The hydrodynamic of the sediment in this type of river varies significantly, forming different sediments of coarse and fine sandstones. The coarse sandstones were deposited on the main channel, while the medium and fine sandstones were deposited on other parts. From the special cores analysis, the coarse sandstones formed a high-quality, gas-bearing sand body that has a porosity of 5% or more and a permeability of 0.5 mD or more, which is the main producing layer of the gas reservoir. The fine sandstones, on the other hand, formed a tight layer with a porosity of 5.0% or less and a permeability of 0.1 mD or less, which has limited contribution to production and is currently classified as a noneffective layer.
These types of sedimentation and diagenetic characteristics result in the small size of the effective sand bodies, scattered distribution, generally in the range of several tens to several hundreds of meters, and poor horizontal continuity and connectivity (Figure 2).

Section of typical gas reservoirs in Sulige region, Ordos Basin.
However, these sand bodies are present in large quantities, have multilayer structures, and are distributed across a vast range. If all effective sand bodies are projected onto one layer, the gas-bearing area can reach more than 90%. The highly scattered distribution of the lenticular reservoir determines the production characteristics of the gas reservoirs: due to the small scale of the effective sand body, the single well production is low, the stable production capacity is poor, and the single well control reserves and the final accumulated yield are low. Generally, the dynamic reservoir controlled by a single well is less than 30 million cubic meters, and the gas production rate can keep 10,000 cubic meters for three years, then the production rate will keep decline for about 7–10 years until the reservoir pressure is too low to produce (Fan et al., 2016; Jang et al., 2016; Zhao et al., 2016).
Mathematical model and its solution
Description of the physical model
As shown in Figure 3, the so-called sweet spot refers to an effective reservoir that has relatively high quality, which is the main producing layer of the gas reservoir. After the wellbore opens, when the pressure wave propagates to the sweet spot boundary, it will continue to spread to the nonmain producing layer, demonstrating the gas supply characteristics and gas flow of the reservoir in the tight area.

Schematic diagram of reservoirs in heterogeneous gas reservoirs.
In order to study the gas supply characteristics and development mode, a seepage model was established. Figure 4 displays the schematic diagram of the seepage model for heterogeneous gas reservoirs, which are divided into two zones due to different permeabilities. Zone I represents the “sweet spot” area that has relatively high permeability, and zone II represents the thicker, nonmain producing layer. Set

Schematic diagram of the seepage model for heterogeneous gas reservoirs.
Establishment of the mathematical model
According to the basic methods and steps of establishing the mathematical model of seepage flow, the unstable mathematical model of heterogeneous tight reservoir was established using single-phase compressible gas seepage as an example. The basic assumptions are as follows. The gas reservoir contains a single-phase homogeneous gas, which obeys the low-speed non-Darcy law; the gas compression and the stress sensitivity of reservoir are considered; the seepage process is isothermal.
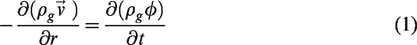
The basic components of the seepage mathematical model are the continuity equation (mass conservation equation), the equation of motion (momentum conservation equation), and the state equation. In actual production, radial flow is generally presented in the vicinity of the bottom of each well. Thus, the mathematical model can be written in the coordinate system (Liu et al., 2016; Stehfest, 1970).
The continuity equation is given as
The equation of motion is given as

The threshold pressure gradient is as follows

The stress sensitivity of the gas reservoir is

The state equation is

The pseudo-pressure function is defined as

The initial conditions are

Considering the boundary conditions in steady production

The pseudo-threshold pressure gradient is defined as

Substituting equations (2) to (5) into equation (1), equation (1) can be simplified as


Dimensionless parameter 
The governing equation (equation (10)) can be derived as


Equation (13) becomes

Solution of the mathematical model
Considering the steady production of the inner boundary, zone I that surrounds the well satisfies equation (15); the permeability of zone I:
Solving equation (15) gives

Considering boundary condition equation (7) gives

Substituting equation (17) into equation (16), 
Similarly, zone II surrounding the well satisfies equation (15). The permeability of zone II satisfies
The pressure at 


Results and discussion
Characteristics of the gas supply
The parameters used in the analysis are listed as follows: formation pressure is 25.0 MPa; porosity of sweet spot zone is 10% while the porosity of low permeability is 3%; zone I is the high-permeability area (500 m radius, 0.5 mD permeability, 0.030 MPa-−1 stress sensitivity coefficient of reservoir); zone II is the low-permeability area (0.03 mD permeability, 0.015 MPa-−1 stress sensitivity coefficient of reservoir); gas reservoir thickness is 10 m; pressure relief radius is 1000 m; wellbore radius is 0.1 m; threshold pressure gradient is 0.003 MPa/m; standard state pressure is 0.1 MPa; gas compression factor is 0.89; gas isothermal compression coefficient is 0.03 MPa-−1; standard state temperature is 273.0 K; formation temperature is 396 K; gas viscosity is 0.027 mPa s; gas production is 5.0 × 10⁴ m3/d.
Figure 5 shows the variation of the heterogeneous formation pressure with distance at different production times. It can be seen that with increasing production time, the formation pressure decreases, and the pressure gradient of the formation changed obviously in the boundaries of zone I and II.

Pressure at different production times.
Figure 6 shows the variation of the pressure gradient under heterogeneous formation with distance under different production times. With the increase in production time, the pressure gradient of the formation in zone I did not change significantly in the high-permeability region but suddenly increased at the boundary point. The pressure gradient in zone II increased. It can be seen that with increasing time, the low-permeability region supplies gas to the high-permeability region.

Pressure gradient at different production times.
Figure 7 shows the variation of formation pressure versus pressure drop radius under different conditions of gas production. It can be seen that under the steady production of the interior boundary, the formation pressure is gradually reduced with the increase in gas production, and the influence of heterogeneity on the pressure distribution increases.

Pressure at different production times.
Figure 8 shows the variation of the heterogeneous formation pressure gradient versus pressure drop radius under different production conditions. It can be seen that the pressure gradient dramatically increased at the interface between the high- and low-permeability regions. The higher the daily gas production, the larger the formation pressure gradient.

Pressure gradient at different production times.
Development mode of the sweet spot
The high-permeability region is first utilized in gas production. When the pressure reaches the boundary of the high-permeability region, the production shows a sharp decrease because of the low reservoir pressure to supply gas. With the increase in pressure difference beyond the threshold pressure of the exterior low-permeability region, the reservoir in the low-permeability region begins to be utilized. The gas supply from the exterior low-permeability region is also observed in real production.
Figure 9 displays the production curve of Su-XX well. Based on the gas well production, Su-XX well cumulatively produced 44.85 million cubic meters of natural gas by January 2010. According to the dynamic reserves of 50.60 million cubic meters, the recovery factor of dynamic reserves reached 88.6%, approaching the condition of abandonment. However, the average daily production of this well in August 2015 was still above one million cubic meters in reality, and the cumulative gas production was 59.06 million cubic meters, which is more than the reserves of sweet spot area.

Production curve of Su-XX well (in stage I, only the sweet spot area supplies the gas; in stage II, low permeability begins to supply gas, but the production is discontinuous because of low reservoir pressure).
Figure 10 displays the fit of the dynamic control reserves of Su-XX well in the period of sweet spot supply. As shown in Figure 10, gas wells were in continuous stable production. According to this relatively stable production data, the exponential decreasing method was used to predict the dynamic control reserves of Su-XX well to be 54.6 million cubic meters.

Fit of dynamic control reserves of Su-XX well in the period of steady production (in stage I, only the sweet spot area supplies the gas; in stage II, low permeability begins to supply gas).
Figure 11 displays the fit of the dynamic control reserves of Su-XX well in the late period of intermittent production because of low reservoir pressure. As shown in Figure 11, intermittent production stage was used, which resulted in a large change in production since July 2006. The trend of the production data in this period is different from that in the sweet spot supply period. According to the decreasing trend in the late stage of intermittent production, the dynamic control reserves of Su-XX well are predicted to be 64.5–72.0 million cubic meters.

Fit of dynamic control reserves of Su-XX well in the late period of intermittent production (in stage II, low permeability begins to supply gas, so the dynamic control reserve is more than which is predicted by data in stage I).
From the comparison of the dynamic control reserves predicted by the low-permeability area production data after the sweet spot supply gas state, the peripheral low-permeability area was supplying gas to the gas well. The comprehensive analysis shows that there was gas supply to the gas well in the low-permeability reservoirs of the Su-XX wells, and the gas supply was about 9.9–17.4 million cubic meters.
Conclusions
Based on the mass conservation equation, the low-speed non-Darcy motion equation for gas and the real gas equation of state, and considering the reservoir stress sensitivity, a mathematical model of the low-speed non-Darcy flow in the sweet spot zone was established. The derived analytical solution of radial flow under boundary conditions provides a theoretical basis for studying the development characteristics of these typical tight gas reservoirs. With the increase in production time, the formation pressure gradient did not change significantly in the high-permeability region but suddenly increased at the boundary region and gradually increased in the low-permeability region. With the increase in gas production, the formation pressure was gradually reduced, and the impact of heterogeneity on the pressure distribution increased. The pressure gradient of the heterogeneous formation under different gas production conditions showed a clear trend with the change in the pressure drop radius. The pressure gradient of the formation increased abruptly at the boundary of the high- and low-permeability regions. The higher the daily gas production, the greater the gradient of the formation pressure. The binary structural characteristics of the reservoirs in Ordos Basin determined its production characteristics. By analyzing the production curve and dynamic control reserves, it can be seen that the gas production first occurred in the high-permeability region. When pressure reached the boundary of the high-permeability region, the production characteristics of the pseudo-steady state appeared. With the increase in the production pressure difference that exceeded the threshold pressure, the low-permeability region began to be used. Based on the real production trend, the phenomenon that the exterior low-permeability region supplied gas to the high-permeability region was also observed.