
Abstract
Introduction
Shale gas is a new important unconventional natural gas resource that has been successfully and commercially developed in America and Europe, and the research of shale gas reservoirs and development technology has already been a global focus in the energy field (Agnieszka et al., 2014; Adiya et al., 2018; Bustin and Bustin, 2012; Clackson et al., 2016; Curtis, 2002; Curtis et al., 2012; Daniel and Ross, 2008; Estrada and Rao, 2016; Gross et al., 2015; Kuila and Prasad, 2013; Ross and Bustin, 2009). China is also quite rich in shale gas resources with geological resources amount of 95 × 1012 m3 and recoverable resources amount of 16.30 × 10¹² m3. In recent years, the exploration and development of shale gas has also been accelerated in China and huge breakthroughs have been made. In 2017, the shale gas production rate has reached 100 × 108 m3/a, most of which was produced in the Sichuan Basin (Jia et al., 2012; Jiao et al., 2014; Qiang and Li, 2017; Tian et al., 2013; Wu et al., 2014; Zhu et al., 2010).
In China, many previous studies have focused on the Longmaxi and Niutitang Formations in the Sichuan Basin (Chen et al., 2013, 2014; Hu et al., 2012; Tang et al., 2015; Sun et al., 2016, 2018; Wang et al., 2015; Wu et al., 2017). Generally, advantageous geological conditions of shale gas reservoirs include high total organic carbon (TOC) content, mature to over mature stage, rich brittle mineral with fractures developed, shallow to moderate burial depth, and high gas content (Li et al., 2013; Liang et al., 2014; Tang et al., 2018; Wang et al., 2016; Xi et al., 2018; Zhang et al., 2015a).
The Ordos Basin is a major oil and gas bearing basin in China, with an area of about 37.1 × 10⁴ km2, containing abundant oil, gas, and coal resources (Tang et al., 2014; Zhang et al., 2010). All the three major categories of mud shale are widely distributed throughout the basin, including the marine mud shale of Ordovician Pingliang Formation, the transitional mud shale of Carboniferous Benxi and Taiyuan Formation, and the continental mud shale of Permian Shanxi Formation and Triassic Yanchang Formation (Han et al., 2014; Guo et al., 2018a; Li et al., 2018; Liu et al., 2018). The eastern margin of the Ordos Basin is the second area with large-scale commercial development of coalbed methane (CBM) in China, and great progress has been made in the exploration and development of CBM and tight sandstone gas resources (Li et al., 2014; Meng et al., 2014; Qin et al., 2017; Tao et al., 2018, 2019; Xu et al., 2015). With the penetration of unconventional gas exploration and development, the co-exploration and co-production of three types of gas resources (CBM, tight sandstone gas and shale gas) have become a new trend in the area (Li et al., 2016; Yang and Liu, 2014; Zou et al., 2018). However, little research has been done on the mud shale reservoirs, especially the mud shale of coal-bearing strata in the eastern margin of the Ordos Basin. This study focuses on the distribution, pore characteristics, geochemical properties, and petrological characteristics of the mud shale in the coal-bearing strata to evaluate the potential of the shale gas resource and predict the favorable zones preliminarily.
Geological settings
The Ordos Basin is a large-scale stable cratonic basin located in North China, spanning Shanxi province, Shaanxi province, Gansu province, Inner Mongolia, and Ningxia autonomous region and containing the second largest amount of coal, oil, and gas resources in China (Xu et al., 2012; Yang et al., 2013). This basin is divided into seven tectonic units, i.e., Jinxi fold belt, Yimeng uplift, Weibei uplift, West thrust belt, Shanbei slope, Tianhuan depression, and Qinling thrust belt (Tang et al., 2012; Xue et al., 2012) (Figure 1). The eastern margin of the Ordos Basin is composed of the east of Yimeng uplift, the whole of Jinxi fold belt, and the east of Weibei uplift, and it is mainly a north–south striking and west trending monocline with a series of NE-SW trending tectonic structures, such as folds and faults (Yao et al., 2009) (Figure 2).

Distribution of the tectonic units in the Ordos Basin.
The main coal-bearing strata are the Lower Permian Shanxi Formation and Upper Carboniferous Taiyuan Formation in the eastern margin of the Ordos Basin. At present, the No. 4 + 5 and No. 8 + 9 coal seams are the primary targeted coal seams for CBM exploration and development, occurring at a depth of 300–2600 m and a thickness of 0.5–30 m. The vitrinite reflectance Ro of the coals ranges from 0.44% to 2.35% in most areas, generally increasing from east to west controlled by their buried depth, except for the areas nearby the Zijin Mountain controlled by the magmatic activity (Chen et al., 2015a, 2015b). Dark mud shales (for the convenience of research, carbonaceous mudstone, mudstone, and shale are collectively called mud shale in this paper) are well developed and distributed extensively and stably, both in the Shanxi and Taiyuan Formations, with a large deposition thickness. In the Shanxi Formation, a set of terrestrial delta and lacustrine dark mud shale deposits were developed, and the main lithology includes gray, gray–black, black mudstone, carbonaceous mudstone, shale and sandy mudstone, interactively distributed with siltstone and coal seam (Figure 3). In the Taiyuan Formation, a set of dark-black mud shale, including epeiric grayish-black mudstone, black carbonaceous mudstone, carbonaceous shale, is interactively distributed with limestone, siltstone, and coal seam.
Samples and methods
The data used in this study, such as burial depth and thickness of the mud shale, were collected from the information of 160 coalfield wells and CBM wells. Thirty-three mud shale samples of the Shanxi Formation and Taiyuan Formation were collected from the well cores and outcrop for the tests of geochemical and physical characteristics of the mud shale reservoir. All of these samples were collected from the 15 sampling sites distributed throughout the study area, including 13 outcrop samples (20 cm × 15 cm × 15 cm) and 20 core samples (with a diameter of 7.5 cm) and composed of 4 carbonaceous mudstone samples, 21 mudstone samples, and 8 shale samples (Figure 2, Table 1).

Tectonic map of the eastern margin of the Ordos Basin.
Introduction of the mud shale samples of Shanxi and Taiyuan Formations collected from the eastern Ordos Basin.


Stratigraphic column of coal-bearing strata in Linxing area of the eastern margin of the Ordos Basin.
The vitrinite reflectance measurements were performed following the China standards ASTM D 2798–06 (2006) and ASTM D 2799-05a (2005a). The TOC content of mud shales was tested following the China national testing standard GB/T19145-2003, using a carbon and sulfur analyzer (CS-230) and 80 mesh samples. The whole rock analysis and mineral composition analysis were performed using an X-ray diffractometer, following the China testing standards SY/T6210-1996 and SY/T 5163–1995 and under the conditions of 40 kV and 40 mA. The rock pyrolysis analysis was conducted following the China national testing standard GB/T 18602–2012.
Before the low-temperature liquid nitrogen adsorption experiments, all of the mud shale samples were broken and sieved to 0.23–0.45 mm and then dried at the temperature of 378.15 K for 24 h in the vacuumed oven. The low-temperature liquid nitrogen adsorption experiments were conducted with the automated surface area analyzer (ASAP-2020) under the conditions of 77 K and relative pressure from 0.01 to 1.00, following the China oil and gas industry standard SY/T 6154–1995. The pore classification scheme of the International Union of Pure and Applied Chemistry (IUPAC) was used to analyze the pore size distribution in which pores were classified into macropores ( > 50 nm), mesopores (2–50 nm), and micropores ( < 2 nm) (Rouquerol et al., 1994; Sing et al., 1985). Then, the structure of mesopores and macropores was analyzed using BET and BJH models, and the micropores structure was analyzed using DA and DR models. The methane adsorption tests of the five mud shale samples were conducted following the China national testing standard GB/T19560-2004 with the conditions of 303.15 K and the maximum equilibrium pressure of 10 MPa, after the samples were crushed and sieved to 60–80 mesh. The pore and mineral morphology were observed by using a scanning electron microscope instrument (Quanta 250).
Porosity and permeability were tested following the China national testing standard GB/T 29172–2012 and the China oil and gas industry standard SY/T 6385–2016. The mud shale samples were prepared cylindrical shapes with a diameter of 2.5 cm and a length of 5 cm. Then, both porosity and permeability were measured using Helium with ambient pressure of 5MPa.
The exploration and development of shale gas in the eastern margin of the Ordos Basin have not been started yet, and there is no relevant shale gas drilling, geological data, and conventional test data of mud shale. In this study, the volume method was used for the preliminary calculation of shale gas resources. Since shale gas is composed of adsorption gas and free gas, the two parts need to be calculated, respectively. The expression is as follows


Similar to CBM, the shale gas adsorption also conforms to the Langmuir isothermal adsorption law. Based on analysis of the methane isothermal adsorption curve of mud shale and the relationship between the adsorption gas content of mud shale and temperature and pressure, the adsorption gas content of mud shale can be calculated under the condition of actual formation pressure and temperature according to the Langmuir equation as follows

Results and discussion
Distribution characteristics
The thickness and buried depth of mud shale are the basic parameters of shale gas resource evaluation and the key factors influencing the formation of shale gas reservoir. In this study, 160 wells in the study area were studied for lithology classification and the thickness of each single mud shale layer and the total thickness of each well were calculated (Table 2). The statistical results show that the thickness of single mud shale layer is relatively small on the whole, with the average thickness of 3.74 m. The thickness of single mud shale layer in the Shanxi Formation is 4.27 m on average, with the maximum thickness of 30.34 m and the minimum thickness of 0.10 m, and that of the Taiyuan Formation is 3.20 m, with the maximum thickness of 30.50 m and the minimum thickness of 0.07 m. However, the cumulative thickness of mud shale is very large, because of the large number of mud shale layers in the study area. Therefore, the cumulative thickness of mud shale is relatively large, reaching an average of 77.60 m, and is mainly distributed over 60 m (Figure 4). The cumulative thickness of the mud shale in Shanxi Formation reaches 45.25 m on average, with the minimum of 5.12 m and the maximum of 111 m, which is the main contribution of the mud shale thickness in the study area. In Taiyuan Formation, the average cumulative thickness of the mud shale is 32.35 m, with the minimum of 1.00 m and the maximum of 77.96 m. Thus, in terms of thickness, the cumulative thickness of the mud shale can meet the requirement of shale gas exploration and development.
Mud shale thickness of the Shanxi and Taiyuan Formations.


Cumulative thickness distribution of the mud shale of 160 wells in the eastern Ordos Basin.
The thickness of the Upper Paleozoic mud shale gradually increases from north to south in the profile, and the mud shale in the middle-south is relatively thicker (Figure 5). However, the variation trend of coal seam is opposite to the mud shale. The thickness of the coal seam decreases gradually from north to south and is the thinnest in the middle. That is, the mud shale and coal seam have a relationship of restricting each other, resulting from the changes of sedimentary environment. From the perspective of the vertical distribution of the mud shale, the thickness of mud shale in Shanxi Formation is larger than that in the Taiyuan Formation in the north–south profile and the continuity of the former is also better. In the whole area, the mud shale of the Shanxi Formation is developed stably and has strong contrast. The mud shale shows a zonal distribution from north to south, and gradually thinning from west to east, ranging from 24 to 56 m and being thickest in the Shilou-Daning and Jiaxian-Linxian area with a largest thickness of above 88 m distributed in a large area (Figure 6). The development stability of the mud shale in Taiyuan Formation is worse than that in Shanxi Formation, showing the alternative distribution characteristics of thick and thin. On the whole, the thickness of the mud shale is larger in the north and south and is smaller in the middle with great variation. The thickness of mud shale in Taiyuan Formation is generally between 20 and 40 m, and it is the thickest in the Hequ-Zhungeer area, reaching more than 60 m. Second, in the Hejin-Hancheng area, the thickness can reach 40–50 m. At the same time, there are some local thick areas of mud shale in the middle area, such as Xingxian and Wubu, but the distribution range is small and the thickness is not stable.

Lithological characteristics of the Shanxi and Taiyuan Formation in the N-S direction.

Contour map of the cumulative thickness of mud shale in Shanxi Formation (a) and Taiyuan Formation (b).
The buried depth of mud shale is an important parameter for the evaluation of shale gas resources development. Currently, the development depth of the shale, obtained commercial gas production, is generally less than 3000 m in the United States. The buried depth of the five major gas-bearing shale systems developed on a commercial scale is 183–2591 m. The depth of the core shale gas development area in Canada is generally 122–5000 m. Considering the preliminary exploration of shale gas and the technical difficulty of development in China, it is advisable to place the burial depth of shale gas in the favorable accumulation area of 1000–3000 m. The burial depth of mud shale in Shanxi Formation is mainly between 200 and 1400 m (Figure 7(a)), showing shallow in the east and deep in the west, which is consistent with its thickness variation trend, that is, the deep buried area of mud shale corresponds to its thick area. The buried depth contours of mud shale along the edge of the Ordos Basin shows a north–south distribution and gradually becomes shallow from west to east. In the Linxian-Jiaxian area and Danning-Xixian-Shilou area, the buried depth is relatively large, up to over 2000 m. The buried depth of mud shale in Taiyuan Formation is generally between 400 and 1600 m (Figure 7(b)), distributed similarly to that of Shanxi Formation. In general, the buried depth of mud shale is within the favorable range for commercial development of shale gas.

Contour map of the buried depth of mud shale in Shanxi Formation (a) and Taiyuan Formation (b).
Petrological characteristics
Mineral composition
The minerals of mud shale are classified as clay minerals, terrigenous clastic minerals, and autogenous non-clay minerals (mainly carbonate minerals, followed by sulfate minerals, etc.) and pyrite. The results show that the clay mineral content of mud shale is high in the study area, which is the main mineral composition. The clay mineral content is more than 50% in all samples and mainly ranges between 60% and 70%, with a maximum of 95.4%, a minimum of 51.5%, and an average of 64.88% (Table 3). Clay minerals are considered disadvantageous for hydraulic fracturing, since they more likely to swell after water imbibition and block the pore throat (Chen et al., 2011; Ross and Bustin, 2008; Wu et al., 2014). The secondary minerals of mud shale in the study area are terrigenous clastic minerals, mainly quartz, and some samples contain a small amount of potash feldspar or plagioclase. The content of terrigenous clastic mineral is mainly between 20% and 30%, with a maximum of 44.5%, a minimum of 23.2%, and an average of 31% (Table 4). The content of carbonate minerals (mainly including calcite, dolomite, and siderite) is relatively low in the mud shale samples, only appearing in four samples, and mostly appearing in the samples of Taiyuan Formation, which may be related to its sedimentary environment. Pyrite is found in almost all the mud shale samples, with a minimum content of 0.2%, a maximum of 6.8%, and an average of 2.47%. Since pyrite is the product of the low-energy reductive environment, it indicates that the sedimentary environment of the mud shale has strong reducibility.
Mineral composition of the mud shale of Shanxi and Taiyuan Formation in eastern Ordos Basin.

Specific mineral composition of the mud shale of Shanxi and Taiyuan Formation in eastern Ordos Basin.

In general, the mineral composition of mud shale in the study area is mainly clay minerals and quartz, and the clay mineral content is fairly high (Table 4). Brittle minerals are considered favorable for the development of natural fractures and artificially induced fractures formed through later hydraulic fracturing (Bowker, 2003, 2007; Wang et al., 2013). However, the content of brittle minerals such as quartz are too low (with a minimum of 4.4%, a maximum of 44.5%, and an average of 30.34%), which is not conducive to the future reservoir fracturing. Whereas, as mentioned above, clay minerals have positive effects on mud shale reservoir, including enhancing the adsorption of organic matter, the adsorption and storage capacity of natural gas, and the catalytic effect on the hydrocarbon generation process of mud shale. Therefore, to some extent, they may make up for the defects in the reservoir fracturing.
Clay minerals
Compared with brittle minerals, clay minerals affect the exploration and development of shale gas from many aspects, and their types and contents determine the properties of mud shale. Lu et al. (1995) believe that when the organic carbon content of mud shale is low, the adsorption capacity of smectite for shale gas is the strongest, illite is the weakest, and kaolinite and chlorite are among them. In the process of reservoir fracturing, different clay minerals are bound to cause different types of reservoir sensitivity. Among them, the illite/smectite formation and illite are easy to swell during water imbibition, which leads to plugging the pore throat and the decrease of reservoir permeability. Although kaolinite and chlorite are non-swelling minerals, the migration of their particle will also lead to plugging the pore throat and the decrease of reservoir permeability. The swelling capacity of various clay minerals is in the following order: smectite > illite/smectite formation > illite > kaolinite (Li et al., 2012).
In the eastern margin of the Ordos Basin, kaolinite is the main clay mineral of mud shale, and the content of kaolinite ranges from 29% to 100%, with an average of 59.23%, and then illite and illite/smectite formation (Figure 8). The content of chlorite is fairly low, which only appears in two samples. As kaolinite is prone to dispersion, migration, and not easy to swelling during water imbibition, during the hydraulic fracturing process, the pressure should be controlled reasonably to prevent the kaolinite deformation, breakage, and migration, leading to plugging pore throat and decreasing permeability. Second, illite and illite/smectite formation are easy to swelling due to water imbibition; therefore, some areas with high content of illite and illite/smectite formation should pay attention to the damage of reservoir water sensitivity (Ji et al., 2012; Yang and Aplin, 2010).

Clay minerals composition of the mud shale of Shanxi and Taiyuan Formation.
Organic geochemical characteristics
Rich organic matter of shale is the material basis of shale gas generation and accumulation. Since the TOC affects the hydrocarbon generation and gas content of mud shale, it is a common evaluation index of organic matter abundance (Nie and Zhang, 2012; Tan et al., 2014). In addition, gas can be adsorbed on the pore surface of the organic matter or kerogen of shale, so the gas content of shale is positively correlated with the TOC content. The exploration experience of shale gas in North America indicates that it is appropriate to set the lower limit of TOC of shale gas reservoir suitable to be developed at 2.0% (Chen et al., 2011; Han et al., 2013; Nie and Zhang, 2012; Tan et al., 2014). The TOC content is quite high, reaching the value of 30.8%, with a minimum of 0.14% and an average of 4.37%, which is far above the lower TOC limit of shale gas development (Table 5). The TOC of mud shale of Shanxi Formation ranges from 0.14% to 26.86%, with an average of 4.38%, which is similar to that of Taiyuan Formation (0.26%–30.8%).
Organic characteristics of the mud shale of Shanxi and Taiyuan Formation in eastern Ordos Basin.

TOC: total organic carbon.
If the material base of rich organic matter in mud shale is satisfied, a large amount of hydrocarbon can be generated under the condition of the organic matter reaching the necessary thermal maturity, which is another important evaluation index of organic geochemical characteristics of mud shale and the basic condition for shale gas generation (Jarvie et al., 2007; Kotarba et al., 2009; Pollastro, 2007). The vitrinite reflectance (Ro) of mud shale ranges from 0.23% to 2.49%, which indicates the organic matter of mud shale at mature stage. In the study area, the Ro contours of mud shale distribute along north and south direction and the Ro value increases from east to west, ranging from 1.0% to 3.0% in most regions, which reach the mature stage and over-mature stage and basically meeting the requirements of shale gas evaluation on the maturity of organic matter, so it is conducive to the generation of shale gas. Among them, the maturity of mud shale in the north of Fugu-Baode is relatively low, less than 0.6%, which is at the immature-low mature stage. In the region between Fugu, Baode, Wubu, and Xixian, the Ro is generally between 0.6% and 2.0%, at the mature stage. In contrast, the Ro in the vast area west of Wubu and Xixian is between 2.0% and 3.0%, at the over-mature stage (Figure 9).

Contour map of the thermal maturity (Ro) of the Upper Palaeozoic mud Shale in eastern Ordos Basin.
The regularity of thermal maturity indicates that it is influenced by the burial depth and magmatic intrusion. First, the maturity distribution of mud shale is consistent with the burial depth, i.e., the larger the burial depth, the higher the maturity, increasing from east to west and spreading along north and south, which is corresponding to the view of Dow (1977) about the correlation between burial depth and thermal maturity. Second, in the area between Xingxian and Linxian, the maturity of mud shale is fairly high compared with its surrounding areas, resulting from the magmatic intrusion of Zijin Mountain. According to the development experience of shale gas reservoirs with commercial value in North America, it is generally accepted that the lower limit of organic matter maturity is set at 1.1%; however, the upper limit varies widely due to the differences in genetic types as well as organic matter content and types, and there is no clear and unified limit. Therefore, the maturity organic matter of mud shale in the study area basically meets the needs of shale gas exploration and development.
The kerogen types can be used to measure the hydrocarbon generation capacity of organic matter. Different types of organic matter determine the hydrocarbon generation potential of mud shale and also determine whether the hydrocarbon generated of source rocks is dominated by oil or gas (Ganz and Kalkreuth, 1987; Gai et al., 2018). The organic matter of source rocks can be classified into three types using the ratio of S2 and S3, i.e., type I (S2/S3 > 20), type II (2.5 < S2/S3 < 20), and type III (S2/S3 < 2.5), and the type II can be divided into II1 (5 < S2/S3 < 20) and II2 (2.5 < S2/S3 < 5). In general, the hydrocarbon generated of the organic matter of type I and II is mainly oil during the thermal evolution process, whereas the organic matter of type III tends to generate gas. However, if the maturity reaches a very high stage, all the three types organic matter will change into gas generation. In addition, the main hydrocarbon generation periods of different organic matter types are corresponding to different maturity, type I (1.2% < Ro < 2.3%), type II (1.1% < Ro < 2.6%), and type III (0.7% < Ro < 2.0%). In the mud shale of the study area, although all the three types can be found, it is dominated by type II and III, with a total proportion of 89.29%, and varies in different strata, affected by different sedimentary environment (Table 5). Among them, in Shanxi Formation, the proportions of type II and III are 53.85% and 38.46%, and that in Taiyuan Formation are 50% and 39.29%, respectively. Combined with the organic matter maturity of the mud shale, it can be concluded that the most of mud shale in this area is at the main gas generation stage. Therefore, the mud shale in the study area is able to satisfy the basic organic geochemical conditions for shale gas generation and accumulation.
Pore characteristics
Genetic types of pores
The genetic types of pores in mud shale are usually classified into intragranular pore, intergranular pore, intercrystalline pore, organic pore, secondary dissolution pore, moldic pore, and so on (Qian et al., 2016; Zhang et al., 2015b). In the mud shale samples, the following five genetic types of pores are observed through the experiment of scanning electron microscope (SEM). Intergranular pores mainly refer to the pores between clay minerals (Figure 10(a)), and the pores between clay mineral aggregates, cementitious crystals, and lithic particles (Figure 10(b)), which can form a connected system with the maximum pore size of micron. As mentioned above, clay minerals dominate the mineral component of mud shale in this area, which leads to intergranular pores widely developed. Since pyrite is widely developed in the mud shale and most of it appears as strawberry aggregates, which consist of submicron pyrite crystal or microcrystal with the same particle size, there are a large number of pores with smooth pore edges, certain connectivity with each other and the pore diameter of 50–1000 nm, between the strawberry pyrite aggregates and crystals closely arranged (Figure 10(c)). Moldic pores are formed after mineral crystals fall off due to fluid impact or dissolution during the formation of mud shale. In the mud shale of this area, the size of most mineral moldic pores ranges from 50 to 1000 nm, which are mostly formed by pyrite and often accompanied by pyrite intercrystalline pores (Figure 10(d)). The secondary dissolution pores are formed when the soluble minerals in mud shale are dissolved, such as feldspar and carbonate minerals, which can be divided into intragranular dissolution pores and intergranular dissolution pores. The intragranular dissolution pores are developed inside the particles in a large number, mostly in the shape of estuary, honeycomb or dispersed with small pore sizes, generally between 50 nm and 2000 nm, and poor connectivity. The pore size of intergranular dissolution pores is relatively large, which have been observed in few mud shale samples of this area (Figure 10(e)). In the process of organic matter pyrolysis and hydrocarbon generation, the organic pores will be formed, which are greatly affected by the content and maturity of organic matter. In this area, there are a large number of organic pores in the mud shale, mainly distributed in the form of dispersal, strip, line, and honeycomb and so on. Single organic pore mainly presents in circular shape, with smooth edges, clear outlines, and good connectivity with each other. The pore size of most of these pores ranges from 10 to 500 nm, except for some reaching the micron level or higher (Figure 10(f)).

Pore genetic types of mud Shale in eastern Ordos Basin: (a) intergranular pores between clay minerals; (b) intergranular pores between clay mineral aggregates, cementitious crystals and lithic particles; (c) intercrystalline pores between the strawberry pyrite aggregates and crystals; (d) moldic pores formed by pyrites and often accompanied by pyrite intercrystalline pores; (e) secondary dissolution pores formed when the soluble minerals in mud shale are dissolved; and (f) organic pores distributed in the form of dispersal, strip, line and honeycomb.
Porosity and permeability
Mud shale belongs to unconventional oil and gas reservoir with low porosity and permeability. The porosity of the mud shale in coal-bearing strata ranges from 1.05% to 1.59% and the permeability is between 1 and 142 × 10−6 μm2, generally ranging from 1 to 10 × 10−6 μm2 (Figure 11). There is a positive correlation between the porosity and permeability of the mud shale in stages. When the porosity is less than 1.2%, the permeability is generally low, and the relationship between porosity and permeability is not obvious. When the porosity reaches above 1.3%, there is a positive correlation between the permeability and porosity, and within this porosity interval, the permeability of shale samples from the Shanxi Formation is better than that of the Taiyuan Formation. Therefore, the permeability of shale reservoirs is affected not only by porosity but also by pore structure, even more importantly.

Correlation between porosity and permeability of the mud shale of Shanxi and Taiyuan Formation in eastern Ordos Basin.
Pore structure
Shale gases are generally accumulated and stored in mud shale reservoirs in adsorption state and free state, i.e., adsorbed in the pore surface of mud shale matrix and filling in the fissures of mud shale. The pore structure of shale reservoir is very important for gas adsorption, such as the number of pores, pore size, pore surface, and shape. The results of low-temperature liquid nitrogen adsorption experiments on mud shale samples in the study area showed that the BET surface area ranges from 3.02 to 19.80 m2/g, and the BJH pore volume was between 0.0081 and 0.0390 cm3/g, with the average pore diameter from 6.63 to 21.54 nm (Table 6). In general, BET surface area and BJH pore volume of the mud shale samples in Taiyuan Formation are larger than those in Shanxi Formation, while the average pore diameter of the former is smaller. However, DR and DA models are more accurate for the analysis of micropores structure, whose calculation results show that the surface area of micropores ranges from 8.78 to 24.56 m2/g and the pore volume ranges from 0.0065 to 0.0119 cm3/g. It is found that the pores of mud shale are mainly composed of micropores and mesopores, with a volume proportion of 19.26%–49.68% and 46.10%–77.95%, respectively. The proportion of macropores is very low, generally less than 5%. In terms of pore size distribution, the situation of shale in Shanxi Formation is similar to that in Taiyuan Formation, with no obvious difference (Table 6, Figure 12). The adsorption capacity of mud shale is largely reflected by the specific surface area, since the gas in adsorption state takes up a large proportion of shale gas. In terms of surface area of pores, the micropores contribute the most and occupy the dominant position, accounting for 31.70% to 85.90% (Figure 13), followed by the mesopores, with a proportion of 12.86%–60.72%, and the contribution of macropores to surface area is lower than 10%.
Pore characteristics of mud shale samples based on low-temperature nitrogen adsorption.

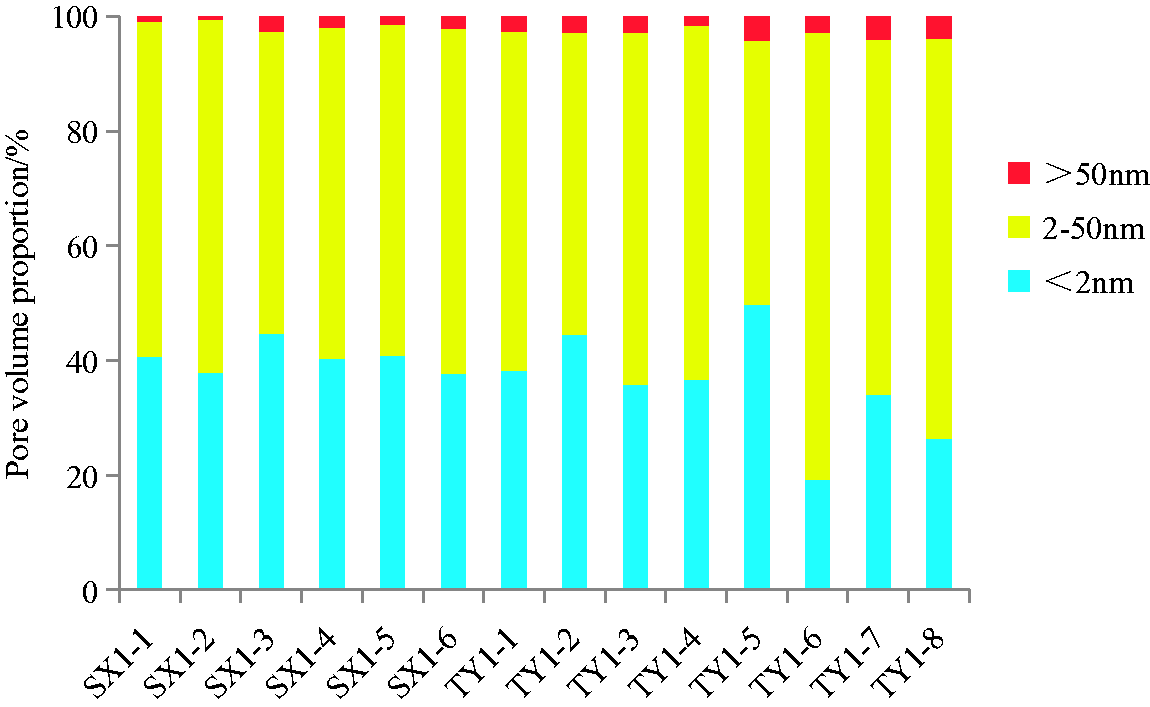
Volume contribution of different size pores of the mud shale samples from Shanxi and Taiyuan Formation.

Specific surface contribution of different size pores of the mud shale samples from Shanxi and Taiyuan Formation.
The characteristics of pore shape and structure can be analyzed from the adsorption and desorption curves of low-temperature liquid nitrogen adsorption experiment. According to the IUPAC classification (Gregg, 1982), the adsorption and desorption curves are divided into six types (type I, II, III, IV, V, and VI) and the hysteresis loop generally appear in type IV (De Boer and Lippens, 1964; Sing et al., 1985). For further study, type IV can be divided into four subclasses in detail to represent different pore shape, i.e., regular shaped pores with uniform size, ink-bottle shaped pores, heterogeneous funnel or slit shaped pores, and homogeneous slit shaped pores. All the N2 adsorption–desorption curves of the mud shale samples have hysteresis loops, belonging to type IV and indicating the appearance of capillary condensation. The N2 adsorption–desorption curves of the mud shale samples can be divided into two significantly different types. The desorption curves of one type have obvious inflection points (Figure 14(d) to (n)) and the other type have no obvious inflection points (Figure 14(a) to (c)). The adsorption–desorption curves shows the hysteresis loops appear in the relative pressure (P/P0) range of 0.45–1.0, and the inflection points exist on the branch of desorption curve at a P/P0 range of 0.4–0.5, indicating the pore system of mud shale samples relatively complex. For example, the pores of sample SX-1, SX-2, and SX-3 are mainly homogeneous slit shaped pores and the others are mainly heterogeneous funnel or slit shaped pores.

Low-temperature liquid nitrogen adsorption–desorption curves of the mud shale samples (a) to (c) The desorption curves have no obvious inflection points, showing homogeneous slit shaped pores; (d) to (n) The desorption curves have obvious inflection points, showing heterogeneous funnel or slit shaped pores.
Micro-fissures
A large number of micro-fissures developed in mud shale are important channels for gas migration and seepage. Micro-fissures have a dual impact on shale gas reservoirs: on one hand, micro-fissures development is conducive to improving the permeability of mud shale, but on the other hand, the large-scale micro-fissures development will lead to the escape of shale gas, negative for gas preservation. Micro-fissures are mainly developed between the crystals of brittle minerals, within the crystals, and between clay minerals particles. In the study area, the skeleton minerals and clay minerals of the mud shale contain a large number of micro-fissures, which are often developed between and in the crystals; moreover, micro-fissures also are developed in organic matter, which are in the bending shape of obvious sawtooth with good extensibility. The width of micro-fissures is generally in dozens to hundreds of nanometers, approximately equivalent to pore size of macropores in the mud shale (Figure 15).

Characteristics of micro-fissures in mud shale through SEM: (a) micro-fissures developed within the brittle mineral crystals; (b) micro-fissures developed between mineral crystals and organic matter; (c) micro-fissures developed between mineral crystals; (d) micro-fissures filled with pyrites.
Controlling factors of pore development
The pore development of mud shale is controlled by a variety of factors, including the TOC content, maturity and types of organic matter, types and content of minerals, etc. In addition, some soluble organic matters such as asphalt and oil generated by organic matter in the thermal evolution process can block some pores of mud shale reservoir.
TOC and maturity
The TOC of mud shale is not only an important parameter to indicate the hydrocarbon generation capacity of mud shale but also an important control factor for pore development of mud shale reservoir, because oil and gas generated by thermal evolution of organic matter will generate a large number of pores through the hydrocarbon migration and expulsion. The hydrocarbon generation process of organic matter in mud shale was simulated through experiments, indicating that the pores of mud shale increased after the hydrocarbon generation of organic matter, and the higher the content of organic matter, the larger the increase range of pores (Jarvie et al., 2007). Through the correlation analysis between the pore volume and TOC content of the mud shale samples in the study area, the results show that the BET specific surface area and the BJH pore volume of the shale decrease with the increase of TOC content (Figure 16). It can be speculated a part of the pores maybe blocked by the residual hydrocarbon generated in the thermal evolution process of organic matter, leading to the decrease of effective pores. In addition, the residual hydrocarbon tends to block small pores and throats, resulting in the relative increase of the large pore in the effective pores. Therefore, the average pore diameter of effective pores increases with the increase of the TOC content. The organic matter maturity can reflect the degree of thermal evolution of the shale, which is also an important factor influencing the pore development. On one hand, large amounts of organic pores can be generated through hydrocarbon generation and expulsion in the process of organic matter thermal evolution; on the other hand, the residual hydrocarbon may also block some pores. The composite results of the two kinds of effect on pore development mainly depend on the organic matter maturity and the thermal evolution stage.

Relationship between total organic carbon content, maturity, and pores of the mud shale samples.
The correlation analysis between the pore development of mud shale and the maturity of organic matter in the study area shows that the maturity of organic matter has a phased effect on the development of pores. When the vitrinite reflectance (Ro) of mud shale is less than 1.3%, the residual macromolecular hydrocarbon generated by the organic matter is easy to block the smaller pores, which leads to the decrease of the specific surface area and total pore volume of mud shale (Liu et al., 2015; Pan et al., 2015; Wei et al., 2014), the increase of the relative proportion of larger pores in the effective pores, and the increase of the average pore diameter. However, if the Ro is larger than 1.3%, the pores generated by organic matter increase with the enhancement of thermal evolution. Meanwhile, the residual macromolecular hydrocarbon blocking in some small pores would be gradually pyrolyzed into small molecular light oil and gas discharged from the pores, which leads to the increase of the specific surface area and total pore volume of mud shale accordingly (Figure 16). The higher the maturity of organic matter, the more thoroughly the transformation be carried out. Hence, more small pores blocked will be converted into effective pores, and more organic pores will be generated, mainly micropores and mesopores, resulting in the decrease of average pore diameter.
2. Inorganic minerals
The inorganic mineral composition of mud the mud shale in the study area is dominated by clay minerals, with a content of 47.8%–75.3%, followed by quartz, with a content of 17.8%–40.7%. Due to the particularity of crystal structure, clay minerals can form intergranular pores and intragranular pores, the characteristics of which have been described above. At present, studies have shown that clay minerals in mud shale usually have the characteristics of large specific surface area and relatively development of smaller pores. Therefore, clay minerals are of great significance for increasing the micro pores and adsorption capacity of mud shale. The correlation analysis between the pore characteristics and clay minerals content in the study area show that, with the increase of clay minerals content, the BET specific surface area and BJH total volume of pores in the mud shale increase quickly, leading to the enhancement of adsorption capacity and the decrease of average pore diameter (Figure 17), which are consistent with other scholars’ research.

Relationship between quartz, clay minerals, and pores of the mud shale samples.
Quartz belongs to brittle mineral, which is easy to be dissolved in the process of hydrocarbon generation in the thermal evolution of organic matter, forming pores and micro-fissures, and improving the permeability of mud shale to a certain extent. The specific surface area and total volume of pores in the study area decrease and the average pore diameter increases with the increase of the content of quartz (Figure 17). Therefore, the addition of quartz content did not enhance the adsorption capacity of mud shale. On the contrary, since the inorganic minerals in the mud shale samples are mainly composed of clay minerals and quartz, the increase of quartz content means the relatively decrease of clay minerals content, while the latter contributes more to the specific surface area and total volume of pores in mud shale. The results of SEM also show that quartz is more beneficial to the development of larger pores and micro-fissures, leading to the average pore diameter increase with the quartz content increasing (Figure 17). Although these pores, developed in quartz, contribute little to the adsorption capacity of mud shale, they are of great significance for improving the permeability of mud shale reservoir and reservoir reformation.
Gas resource evaluation
Resources estimation
According to the results of isothermal adsorption experiments of mud shale samples, the adsorption gas content was calculated (Table 7). As shale is a heterogeneous and porous media with complex pore-fractures system, free gas and adsorbed gas usually coexist in the shale reservoirs, which makes the accumulation and migration mechanism of shale gas more complex (Guo et al., 2018b; Jiang et al., 2017; Xi et al., 2018). Generally speaking, the initial gas production of shale gas wells is controlled by the free gas and the later gas production is influenced by adsorbed gas (Labani et al., 2013; Wang et al., 2013). The adsorption gas content in the mud shale of study area ranges from 0.213 to 1.956 m3/t, with an average of 0.669 m3/t, which can be used to estimate the adsorption gas content with formation pressure. The formation temperature ranges from 307.15 K to 347.15 K, with an average of 327.15 K, and the adsorption gas content decreases by approximately 30% (Liu et al., 2013). Considering the effect of temperature on gas adsorption, the actual adsorption gas content of the mud shale is determined to 0.468 m3/t. In addition, the average free gas content of mud shale in the study area is approximately 0.56 m3/t (Liu et al., 2013). Therefore, the total gas content of mud shale is 1.028 m3/t in the eastern margin of the Ordos Basin. Combined with the basic geological conditions of the study area, the lower limits for shale gas resources calculation are the TOC ( > 2%), maturity (Ro > 1.0%), thickness ( > 35 m), and buried depth (1000–3000). The effective area of mud shale is 12,506 km2, the density is determined to be about 2.5 t/m3, and then the calculation value of the total gas resources of the mud shale in the study area is 2.49 × 10¹² m3 (Figure 18).
Isothermal adsorption parameters of the mud shale samples from Shanxi and Taiyuan Formation and calculation results of their adsorption gas contents under the reservoir pressure in the study area (temperature 303.15 K).


Shale gas resources evaluation and favorable zone optimization map of the mud shale in Shanxi and Taiyuan Formation in the eastern margin of the Ordos Basin.
Resources potential
Some Chinese scholars put forward the basic geological conditions suitable for shale gas industrial exploitation combining with the shale gas geological conditions (marine-continental transitional shales) and existing technologies in China, by comparing the exploration and development of shale gas in North America (Table 8) (Zhou et al., 2011). Based on the contrastive analysis of the evaluation standards and the geological conditions of the mud shale in the study area, it is found that the thickness, permeability, TOC, thermal maturity, and gas content of the mud shales are higher than the lower limits of the evaluation standard. However, the porosity and the content of brittle minerals and clay minerals are not achieved the requirements. As well known, lower content brittle minerals are not conducive to the later fracturing reform of mud shale reservoir. It should be pointed out that, though clay minerals have negative effects on reservoir fracturing, they have some positive effects, such as enhancing adsorption capacity, which makes up for their negative effects on reservoir reformation to some extent.
Favorable zone evaluation and optimization indexes of shale gas exploration and development in China and North America.

According to accumulation mechanism, enrichment and preservation conditions of shale gas, and considering the organic matter content and types, thermal maturity, effective thickness and buried depth of the shale, two favorable potential areas for shale gas exploration and development are optimized, which are Shilou-Daning area and Linxian-Xingxian area (Figure 18). The former is located in the west of Lishi fault zone and north of Xiangning fold belt and the area is 4224 km2, with cumulative thickness above 85 m, buried depth of 1000–2400 m, thermal maturity of above 2.0% and high TOC of mud shale, belonging to overmature stage. Influenced by the Himalayan movement, a series of small scale NNE-NE folds are developed and the micro-fissures in mud shale are also developed. The other area is located in west of Lishi-Zijin fault zone and its area is 2579 km2, with cumulative thickness above 85 m, buried depth of 1000–2000 m, thermal maturity of above 1.0% and high TOC of mud shale, belonging to medium-over mature stage. Influenced by the fault, the micro-fissures of mud shale are developed.
Conclusions
In the eastern margin of the Ordos Basin, the thickness of single mud shale layer in coal-bearing strata is relatively small (averaging 3.74 m); however, the cumulative thickness of mud shale is very large (averaging 77.6 m). The mud shale of Shanxi Formation is distributed more stably in the whole area than that of Taiyuan Formation. The buried depth of mud shale varies between 200 and 2400 m, showing the characteristics of shallow in the east and deep in the west. In terms of gas generation, the mud shales have advantages in organic conditions, such as high TOC (0.14%-30.8%), relatively high thermal maturity (mainly 0.6%-2.0%), and favorable kerogen type (II and III). However, the mineral composition of the shales has some disadvantages for gas development. The content of clay minerals, dominated by kaolinite, is very high, averaging 64.88%, and the content of brittle minerals, such as quartz, is relatively low, with an average of 30.34%. The pores and micro-fissures are relatively developed in the mud shale, with porosity of 1.05%–1.59% and permeability of 0.001–0.142 (×10−3 µm2), which are dominated by intergranular pores and organic pores and micro-fissures developed between brittle mineral crystals. The specific surface area of pores is 12.31–28.99 m2/g and the pore volume is 0.0146–0.0483 cm3/g. Mesopores and micropores (mainly slit shaped pores) provide the main pore volume of mud shale, and micropores contribute most of the specific surface area. In the lower maturity stage, the effective pores decrease and the average pore size increases, with the thermal maturity and TOC increasing, due to some of the smaller pores blocked by the generated residual hydrocarbon. However, the residual hydrocarbon will crack when the maturity enhances, resulting in effective pores increasing with the TOC and Ro increasing. A large number of micropores and mesopores can be formed inside clay minerals that are conducive to increasing the storage space, while quartz minerals are conducive to forming larger pores and fissures, improving the permeability of mud shale. In a word, the mud shale of coal-bearing strata is widely distributed in the study area, with large cumulative thickness, moderate buried depth, relatively developed pore and fissure systems, and good organic geochemical conditions. However, the lower content of brittle minerals and the higher content of clay minerals may have some negative effect on the later fracturing reformation of reservoir. The total amount of shale gas resources of the mud shale is 2.49 × 10¹² m3 and it is suggested that the Linxian-Xingxian area and Shilou-Daning area are potential favorable areas for shale gas exploration and development.