
Abstract
Introduction
Coalbed gas (also named coalbed methane) and shale gas, storing at the coal and shale reservoirs with low porosity and low permeability in the coal measures, belong to the gas types of unconventional natural gas (Li et al., 2019a; Tan et al., 2019; Wang et al., 2018). Both gases can be commingled and produced from a well by perforating the reservoirs at different depth. Gas commingling can improve the profitability of exploration and exploitation; it can also enhance the drainage efficiency and gas production output of a single well (Li et al., 2019b; Wang et al., 2018). The investigation of the pore structure characteristics of a mixed coal and shale reservoirs is one of the vital research areas in better evaluating the reservoir characteristics and gas content, to inform on the potential for commingling of both gases at the coal measures.
Previous research has proved that it is useful to study the pore structure of coal and shale with direct imaging techniques, radiation detection techniques, and fluid invasion methods. Direct imaging techniques contain focused ion beam scanning electron microscopy and field emission scanning electron microscopy/transmission electron microscopy (Zhou et al., 2019; Zhu et al., 2017). Radiation detection techniques contain small angle and ultra-small angle neutron scattering, small-angle X-ray scatting, and nuclear magnetic resonance (Cai et al., 2013; Liu et al., 2019; Zhao et al., 2019). Fluid invasion methods contain high-pressure mercury intrusion porosimetry (MIP), low-pressure N2/CO2 gas adsorption, and helium pycnometry (Ghanizadeh et al., 2015; Li et al., 2019c; Yang et al., 2016; Zhang et al., 2017, 2018a). In them, MIP data can analyze the pore diameter ranges from dozens of nanometers to hundreds of micrometers. The pore diameters of 2–100 nm and less than 2 nm can be obtained from low-pressure N2 and CO2 physisorption data, respectively.
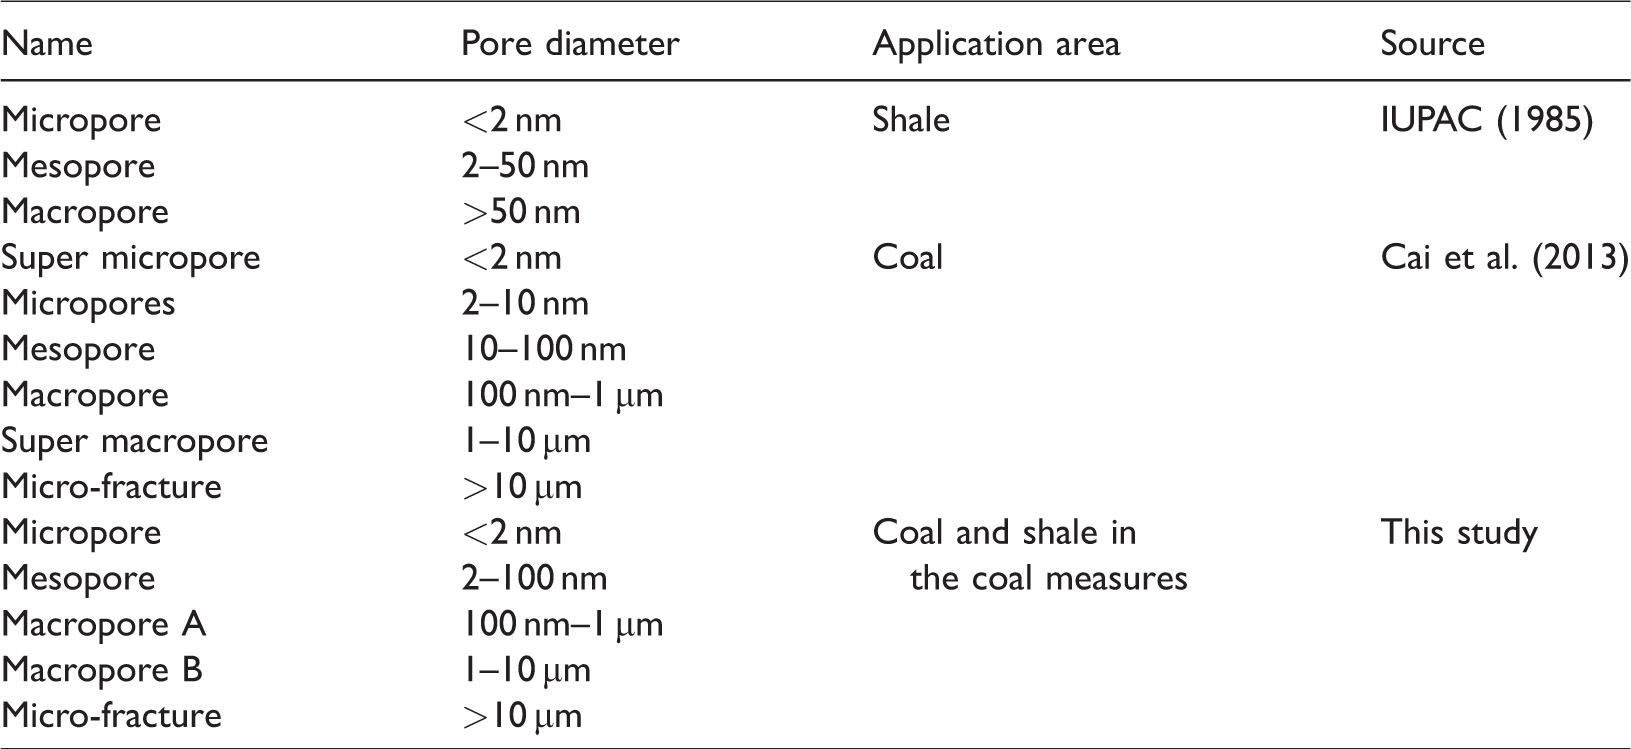
As for the shale pore size classification, there is a unified classification, according to the International Union of Pure and Applied Chemistry (IUPAC). Shale pore structures can be divided into micropores (<2 nm), mesopores (2–50 nm), and macropores (>50 nm). Regarding the more complex porous materials, there is no unified classification for the coal. Generally, coal pore size can be divided into adsorption pores and seepage pores. The former refer to pore diameters less than 100 nm; the latter are pore diameters more than 100 nm (Shi and Durucan, 2005; Yao et al., 2006). Adsorption pores can be further divided into micropores (<10 nm in diameter) and mesopores (10–100 nm in diameter) (Yao et al., 2008). There is also another classification of the coal pore structure. It is a combined classification from IUPAC (1985) and Hodot(1996) for coal pore size: super micropores (<2 nm), micropores (2–10 nm), mesopores (10–100 nm), macropores (100 nm–1 µm), super macropores (1–10 µm), and micro-fractures (>10 µm) (Cai et al., 2013). It is well known that the coal and shale stratum are thoroughly developed alternately in the coal measures at the Taiyuan and Shanxi Formations of the North China and the Longtan Formation of South China (Tang et al., 2016a; Xao et al., 2018). To better understand the effects of coal and shale pore structures on both gas adsorption capacity and flow capability, an integrated classification for the pore structure characterization of coal-bearing stratum is provided in this work and is based on the analysis of MIP and low-pressure N2/CO2 gas adsorption testing results.
The current study collected eight coal and six shale samples from the upper Permian Longtan Formation in the upper Yangtze Plate of South China. The main aims of this work are to (i) determine a suitable classification of pore size for coal and shale samples in the coal measures; (ii) investigate the pore structure distribution characteristics of coal and shale samples in the coal measures; and (iii) discuss the relationships between methane adsorption capacity and matrix parameters, as well as pore structure (i.e. pore volume (PV), special surface area (SSA), and pore size distribution (PSD)).
Samples and experimental methods
Geological setting
The South Sichuan coalfield, located in the southeast Sichuan basin of the upper Yangtze Plate, contains the Nanguang, Junlian, Furong, and Guxu mining areas. The Guxu mining area, tectonically within the Gulin–Junlian fold belt, is the field of study. The EW brachy-axis complex fold is the primary fold type in the study area (Zhu et al., 2010). Figure 1 shows the geographic position and tectonic distribution of the south Sichuan coalfield. Sinian is the oldest stratum exposed in this area, and, except scattered Neogene, Cretaceous is the youngest stratum. Lacking strata are from Cambrian to Silurian and Carboniferous. Containing more than 10 coal seams, the lower Permian Longtan Formation is the leading coal-bearing stratum in the Guxu mining area. However, there are only five to eight coal seams with a stable distribution that are valuable for exploration. So, our samples are collected from these stable strata.

Tectonic graph showing study area and sampling sites from the South Sichuan coalfield. Source: Modified from Zhu et al. (2010).
Samples
Six shales and eight coals are collected from drilling wells DC-4 and DC-5 at the Guxu mining area. The distance between the two wells is 4.8 km. Sampling site and depth are presented in Figures 1 and 2. A portion of gathered samples is packaged with silver paper and sealed into the closed bags for testing coal macerals, mineral composition, pore structure, and methane sorption capacity. Other partial samples are loaded into the CBM desorption canisters for measuring methane content (not part of the present study).

Stratigraphic columns of wells DC-4 (a) and DC-5 (b) at the South Sichuan coalfield.
Experimental approaches
In order to study the geological properties of coal and shale samples in coal-bearing strata, the following are implemented: (i) mineral composition by X-ray diffraction (XRD); (ii) maturity and total organic carbon (TOC) by Rock-Eval pyrolysis analysis; (iii) microstructure and pore system by MIP, low-pressure N2 and CO2 physisorption; and (iv) methane sorption capability by methane isothermal adsorption. All the 14 samples are used for most experiments, except for four samples (two coals and two shales) for CO2 physisorption.
MIP sample with particles of 5–20 mesh was dried at 100°C for 24 h in a vacuum oven to remove volatiles (Zeng et al., 2016). Mercury intrusion analysis is performed on vacuum dried samples using PoreMaster GT-60, according to the GB/T 21650.1-2008 standard (Xiong et al., 2015). The highest pressure of mercury intrusion is up to 29,000 psi (200 MPa), for primarily characterizing pores larger than 30 nm. Additional samples are crushed into grains of 60–80 mesh size for N2 and CO2 physisorption analysis using Micromeritics ASAP 2460 apparatus at the Beijing Center for Physical & Chemical Analysis. N2 adsorption data are collected at temperature 77.4 K and saturation pressure less than 768.3 mmHg. CO2 adsorption experiment is implemented at 273.0 K and saturation pressure at 26,142.0 mmHg. The crushed samples are dewatered at a temperature of 110°C for 5 h and then outgassed at a temperature of 110°C for 24 h. Multi-point Brunauer–Emmett–Teller (BET) and Barrett–Joyner–Halenda (BJH) models based on N2 adsorption data and density functional theory (DFT), Dubinin–Radushkevich, and Dubinin–Astakhov models based on CO2 adsorption data are used to calculate SSA, PV, and PSD, respectively (Javadzadeh et al., 2014; Song et al., 2017; Wang et al., 2015; Wei et al., 2016).
As supporting data for analyzing pore structure, the XRD and the TOC content are also examined. The XRD is performed with a Bruker D8 Advance diffractometer using Cu Kα radiation at a temperature of 24°C and humidity of 35%. The TOC data are measured with Rock-Eval-VI for pyrolysis analysis according to the GB/T 18602-2001 standard (Zhang et al., 2018b). The Rock-eval pyrolysis technique incorporates temperature-programmed heating of a small amount of sample in an inert atmosphere (helium) in order to determine the number of free hydrocarbons and hydrocarbon compounds present in the coal/shale (Mendhe et al., 2018). The TOC is actually a value that is calculated by adding the residual and pyrolyzed organic carbons. Furthermore, the methane isothermal adsorption experiment is carried out using a volumetric sorption apparatus (PCTPro Evo Setaram INC, Hillsborough, USA) on coal and by a gravimetric sorption apparatus (IsoSORP-HPII Static Rubotherm GmbH, Bochum, Germany) on shale. All experiments are performed at 30°C and conducted on an equilibrated moisture basis according to the GB/T 19560-2008 (Tang et al., 2016b). For each sample, 200 g of pulverized powder sample with particle size less than 60 mesh is used for the high-pressure methane sorption measurement. At each injection pressure, the excess adsorption amount can be estimated through the equation of state. Based on the excess experimental data, the absolute adsorption amounts are calculated according to the method of Sudibandriyo et al. (2003).
Results and analysis
Maturity, mineral composition, and TOC content
Previous research has demonstrated that maturity, mineral composition, and TOC content strongly affect the pore structure of the reservoir (Wang et al., 2014; Zhao et al., 2018). On the basis of XRD and Rock-Eval pyrolysis analysis, the mineral composition, maturity, and TOC content results are shown in Table 1. For the coal samples, the clay mineral composition is mainly mixed I/S. The principal clay mineral composition of shale samples is kaolinite. For the three coal samples from well DC-4, the maturity and TOC content means the content is 3.02% and 78.9 wt%. Brittle minerals mean content—including quartz and calcite—is 25.8 wt%. For the three shale samples from well DC-4, the mean contents of maturity, TOC, and brittle minerals are 2.91%, 8.3 wt%, and 50.9 wt%. For the five coal samples of well DC-5, the mean contents of maturity, TOC, and brittle minerals are 3.07%, 60.7 wt%, and 24.0 wt%. For the three shale samples of well DC-5, the mean contents of maturity, TOC, and brittle minerals are 3.09%, 4.6 wt%, and 34.5 wt%. Comparing the above results, it shows that the maturity of coal and shale samples in well DC-4 is lower than those of well DC-5; however, brittle minerals and TOC contents of coal and shale samples in well DC-4 are higher than those of well DC-5.
Basic properties and mineral composition of coal and shale samples in the Guxu mining area.

TOC: total organic carbon.
Pore structure characteristics and classification
According to the classification of IUPAC, porous materials are divided into micropore (<2 nm), mesopore (2–50 nm), macropore (>50 nm) by their pore diameters. According to the classification of Yao et al. (2008) and Cai et al. (2013), micropores of coal are divided into <10 and 2–10 nm in diameter. Mesopore of coal is divided uniformly into a pore diameter range of 10–100 nm. First, there is no unified classification standard of pore structure for the coal and shale. Second, the pore sizes of 2–100 nm are not developed in the coal and shale reservoirs. For clearly calculating the contribution of coal and shale samples on its PV, an integrated PSD is reset in Table 2. They are divided into micropore (<2 nm), mesopore (2–100 nm), macropore A (100 nm–1 µm), macropore B (1–10 µm), and micro-fracture (>10 µm). The nomenclature of macropore A and macropore B is for avoiding ambiguity with the general usage of macropore (>50 nm) and megapore (>7500 nm).
Pore structures classification from coal and shale samples in coal measures.
Quantitative analysis of the pore structure
In order to comprehensively describe the pore structure from micrometer scale to nanometer scale, MIP and low-pressure N2 and CO2 physisorption are carried out in this research. Macropore, mesopore, and micropore PV and specific surface area results are shown in Table 3.
Pore volume (PV) and specific surface area (SSA) based on IUPAC classification by MIP, N2/CO2 physisorption for coal and shale samples in the Guxu mining area.

BET: Brunauer–Emmett–Teller; BJH: Barrett–Joyner–Halenda; DFT: density functional theory; D–R: Dubinin–Radushkevich; MIP: mercury intrusion porosimetry; PSD: pore size distribution.
aPSD was the average pore diameter calculated from BJH desorption breath.
MIP results
MIP is capable and wildly used for calculating macropore pore characteristics of coals and shales (Okolo et al., 2015; Wang et al., 2016). The PSD and PV of coals and shales in the wells DC-4 and DC-5 are presented in Figures 3 and 4. They show an opposite PSD feature and a similar PV feature between coal and shale samples. The dominating PSDs of coal samples in wells C-4 and DC-5 range from 10 to 200 µm, followed with PSDs between 100 and 6000 nm, while PSDs in shale samples are dominated from 100 to 6000 nm, then from 6 to 200 µm (Figure 3). The PVs of coal samples in wells DC-4 and DC-5 are mainly contributed by micro-fracture (PSD with 10–100 µm). And shale PVs are provided primarily by macropore B and micro-fracture (PSD with 1–100 µm) (Figure 4).

Mercury intrusion data showing the PSD of macropores of coal and shale samples from the Guxu mining area.

Relationship between PSD and PV determined from MIP method.
N2 physisorption results
Both adsorption and desorption branches are usually recorded on the N2 physisorption experiment (Figure 5). The hysteresis loop is also observed in all shales, and partial coals (i.e. DC-4-C14-1, DC-5-C23-1, DC-5-C24-1, and DC-5-C25-1) and possibly results from capillary condensation in mesopores. According to the classification of IUPAC, the hysteresis patterns of all shale samples and coal samples (except for DC-5-C17-2 and DC-5-C24-1) fall into type H3 loop, which was aggregated by plate-like particles and given rise to slit-shaped pores (IUPAC, 1985). The hysteresis patterns of DC-5-C17-2 and DC-5-C24-1 samples remain nearly horizontal and parallel over a wide range of relative pressure (

N2 adsorption–desorption isotherms of coal and shale samples in the Guxu mining area.
The BJH model is the most suitable and widely used method for analyzing the PSD of mesopore materials (Mastalerz et al., 2018), although there are some problems existing: cannot calculate the pores width less than 2 nm and the tensile strength effect (TSE) phenomenon appears at a pore diameter of 3.8 nm (Groen et al., 2003). The PSDs of the eight coal and six shale samples are calculated according to the N2 adsorption branch and illustrated in Figure 6. In the dV(log(d)) plot which is (

PSD calculated by N2 adsorption branch for coal and shale samples in the Guxu mining area.
CO2 physisorption results
CO2 physisorption has been approved to be an effective method for characterizing micropores between 0.3 and 1.1/1.5 nm (Wang et al., 2015). Two coals and two shales are chosen for the target to investigate the microporous feature in this study. Figure 7 shows the low-pressure CO2 adsorption isotherms at 273 K for coal and shale samples. The CO2 absorbed volumes of coals and shales range from 18.4 to 27.9 cm3/g and from 4.2 to 8.1 cm3/g, respectively. It can be found that the two coal samples have higher adsorption capacity than two shale samples, suggesting that the microporosity is prevailing in coal samples.
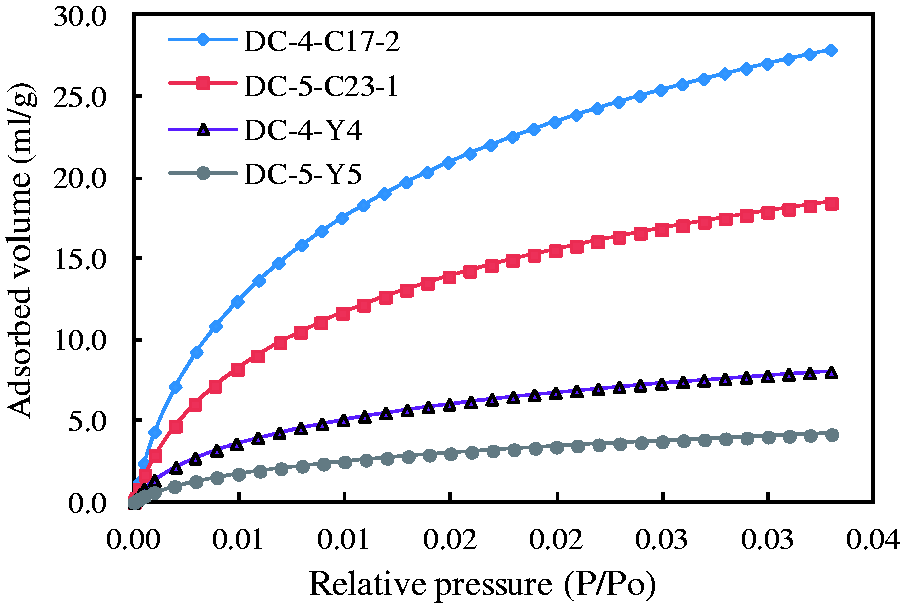
Low-pressure CO2 adsorption isotherms at 273 K for coal and shale samples.
The PSDs of micropore estimated by DFT model are presented in Figure 8. It can be found that the significant peak in the pore width ranges between 0.4 and 0.7 nm, and then is 0.7–0.9 nm. There is a sharp increase at more than 1.1 nm in pore width, implying a third peak appeared at pore width more than 1.1 nm after analyzed with N2 adsorption results in Figure 6.

PSDs obtained from the low-pressure CO2 adsorption isotherm.
Methane isothermal adsorption
In a simple gas–solid adsorption system, the observed adsorption quantity (also called excess adsorption quantity or Gibbs excess adsorption uptake) is not equal to the actual adsorbed amount (Chattoraj and Birdi, 1984; Gibbs, 1878). The excess adsorption quantity is connected with the densities of the adsorbed phase (ρa) and the bulk gas phase (ρg). At a relatively low-pressure stage (
Methane storage capacities of coal and shale samples are characterized by methane isothermal adsorption, and the results are shown in Figure 9. Coal methane isothermal adsorption curves are drawn according to the Langmuir adsorption model and shale methane isothermal adsorption curves are fitted based on adapted Langmuir function. Langmuir adsorption model is expressed as

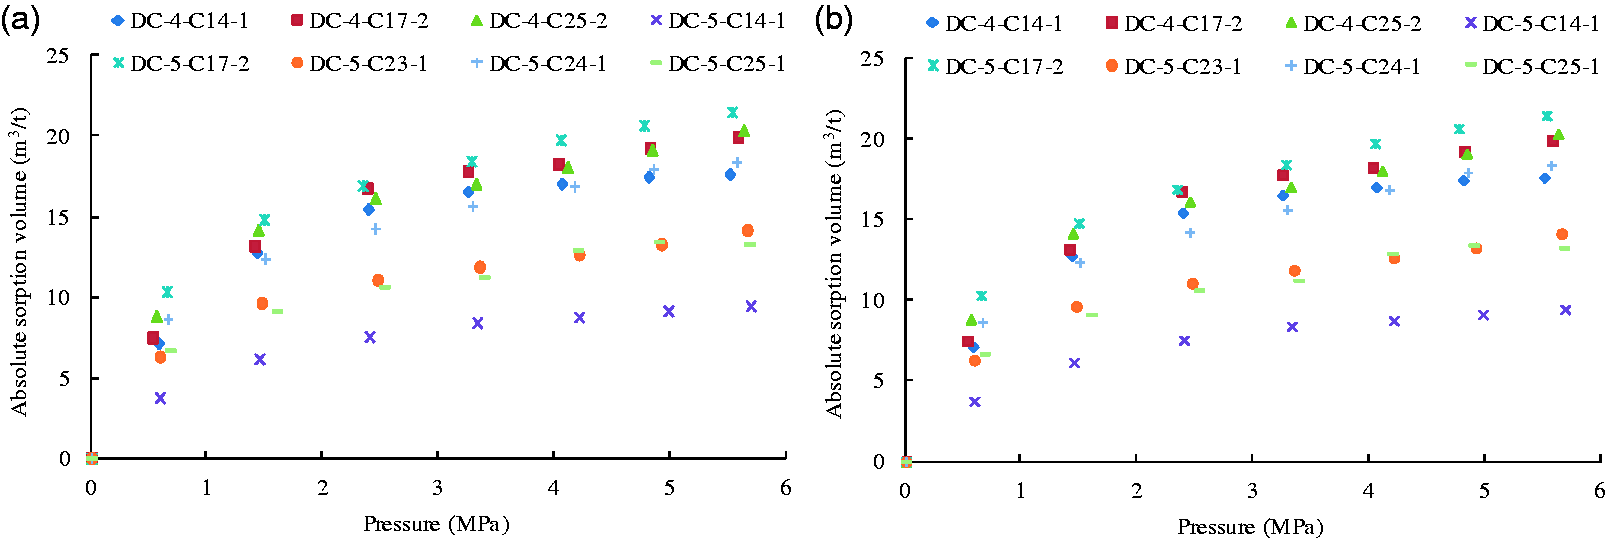
Methane adsorption isotherms for (a) eight coal samples and (b) six shale samples in the Guxu mining area.
The adapted Langmuir function by Gensterblum et al. (2009) and Gasparik et al. (2012) is described as

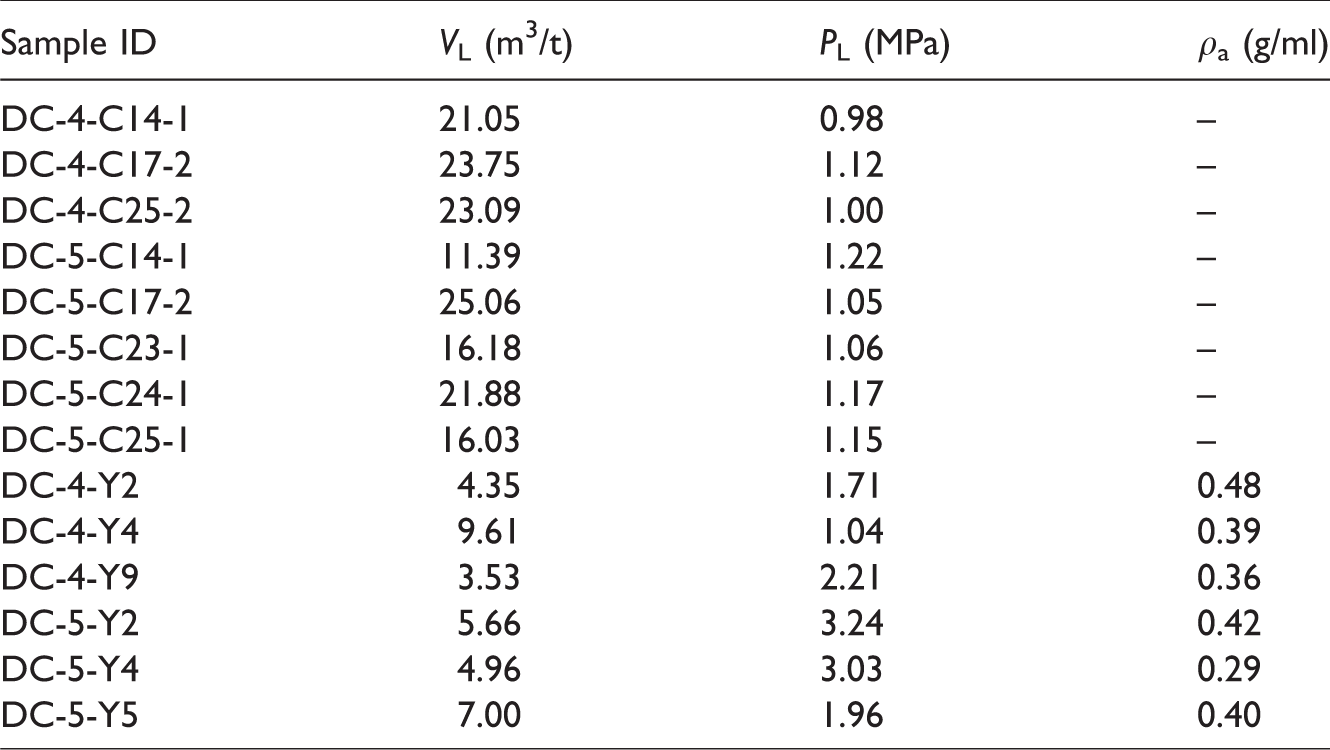
The Langmuir volume (
Methane isothermal adsorption results for coal and shale samples.
Fractal dimensions from low-pressure N2 adsorption isotherms
Fractal dimension is a quantitative tool to characterize the complexity of pore surface and pore structure, which vary between 2 and 3 (Cai et al., 2013). Langmuir, n-BET, Frenkel–Halsey–Hill (FHH), fractal analogue of Dubinin–Astakhov equation, and the thermodynamic methods have been used to calculate the fractal dimensions based on the gas adsorption isotherms (Cai et al., 2013; Fripiat et al., 1986; Gauden et al., 2001; Xu et al., 1997; Yin, 1991). Among them, the fractal FHH model was believed to be an effective and reliable method for the analysis of gas adsorption data (Wang et al., 2016; Yao et al., 2008). On the plot of ln

Plots of ln
The fractal dimension values (
Fractal dimensions derived from fractal FHH model.

FHH: Frenkel–Halsey–Hill.
aGroup A (exist hysteresis loop) and group B (reversible isotherm) are divided from N2 adsorption/desorption isotherms.
According to the N2 adsorption/desorption isotherms, all shale samples are divided into group A, which show the hysteresis loops in Figure 5. Coal samples are divided into groups A and B.
Three coal samples of group B are not found hysteresis loops in their N2 adsorption/desorption isotherms, suggesting mesopores and macropore A (100 nm–1 µm) are not developed in these coal samples. The adsorption and desorption phenomena are also inconspicuous at a low-pressure stage in these three coal samples. Therefore, it can be stated that the fractal dimensions calculated from limited N2 adsorption data are not suitable for the coal samples which are not developed in mesopore and macropore A. Maybe group B includes samples whose fractural dimensions could not be estimated in this paper; this statement needs to be verified by more samples. However, the previous study has also proved that the pore structure of coal or shale samples in group A is more complicated than that of group B (Liu et al., 2015).
Discussions
Comparison of pore structure from coal and shale
In this study, the pore structure was analyzed by mercury intrusion for the PSD of macropores A, B and micro-fractures (Figures 3 and 4), N2 physisorption for the PSD of mesopores (Figure 6), and CO2 physisorption for the PSD of micropore (Figure 8). In terms of mercury intrusion, N2 physisorption, and CO2 physisorption results, the specific surface area of coal and shale samples from Guxu mining area is primarily contributed from micropores, followed by mesopores (Figure 11(a)). The PV is main from micro-fracture and macropore B (Figure 11(b)). Therefore, micropores and mesopores will mainly control the gas adsorption while micro-fractures and macropore B are significant for free gas storage and flow. Micropores primarily contribute to the specific surface area of coal, while both micropores and mesopores are essential contributors to the specific surface area of shale. Also, the total PV of coal is mainly contributed by micro-fracture, while for shale samples, besides micro-fracture, macropore B has the same importance for the total PV.

Percentages of (a) the specific surface area under the IUPAC classification and (b) the total PV under this study classification of coal and shale samples.
Effect factors on the methane adsorption capacity
Previous researchers have proved that there were many factors, such as the mineral composition, organic matter type and maturity, moisture, and pore structure (PSD, SSA, and PV), influencing the gas storage state and adsorption capacity (Wang et al., 2014, 2015; Zhang et al., 2018a). In this study, we focus on the following factors, such as pore structure (PV and SSA), TOC, and clay mineral content.
The amount of gas adsorbed on the coal surface depends on the adsorption potential energy, which lies with the adsorbents and the pore size (Wang et al., 2014). As shown in Figure 12(a) and (b), the pore size notably influences the methane adsorption capacity. Especially micropores (<2 nm) and micro-fractures (>10 µm) have a positive contribution to the PV and the methane adsorption capacity, while mesopores (2–100 nm) and macropore B (1–10 µm) negatively contribute to the PV and the methane adsorption capacity (Figure 12(a) and (b)). Combining with the above analysis of PV and SSA percentage in different PSD, micropores contribute to the SSA and micro-fractures contribute to the PV of coal and shale samples. Adsorbed methane was mainly adsorbed on the surface of the matrix, which is closely related to the SSA concentration. Therefore, pore size strongly affects the methane adsorption capacity and the ratio of free to adsorbed gas. That is because the methane filling happens in micropores mainly in an adsorbed state, in micro-fracture in a free stage, and mesopores and macropore B in adsorbed and free stages. Micro-fracture frequency has no relationship with the methane adsorption capacity; it mainly depends on the width of micro-fracture.

The relationship between methane adsorption capacity and cumulative PV (a, b), as well as specific surface area (c, d), clay mineral compositions (e, f, and g), and TOC content (h) for coal and shale samples. TOC: total organic carbon.
A positive relationship presented between micropores SSA and the methane adsorption capacity and a negative relationship appeared between mesopores SSA and the methane adsorption capacity of the coal and shale samples (Figure 12(c)). The methane adsorption capacity is negatively correlated with the mixed I/S and illite concentrations and positively correlated with the kaolinite concentration of the coal and shale samples (Figure 12(e) to (g)). TOC content is also positively correlated with the methane adsorption capacity (Figure 12(h)). Therefore, pore structure, clay mineral composition, and TOC content have a close relationship with the methane adsorption capacity. In them, the PV and SSA of micropores, micro-fracture PV, kaolinite concentration, and TOC content are positively correlated with the methane adsorption capacity.
Conclusions
The methane adsorption capacity is closely related to the pore size and pore structure, especially to the micropore SSA and micro-fracture PV. In order to better understand the effects of coal and shale pore structure in the coal-bearing stratum on the methane adsorption capacity, an integrated classification is provided based on the test range of MIP and low-pressure N2/CO2 gas adsorption. They are micropore (<2 nm), mesopore (2–100 nm), macropore A (100 nm–1 µm), macropore B (1–10 µm), and micro-fracture (>10 µm). Micropores have a positive contribution to the pore structure and the methane adsorption capacity, while mesopores and macropore B negatively contribute to the pore structure and the methane adsorption capacity. Micro-fracture frequency has no contribution to the methane adsorption capacity. However, micro-fracture width is closely related to the methane adsorption, storage, and transport.
Coal samples are divided into groups A and B, and all shale samples are divided into group A. The pore structure of coal or shale samples in group A is more complicated than that of group B, and the fractal dimensions calculated from N2 adsorption data are not suitable for the coal samples which are not developed in mesopore and macropore.
The main factors influencing the methane adsorption capacity of coal and shale in the coal measures are the micropore concentration and micro-fracture width in the pore structure, clay mineral composition, and TOC content. The contributions of micropore PV, micro-fracture PV, micropore SSA, brittle minerals, and TOC content in well DC-4 are higher than that in well DC-5 based on the mentioned experimental data analysis in this article.