
Abstract
Keywords
Introduction
The South American Platform is the stable continental part of the South American plate not affected by the Caribbean and Andean-Phanerozoic-orogenesis (Almeida et al., 2000). In this huge Paleozoic platform, sedimentary basins (Parnaiba, Parana, and Solimões) developed, of which the Parnaiba Basin is the subject of this study. The early depositional phase in the Parnaiba Basin was associated with the final tectonic stages of the Brazilian/Pan-African Cycle (Almeida et al., 2000). The northeastern parts of Brazil comprise Silurian and Devonian strata, considered as potential atypical hydrocarbon sources (Góes and Feijó, 1994; Rodrigues, 1995; Vaz et al., 2007).
For Magoon and Dow (1994), an atypical petroleum system is one in which hydrocarbons were generated when an immature source rock within a thin sequence of sedimentary rocks that overlays continental crust is intruded by a dike. A typical petroliferous system is recognized when the source rock is subjected to maturation due to the increase in temperature with the depth of burial. In contrast, in the atypical petroleum system, the source rocks are matured due to their proximity to areas of contact with igneous intrusions, where the geothermal gradient and subsidence are not sufficient for their maturation (Miranda, 2014;Miranda et al., 2018; Cioccari and Mizusaki, 2019).
In the Parnaiba Basin, there are interesting locations with hydrocarbon generation concerning atypical petroleum systems suggesting that maturation of the organic matter is related to the thermal effect of igneous sill (Rodrigues, 1995; Vaz et al., 2007; Miranda, 2014; Miranda et al., 2018; Cioccari and Mizusaki, 2019). The main petroleum generation intervals of the Parnaiba Basin are located in the Pimenteiras Formation, which is widely distributed and reaches a thickness greater than 500 m (Góes et al., 1990). This formation is rich in organic matter with TOC content varying between 2.0 to 5.0 wt.% and reaches a peak of 6.0 wt.% with the igneous intrusions influence due high maturation of the organic matter incompatible with the thermal evolution by subsidence in the basin (Rodrigues, 1995). For Mussa (2020), the TOC content of the shales from Pimenteiras Formation vary between 1.54 to 16.60
The Paleozoic basins in Brazil (Parnaiba, Parana, and Solimões) have potential strata for the recognition of hydrocarbon generation concerning atypical petroleum systems (Rodrigues, 1995; Araújo, 2015; Souza et al., 2017; Miranda et al., 2018; Cioccari and Mizusaki, 2019). These basins have been discussed by many authors (Rodrigues, 1995; Sousa, 1996; Milani et al., 2001; Vaz et al., 2007; Thomaz Filho et al., 2008; Fernandes, 2011; Miranda, 2014; Araújo, 2015; Souza et al., 2017; Miranda et al., 2018; Cioccari and Mizusaki, 2019; Goulart et al., 2019; Andrade et al., 2020), some of which suggested that the maturation of the organic matter has been frequently influenced by igneous intrusions occurred in the basin. The contribution of the igneous intrusions at the maturation of organic matter in an atypical petroleum system has been the subject of study and discussion by many authors in this basin, as previously mentioned. Furthermore, there are few studies about the influence of the igneous intrusions at the maturation of organic matter and the potential of hydrocarbon generation at the Parnaiba Basin. All of these were unanimous in recognizing the contribution of the igneous intrusions at the maturation of organic matter. Additionally, the transgressive-regressive cycles occurred in Devonian periods and the thermal maturation contributed to the occurrence of kerogen type II and III (Araújo, 2015; Souza et al., 2017; Miranda et al., 2018; Andrade et al., 2020), with potential for hydrocarbon generation.
Goulart et al. (2019) observed a thermogenic and methane anomalies associated with gas chimney (GCs) in a part of the Parnaiba Basin (northeast and south) probably due to the presence of faults related to the Transbrasiliano Lineament (TL).
Therefore, the objective of the study is to evaluate the potential of hydrocarbon generation based on total organic carbon and Rock-Eval pyrolysis parameters in the Parnaiba Basin. It can also contribute to understand how was the depositional conditions, thermal evolution and, the effect of the igneous intrusions effect on the maturation of organic matter in the Pimenteiras Formation, Parnaiba Basin.
Geological setting
The Paleozoic Parnaiba Basin (Figure 1) covers a large area of approximately 600.000

Location of the Parnaiba Basin Brazil showing the geological setting, main groups, formations and studied wells (mod. http://geosgb.cprm.gov.br); A-A' geological cross-section (see Figure 3).
The successions were deposited from Silurian to Cretaceous periods. Despite the great areal distribution of the Silurian to Cretaceous sequences, they are laterally disconnected due to the tectonic activity during and after deposition (Vaz et al., 2007).
The bottom sequences crop out at the basin borders, where facies analysis and deposition environments may be defined. These sequences were deposited overlying Precambrian rocks of the Tocantins Structural Province and the Borborema Province (Milani and Zalan, 1999). In addition, ancient rift basins were developed as a result of the terminal pulses of the Brazilian/Pan African cycles (Cambro-Ordovician) and were distributed throughout the basin, with axes oriented from northeast to north. These grabens were filled with immature siliciclastic sediments of the Jaibras Group (Figure 2) that have accumulated in unstable relief (Quadros, 1996).

Stratigraphic chart of the Parnaiba Basin, highlighting the Pimenteiras Formation (modified from Vaz et al., 2007).
The long-term subsidence of the Parnaiba Basin can be explained through an exponential curve of thermal subsidence. The thermal event responsible for such a long curve is still unknown, but it could be due to the cooling of a thermal event that occurred in the Proterozoic/Paleozoic passage (Milani and Zalan, 1999).
Stratigraphy
The sedimentary record of the Parnaiba Basin is subdivided into five depositional sequences, each separated by regional unconformities (Góes and Feijó, 1994). Each sequence contains major groups, and associated formations resulted from sedimentation associated with transgressive-regressive cycles (Figure 2).
The syneclysis depositional phase of the Parnaiba Basin has started during Silurian and is represented by Serra Grande Group with the Ipu, Tiangua, and Jaicos formations (Silva et al., 2003). These formations represent deposition in fluvial-glacial and glacial environments, passing to the transitional (neritic) and returning to the continental (braided fluvial deposits), respectively.
The Middle-Devonian to Lower Carboniferous sequence is represented by the Caninde Group, with five formations (Figure 2). The Itaim Formation (Lower Devonian) at the base consists of well-sorted sandstones and bioturbated shales (Góes and Feijó, 1994; Silva et al., 2003).
The Devonian (Pimenteiras Formation) consists mainly of dark grey to black, greenish shales, partly bioturbated (Figure 2) rich in organic matter and represent the most important marine ingression of the basin. This formation is interbedded by siltstones, metasedimentary rocks, and sandstones are occasionally observed, and the sedimentation is interpreted to have occurred in a shallow platform environment dominated by periods of storms (Vaz et al., 2007).
According to Vaz et al. (2007), during the Upper Carboniferous to Lower Triassic sequence, the Balsas Group was deposited and registered in the south-central regions with some occurrences in the western and east-north-eastern regions. This group consists of deposits of eolic dunes, interdunes and deflation plains of the Piaui Formation (Carboniferous) (Vaz et al., 2007).
The Pedra de Fogo Formation consists of lower sandstones corresponding to eolic coastal dunes, while the upper horizons deposited in a coastal environment with the local presence of stromatolites, which in turn were superimposed by tidal flat sandstones with sigmoidal cross-stratification and alternations of shales and sandstones deposits. At the top, the Motuca Formation (Permian-Lower Triassic) consists of red shales with siltstones, locally associated with stromatolites, representing deposition in lacustrine/lagoon environment. Finally, strata of the Sambaiba Formation were formed by fine kaolinic sandstones, with bimodal size, interpreted as an eolic system (Vaz et al., 2007). Of all formations discussed above, the Pimenteiras Formation (Figure 2) is considered to contain the major hydrocarbon source rocks of the basin.
Magmatism
The break-up of the Pangea mega-continent resulted in a new tectonic stage within the South American Platform, which led to the opening of the Atlantic Ocean (Vaz et al., 2007). Extensional events, remobilization of old faults, the emergence of fractures and intense magmatism are characteristic of the Mesozoic stage in the evolution of the area.
According to Vaz et al. (2007), the magmatic rocks in the Parnaiba basin are comprised of the Mosquito and Sardinha formations of basaltic composition (Oliveira et al., 2018). In the subsurface, these formations occur as dikes and sills (Figure 3), which are mostly present in the Mesodevonian-Eocarboniferous and Silurian Sequences, but rarely in the Neocarboniferous-Eotriassic Sequences.

Schematic geologic cross-section of the Parnaiba Basin showing the distribution of Jurassic igneous intrusions (modified from Milani and Zalan, 1999; Bizzi et al., 2003).
The Mosquito Formation correlates with lava flows and intrusive rocks of Central Atlantic Magmatic Province, with tholeiitic affinity and Jurassic age (Oliveira et al., 2018). These rocks prevail in the western part of the basin, and most of the dikes are E-W oriented (Mocitaiba et al., 2017). However, the Sardinha Formation is slightly younger, with Cretaceous ages (120–130 Ma), according to Cardoso et al. (2020). It mostly comprises dikes and sills largely distributed in the eastern part of the basin, also with a tholeiitic signature (Hollanda et al., 2019).
Data sources and methods
Data sources
This paper is based on information from 32 wells with Total Organic Carbon (TOC) content and Rock-Eval pyrolysis data from the Parnaiba Basin provided by ANP/BDEP (Exploration and Production Database/Oil National Agency of Petroleum, Natural Gas and Biofuels of Brazil). These data were used to evaluate the hydrocarbon potential of the Pimenteiras source rocks. In these wells, the entire stratigraphic sequence of the Devonian was penetrated by Pimenteiras Formation, thus yielded information of thickness, depth, lithological variations, and the occurrence of igneous intrusions associated with the source rock.
Since the maturation level of Pimenteiras Formation via its burial history is low, that is why the position and thickness of the igneous intrusions within the strata are important to increase the maturity levels and generate petroleum. In this context, the focus was on determining the potential for hydrocarbon generation using the TOC and Rock-Eval pyrolysis parameters.
TOC and Rock-Eval data from a total of 1077 samples from Pimenteiras Formation were compiled from 32 wells, of which 17 wells (481 samples) are characterized by the occurrence of igneous intrusions and 15 wells (596 samples) without it. However, some samples may have lateral thermal influence from nearby igneous intrusions.
Total organic carbon
TOC analyses were carried out on LECO SC144 analyzer and calibrated before the placing of samples. The samples are pulverized, weighed (200
Rock-Eval pyrolysis
Rock-Eval pyrolysis consists of heating a sample at elevated temperatures in an inert carrier gas. Volatilization and pyrolysis of yield petroleum, which was measured by specific detectors. These yields are calibrated based on an analytical standard of each equipment. These data allow the characterization of the type of kerogen, maturity levels, and the transformation of the particulate organic matter into petroleum and natural gas (Espitalié et al., 1977; Tissot and Welte, 1984). Results from Rock-Eval pyrolysis are expressed by the S1 peak (free hydrocarbons liberated by rock- mg HC/g rock); the S2 peak (hydrocarbons generated by pyrolytic degradation of the kerogen (mg HC/g rock); the S3 peak: carbon dioxide generated from the sample (mg CO2/g rock); the Tmax (oC): temperature at maximum generation of hydrocarbons during S2 peak generation; the HI: hydrogen index (mg HC/g TOC) and OI: oxygen index (mg CO2/g TOC). In the present study, results from Rock-Eval pyrolysis were provided by ANP/BDEP.
Regional distribution and data evaluation
For a clearer interpretation of the data, analytical results are presented in three groups from specific wells representing the north, center, and south of the Parnaiba Basin (Figure 4). Thus, the data were presented graphically, comparing TOC and S1 with depth, to identify horizons and locations with potential for petroleum. The type of organic matter and the thermal maturity are evaluated from the relation between Hydrogen Index and Tmax.
In addition, the maps (Figure 5) show the interpolation of the top and base, the thickness of Pimenteiras Formation, and the cumulative thickness of diabase in the formation. These maps were used to evaluate the regional distribution and the potential of petroleum generation in the Pimenteiras Formation.
Results and discussions
The distribution of the Pimenteiras Formation and the intrusive rocks within the study area
The geological evaluation of the 32 wells (1077 samples) shows wells from north, center and south of the basin (Figure 4). Additionally, were presented the interpolation maps regarding the thickness and depth of the Pimenteiras Formation reveals crucial information concerning the deposition and depocenter position during the Devonian period. The top of the formation occurs at a depth between 500–2000
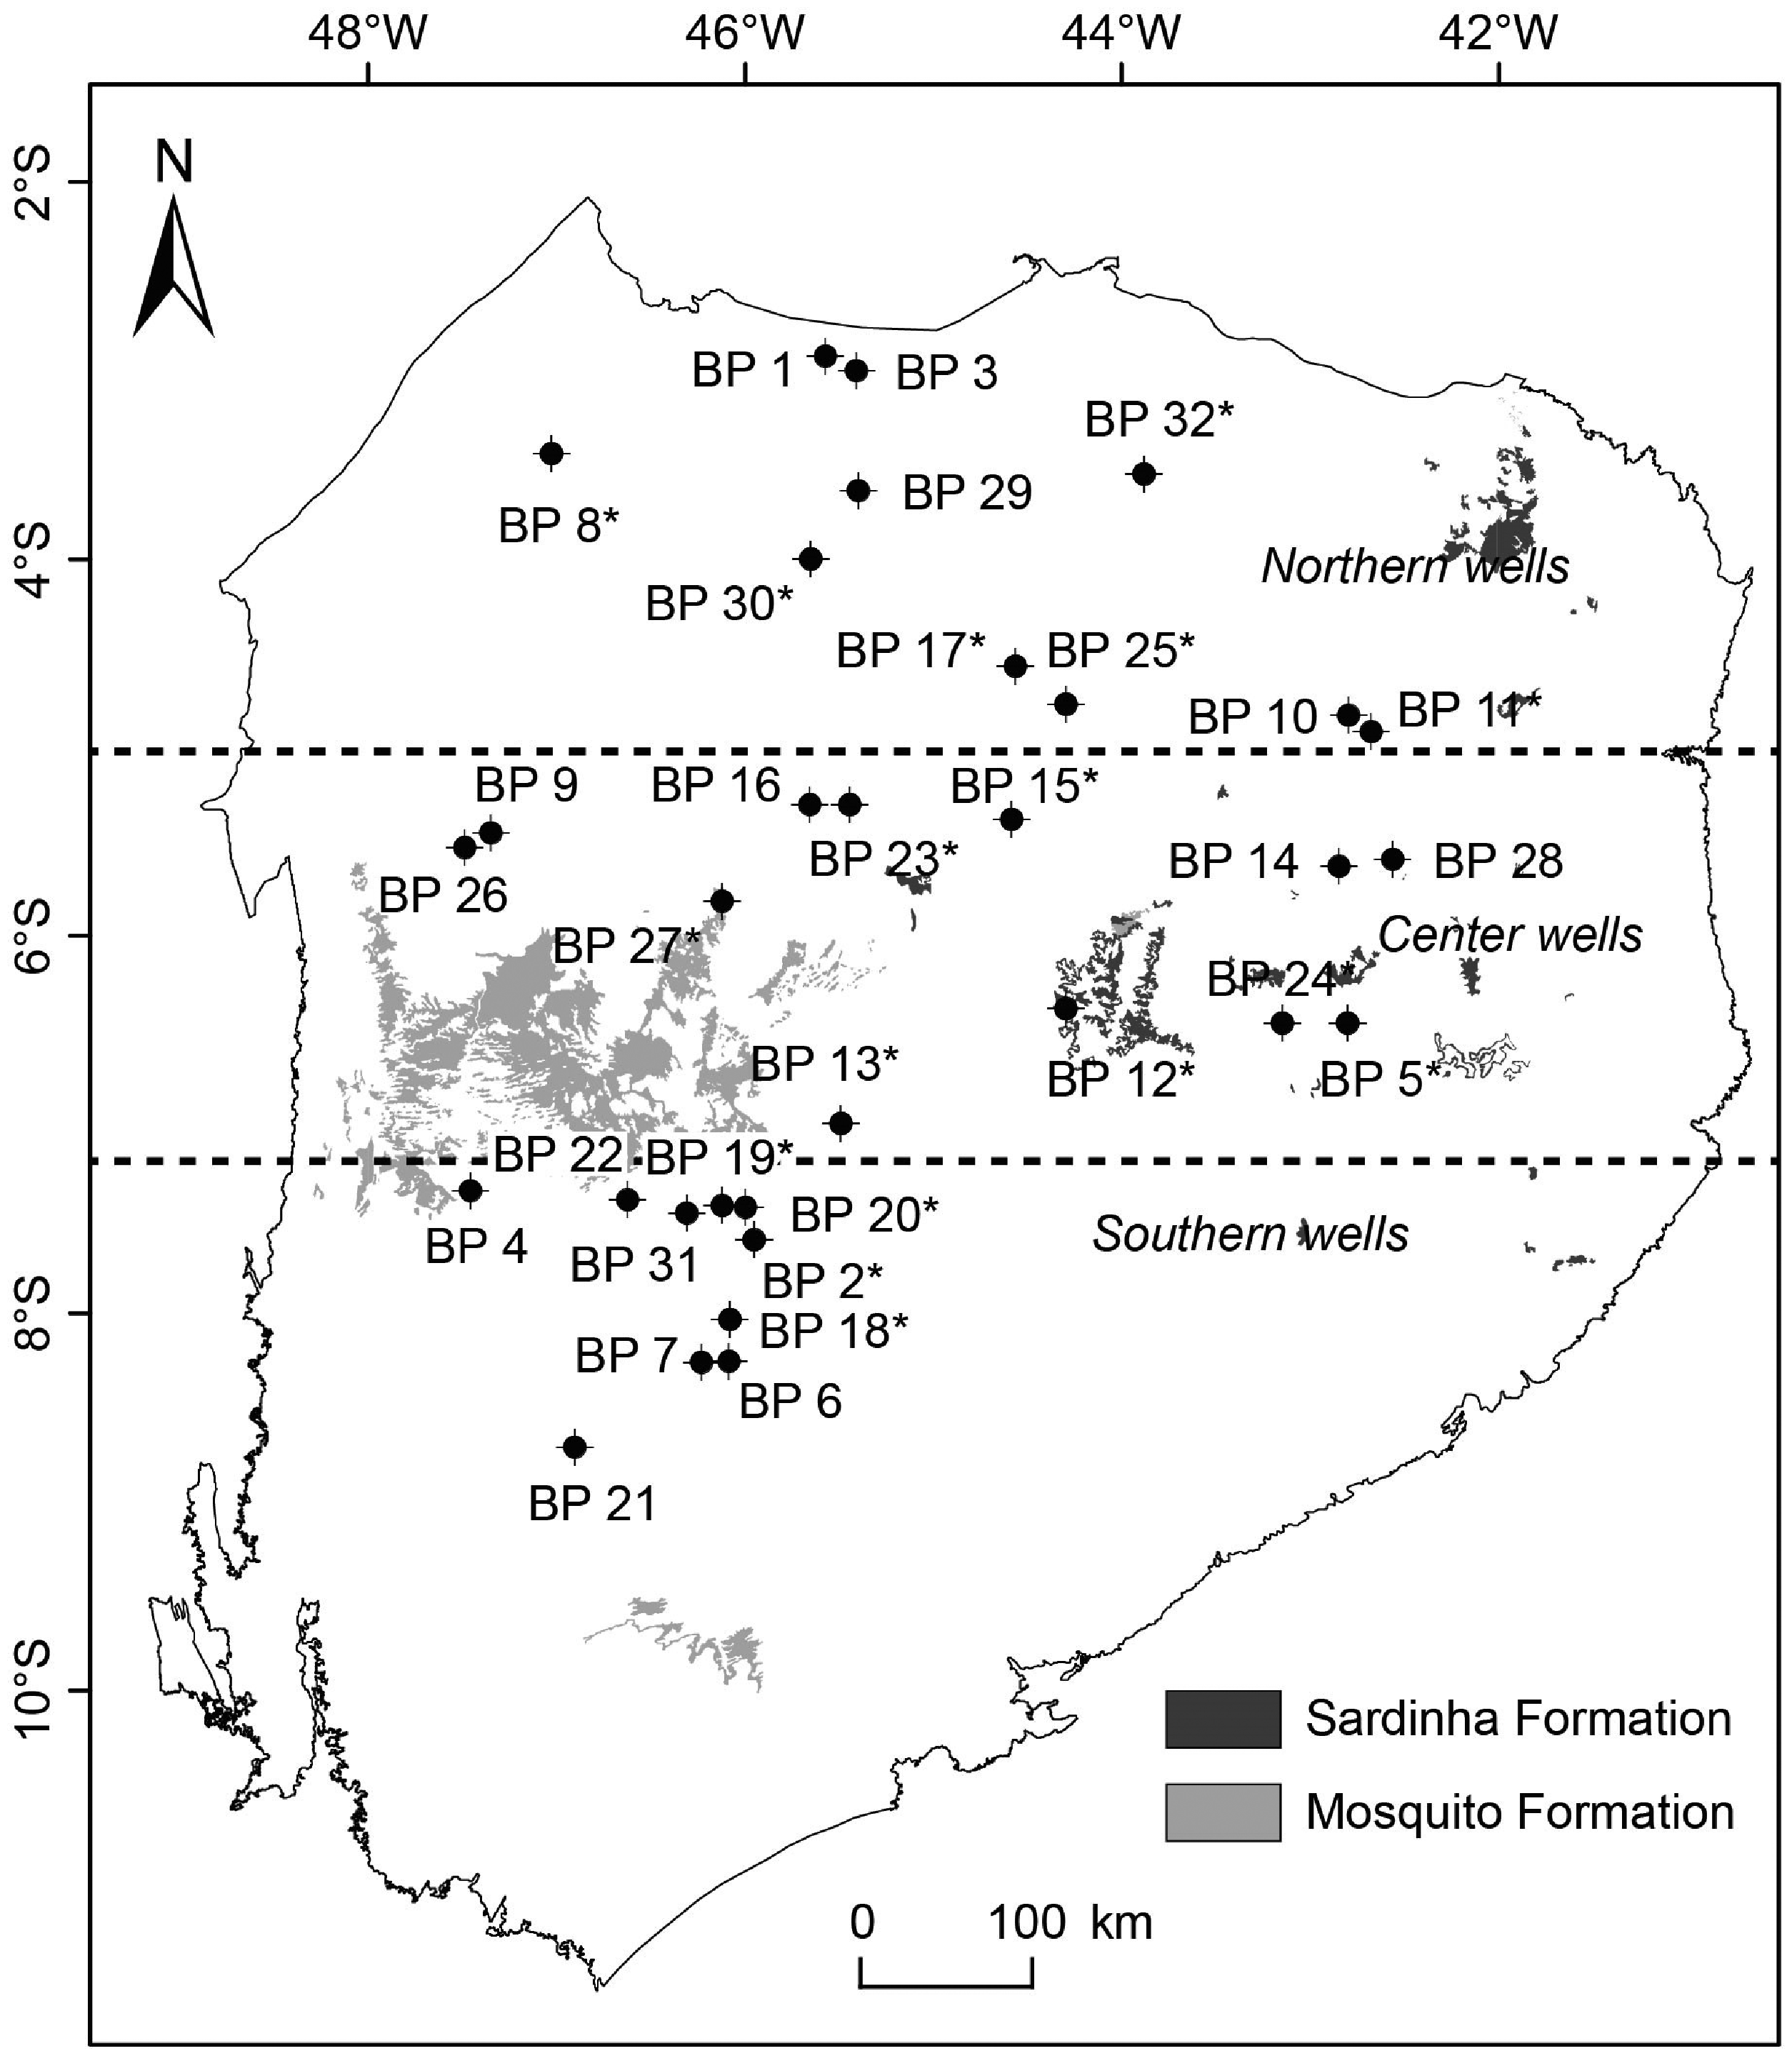
Regional distribution of the 32 exploration wells of the Parnaiba Basin. Wells with asterisks (*) represent igneous intrusions in the Pimenteiras Formation whereas the dashed lines show the division of the data in the northern, central and southern wells. Highlight the spatial influence of igneous rocks on source rocks of Sardinha and Mosquito formations at the north, center and south regions.

Interpolation maps of the distribution of: (a) top, (b) base, (c) cumulative thicknesses (m) of Pimenteiras Formation and (d) cumulative thicknesses (m) of diabase in the Pimenteiras Formation.
The thickness of the Pimenteiras Formation ranges from 40 to 680
Regional differences identified in the Parnaiba Basin regarding the relationship between the depth of the Pimenteiras Formation (Figure 5(a) and (b)) and its thickness distribution (Figure 5(c)) reflect changes in basin depocenter during the deposition and post-deposition reconfigurations in the basin. The elliptical shape seen in Figure 5(a) and (b) demonstrates the relevance of an E-W-oriented structural control during post-depositional evolution of the Parnaiba Basin, while during Devonian times, the deposition of the Pimenteiras Formation sequences probably occurred in a northwest-oriented valley (Figure 5(c)).
The lithostratigraphic record of the Pimenteiras Formation, mainly in the southeastern part of the basin (Figure 5(d)), is partially formed by thick horizontal (sills) igneous intrusions. The distribution of the intrusions in relation to their cumulative thickness shows a main northwest-trend alignment (Figure 5(d)). The presence of this pattern is probably related to the ancient structural trend of the basin basement that served as a rising channel for deep melts that feed intrusive sills and lava flows all over the basin. These intrusions can reach 260
Geochemical data
Total organic carbon
The results show that the majority of samples had TOC contents varying from 0.1 to 4.7
Synthesis of analytical data of samples from the Pimenteiras Formation in the 32 wells by intervals (minimum and maximum).

BP-25 well lacks information for S2, Tmax °C and HI; x: lacks OI values.
aTop/Bottom.
bNumber of samples per well.
c,dmg HC/g rock.
emg HC/g TOC.
fmg CO2/g TOC.
gWells with igneous intrusions.
Depth vs. TOC content
The TOC content variations with depth in the northern part are classified from poor to excellent in source rock potential (Figure 6(a)). The same pattern was observed in the central part (Figure 6(b)). In the southern part, many wells show TOC content varying from poor to good (Figure 6(c)) in source rock potential (Peters and Cassa, 1994). The TOC contents in these three regions suggest that in the northern and central regions, the accumulation and preservation of organic matter are related to anoxia of the system, i.e., a proximal environment, relatively to the southern part, where the sediments accumulated in shallower depths cause a fair preservation of the organic matter.

TOC content vs. Depth (m) of the samples showing the ranking of organic richness from North to South.
Rock-Eval pyrolysis
Variations in the S1 peaks and depth vs. S1
The majority of wells analyzed (75%) has S1 values less than 1.0
In the northern region of the basin, the S1 values vary from poor to fair (Figure 7(a)) in almost all of the wells in the center of the basin (BP-9, BP-12, BP-16 and BP-28 wells), the S1 oil contents vary from poor to very good (Figure 7(b)) (Peters and Cassa, 1994). In the southern part, the S1 oil contents in many wells are lean (Figure 7(c)).

Depth (m) vs. S1 (mg HC/g rock) relationships of the samples from the wells analyzed, showing the rating of oil content from the North to the South.
Variations in the S2 peaks
In 46.9% of the wells, S2 values range from 0.01 to 1.91
Variations in hydrogen and oxygen indices
In many samples from the BP-10, BP-23, BP-28 and BP-29 wells (representing 12.5% of the wells) the HI is greater than 600
Variations in Tmax and relationship with HI
Tmax of 18.75% of the wells is less than 435°C (immature) whereas, in 59.38% of the wells, Tmax values range between 421 and 461°C (Table 1) classified from immature to mature (Peters and Cassa, 1994). About to 22% of the wells (BP-10, BP-13, BP-17, BP-24, BP-25, BP-28 and BP-29), Tmax values reach 548°C varing from immature to postmature (Peters and Cassa, 1994).
The Hydrogen Index vs. Tmax relationship showed that many samples are immature to mature with the predominance of kerogen types II and III, respectively (Figure 8(a) to (c)). Wells with HI ≤ 300 (mg HC/g TOC) indicate the type III kerogen, potential for gas generation, HI from 300 to 600 (mg HC/g TOC) type I kerogen, potential for oil and gas generation.

Hydrogen Index contents vs. Tmax oC relationships of the wells analyzed showing the rating of the wells in relation to HI and maturity from North to South.
In the northern and central regions, many samples indicate the presence of type II and III kerogen (Figure 8(a) and (b)), prone to oil and gas generation and Tmax varying from immature to mature, except BP-28 well (Figure 8(b)) with Tmax values indicating postmature stage despite the HI shows type III. However, samples from south of the basin predominate types III to IV kerogen (Figure 8(c)), prone to gas generation, although the Tmax values vary from immature to mature.
In the BP-28 well without igneous intrusions, the Tmax varies from immature to postmature due to the high thermal maturation of the source rock and Transbrasiliano Lineament. Similar conclusions were reported by Goulart et al. (2019), suggesting that the Transbrasiliano Lineament influences on the generation of gas chimneys and thermogenic anomalies. However, the HI ranging 916.6
It was observed that in some cases, despite the Tmax indicate rather an immaturity, the HI values showed that the samples are hydrocarbon generating.
Notably, the samples from north, center, and south contain significant amounts of type IV kerogen, mostly present in wells with intrusions in the Pimenteiras Formation, suggesting that the additional heat led to cracking of kerogen. Nevertheless, some samples may indicate degrading due to oxidation processes related to subaerial exposure during deposition or biogenic It is important to note that the effects of the igneous intrusions contribute to the maturation of organic matter, thereby also reducing the pyrolysis yields and HI values. Meyers and Simoneit (1999) showed that Rock-Eval pyrolysis of organic-carbon-rich shales collected in contact zones of igneous intrusions were characterized by reduced hydrocarbon contents and severe alterations of geochemical parameters. The BP-13 and BP-25 well with igneous intrusions occurrence the Tmax reaches 516
The influence of the igneous intrusion on the maturation of organic matter and kerogen alteration
The wells affected by igneous intrusions were analyzed to verify the contribution of the igneous intrusions on the maturation of organic matter, based on variations of TOC content and Rock-Eval pyrolysis data as was mentioned before. In wells with diabase occurrence within the Pimenteiras Formation strata, the increase of Tmax is commonly caused by heating from igneous activity. Otherwise, when this effect is severe, there is a decrease in geochemical parameters as was reported by Aarnes et al. (2010, 2011).
Regional comparison of TOC content and Rock-Eval pyrolysis
North of the basin
Two wells with a representative sampling through the profiles were selected in the northern part of the basin to demonstrate the trends of geochemical parameters (Figure 9(a)). It is possible to verify that BP-29 well (without igneous intrusions), the TOC content tends to decrease with depth (Figure 9(a)) varying from 0.2 to 4.7
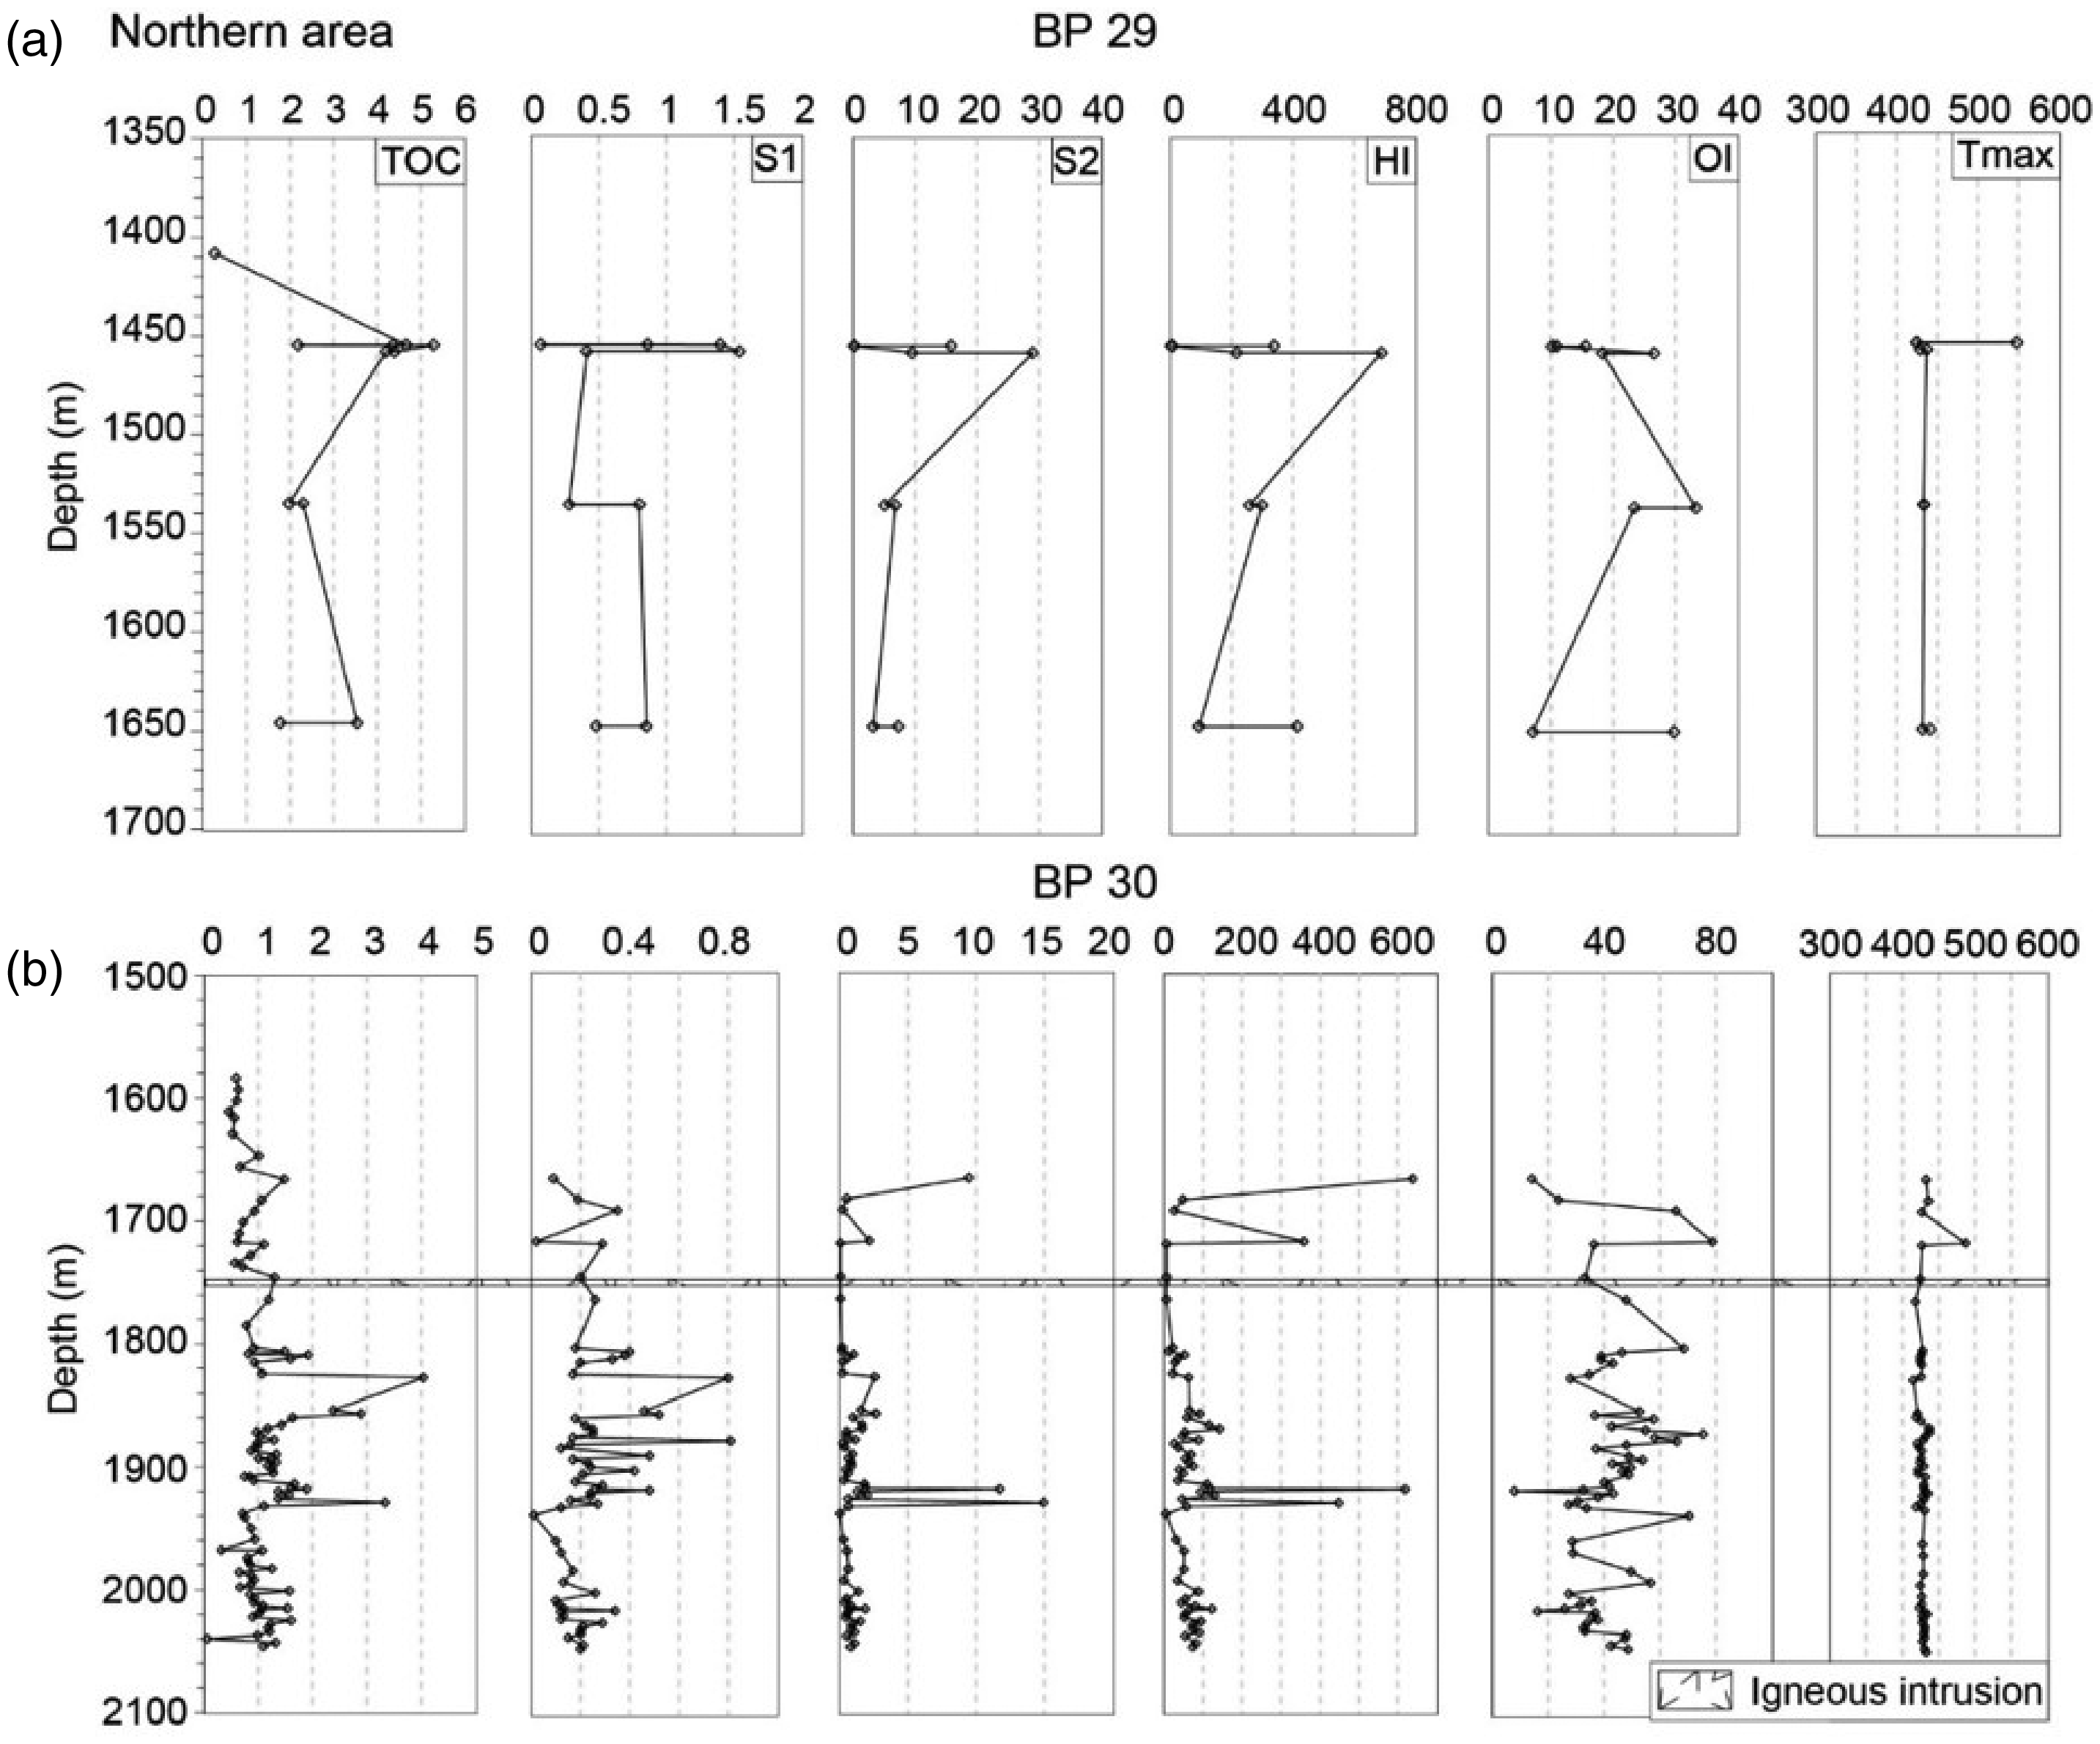
Geochemical profiles of BP-29 and BP-30 wells from North of Basin.
The HI reaches 690 (mg HC/g TOC) containing type I and III kerogens, with potential for oil and gas generation related to transgressive-regressive cycles occurred during the Devonian periods in the basin. The Tmax values vary from 425 to 548
For the BP-30 well (with igneous intrusions), the TOC content and Rock-Eval parameters tend to increase with depth with a slight decrease close to igneous intrusions in approximately 1760
The HI (mg HC/g TOC) increases inversely with OI (mg HC/g TOC) showing type II and III kerogen, with potential for oil and gas generation. It is noted that the samples close to igneous intrusions, the HI values decrease abruptly and posteriorly increase with depth (Figure 9(b)) probably related to thermal evolution of the basin, depositional environment, transgressive-regressive cycles and effects of igneous intrusions.
The high Tmax values verified close to igneous intrusions (443
Center of the basin
The TOC content of BP-12 well varies from 0.2 to 1.66

Geochemical profiles of BP-12, BP-16 and BP-27 wells from Center of Basin.
Between 1400–1460
The BP-27 well has HI less than 150 (mg HC/g TOC), showing type III and IV kerogen, mostly with potential for gas generation (Figure 10(a) and (c)). BP-16 well, the HI reaches 522
TOC content of the BP-16 well (without igneous intrusions) varies from 0.4 to 4.2
The S1 varies from 0.1 to 2.35 (mg HC/g rock) and S2 (mg HC/g rock) from 0.2 to 12.9 (mg HC/g rock), classified from poor to very good in source rock potential. The HI reaches 522 (mg HC/g TOC), containing type II and III kerogen (Figure 10(b)), potential for oil and gas generation (Peters and Cassa, 1994).
The HI variation is related to the depositional environment, transgressive-regressive cycles verified in this basin during the Devonian period, and Tmax in many samples is less than 435
South of the basin
The TOC content of the BP-7 and BP-31 wells (without igneous intrusions) varies from 0.5 to 2.82
For the BP-7 well, the TOC content and Rock-Eval parameters started to increase in 600

Geochemical profiles of BP-7, BP-18 and BP-31 wells from South of Basin.
The S2 in these wells showed that the source rock was unable to generate hydrocarbons, probably associated with low Tmax values. However, the HI is less than 200 (mg HC/g TOC), with the presence of type III and IV kerogen (Figure 11(a) and (c)), prone to gas generation with organic matter essentially continental. The presence of the kerogen type IV can be related to the level of maturity or cracking of kerogen types II and III.
TOC content and Rock-Eval parameters of BP-18 well (with igneous intrusions) showed the same pattern seen in wells with igneous intrusions in the north and center parts of the basin a decrease of geochemical parameters in samples close to dikes of diabase in 950 and 1100 m depth (Figure 11(b)). The TOC content varies from 0.5 to 1.89
Regional oil crossover effect
The relationship between S1 and TOC content was plotted to infer the potentially producible oil (Figure 12) and observed that it does not occur the potentially producible oil, except two samples from well BP-7(without igneous intrusions) located on the south of the basin. In these samples, the value exceeding 100

Free Oil content (S1 in mg HC/g rock) vs. TOC content showing oil crossover effect from northern to southern.
Conclusions
The data produced in this work provides subsidies to establish the characteristics of the Parnaiba Basin with regards to the quality of shales of the Pimenteiras Formation as hydrocarbon-generating rocks. The geological evaluation of the thickness of the Pimenteiras Formation revealed that the main depocenter of the basin during Devonian times occurs in a northwest-oriented axis, mostly filled with marine sediments during a transgressive cycle. In the southeastern and central parts of the basin, there is an occurrence of thick igneous intrusions associated with basement structural trends, (as the Transbrasiliano Lineament), which served as a rising channel for deep melts.
TOC contents show significant variations along with the profiles of the analyzed wells, demonstrating some relation with the depositional history of the basin. Horizons with higher TOC concentrations have high HI/OI ratios and, consequently, high S2 production. However, these conditions are not observed in some samples, although their TOC content above 1.0
Hydrogen indices of samples not associated with igneous intrusions indicate the presence of kerogen type II and III (mostly) and secondarily type I, but the low maturity levels defined by Tmax do not allow oil and gas generation. A few of these samples have type IV kerogen attributed to subaerial exposure and/or biogenic degradation (low of HI/OI ratios) during deposition. Nevertheless, most of the organic matter degrades due to excessive heat in contact with the intrusions that increase the maturation of the source generating oil and gas. The kerogen type IV described in this work was generated due to the kerogen type II or III highly mature caused by magmatic heating.
The Tmax in many samples of the wells indicates immaturity, despite the S2 shows a good source rock potential.
In the Pimenteiras Formation, the contribution of the igneous intrusions was decisive for the maturation of organic matter. Additionally, it was observed that the wells without igneous intrusions showed good indicators of potential for hydrocarbon generation probably due to the thermogenic anomalies associated with gas chimney in a part of the Parnaiba Basin (northeast and south) probably due to the presence of faults related to Transbrasiliano Lineament. However, it is needed more studies in the formation based in other parameters as the vitrinite reflectance, palynofacies, elemental analysis, x-ray diffraction and gas chromatography-mass spectrometry (GC-MS) to improve the data presented in this work concerning the determination of the potential for hydrocarbon generation and the level of the contribution of igneous intrusions to the maturation of organic matter.
Supplemental Material
sj-pdf-1-eea-10.1177_0144598720949584 - Supplemental material for Evaluation of the hydrocarbon generation potential of the Pimenteiras Formation, Parnaiba Basin (Brazil) based on total organic carbon content and Rock-Eval pyrolysis data
Supplemental material, sj-pdf-1-eea-10.1177_0144598720949584 for Evaluation of the hydrocarbon generation potential of the Pimenteiras Formation, Parnaiba Basin (Brazil) based on total organic carbon content and Rock-Eval pyrolysis data by Agostinho Mussa, Wolfgang Kalkreuth, Ana Maria Pimentel Mizusaki, Marleny Blanco González, Tais Freitas da Silva and Marcos Müller Bicca in Energy Exploration & Exploitation
Footnotes
Acknowledgements
Declaration of conflicting interests
Funding
ORCID iDs
Supplemental material
References
Supplementary Material
Please find the following supplemental material available below.
For Open Access articles published under a Creative Commons License, all supplemental material carries the same license as the article it is associated with.
For non-Open Access articles published, all supplemental material carries a non-exclusive license, and permission requests for re-use of supplemental material or any part of supplemental material shall be sent directly to the copyright owner as specified in the copyright notice associated with the article.