
Abstract
Keywords
Introduction
As an essential unconventional resource, shale oil has been successfully developed in countries such as USA and Canada (Gale et al., 2007; Huang et al., 2019; Kirschbaum and Mercier, 2013; Kuhn et al., 2012; Liu et al., 2018; Ojha et al., 2017). The shale oil reservoir, which are generally accepted as the storage space in shale, are usually in the micro-nanometers range. Besides, the pores and micro-cracks are connected in a complex manner, which makes it challenging to evaluate the potential of shale formation exploration and development. Furthermore, even though shale gas formation has been extensively characterized using various techniques, quite limited research is conducted for shale oil reservoir. Hence, the detailed study on pore structure characterization of shale oil reservoir can promote the understanding and the development in shale oil fields.
In recent years, various techniques were adopted for the pore structure characterization research for tight oil and gas reservoir, shale oil and gas reservoir, including scanning electron microscopy (SEM), field emission scanning electron microscopy (FESEM), argon ion polishing-FESEM, focused ion beam scanning electron microscopy (FIBSEM), small-angle neutron scattering (SANS), nano-CT and quantitative analysis using mercury injection porosimetry (MIP), gas adsorption (low-pressure nitrogen adsorption (LP-N2A) and low-pressure carbon dioxide adsorption (LP-CO2A)), nuclear magnetic resonance (NMR), etc. (Clarkson et al., 2013; Gao and Li, 2015, 2016; Ji et al., 2012; Liu et al., 2018; Ma et al., 2019; Zhang et al., 2019). The unconventional reservoirs (coal seams, shale oil/gas reservoirs) commonly present complex pore type and different size, then a comprehensive pore size characterization was developed by using different techniques (Cao et al., 2015; Clarkson et al., 2013; Liu et al., 2018; Okolo et al., 2015; Pan et al., 2017; Wang and Yu, 2017; Wang et al., 2014; Yang et al., 2013, 2017; Zhang et al., 2016). There are three techniques that are commonly used by the previous studies for pore structure, which are FESEM, MIP and LP-N2A. FESEM features a high imaging accuracy of 1 nm, and the high quality 2 D planar images of the pores larger than 5 nm can be obtained; but FESEM also presents obviously defect to acquire the 3 D pore distribution and pore parameters (Alfi et al., 2019). The MIP can be used to measure the pore throat radius quickly, pore throat distribution and other pore throat parameters, in which the measurement is more accurate with the higher mercury injection pressure. However, it is difficult to measure the micro-pore information due to the limited mercury injection pressure under laboratory conditions (Gao et al., 2019; Juliao et al., 2015; Wang et al., 2019). The LP-N2A technique can provide more particulars of the specific surface area and pore size of micro-pores, but the potential measurement errors from LP-N2A may also be magnified once the macro-pores are developed in the shale (Juliao et al., 2015; Wang et al., 2019). It is thereby essential to integrate several techniques and combine the results, then the convincing and conclusive characteristics of the pores in the unconventional reservoirs can be acquired with high reliability and accuracy. Although there are many researches of the comprehensive pore size characterization, it should not be ignored that the existing researches mainly focus on shale gas, and there is little research on the pore structure of shale oil reservoir.
The shale reservoir commonly features complex pore structure. Loucks et al. (2009, 2012) studied the pore structure of the Mississippian Barnett shale, and they classified the pores into three different types, mineral matrix pores, organic-matter pores and fracture pores respectively. The mineral matrix pores are pores that distribute between or within mineral pores, it can also be subdivided into two types, interparticle pores and intraparticle pores. The interparticle pores include pores between grains, pores between crystals, pores between clay platelets and pores at the edge of rigid grains. As for the intraparticle pores, they can be classified into seven types, such as the intercrystalline pores within pyrite framboids, intraplatelet pores within clay aggregates, pores with in peloids or pellets, pores within fossil bodies, moldic pores after a crystal, moldic pores after a fossil, and so on. The organic-matter pores are pores within organic matter. As for the fracture pores, these pores are not controlled by individual particles. Currently, the commercial development mainly focus on the marine shale reservoir, and the pore structure of the marine shale reservoir and the transitional shale shale reservoir is quite different. The TOC content in the marine shale is commonly high, and the micropores (<2 nm) are dominant in the organic matters, which is known as the organic-matter pores (Sun et al., 2016; Yang et al., 2016). It should be noticed that the high TOC content does not mean high micropore volume, especially when the
The Chang 7 shale oil reservoir features typical characteristics of very high organic matter content and high quality shale oil, which attracts the attentions of the scholars since 2005 (Yang and Zhang, 2005). However, these studies mainly focus on the shale oil potential evaluation (Ji et al., 2017; Yang et al., 2016), and the limited researches on the pore structure of the shale oil reservoir only use the single technique (Li et al., 2016; Xiong et al., 2017). The comprehensive study of the pore structure of the Chang 7 shale oil reservoir is absent. Based on previous studies, this paper applies multiple techniques and methods, combines the argon ion polishing FESEM, LP-N2A, MIP and other experiments to qualitatively analyze the pore type of the Chang 7 shale oil reservoir in Ordos Basin, quantitatively characterize the overall pore size distribution, and evaluate the key factors restricting pore development. This research provides fundamental understanding and facilitates the exploration and development of the Chang 7 shale oil reservoir in Ordos Basin.
Geological setting
Ordos Basin locates in the western of North China area. The sketch of the location, subdivisions and Late Triassic Yanchang Formation Chang 7 shale oil reservoir distribution of the Ordos Basin are shown in Figure 1. Since the early Paleozoic development, the basin has evolved from the continental margin Sea basin to the coastal shallow sea basin, the Inland Basin and the foreland basin, and finally formed a basin pattern with complete stratigraphic structure and simple structure. The Ordos Basin is composed of 6 first-order tectonic units, which are Yimeng Uplift, Weibei Uplift, Shaanbei slope, Jinxi belt, Tianhuan Depression and West Thrust belt. The Shanbei slope locates in the middle and its structural unit is the main body of the Ordos Basin (Yuan et al., 2007). It is rich in the mineral resources of oil and coal, and also the currently main area of shale oil exploration.

Distribution of Chang 7 shale oil reservoir in Ordos basin.
In the Late Triassic, the Ordos Basin stretched and subsided, forming a large freshwater lake inside the basin, and depositing a set of terrigenous clastic rock series dominated by fluvial-lacustrine facies, which is the Yanchang Formation. Yanchang Formation is a fluvial-lacustrine facies sedimentary system during the continuously depression and stable sedimentation in the Ordos Basin, which experiedced the whole procedures of generation, expandation, evolution and subduction. According to the characteristics of the reservoirs, Yanchang Formation can be divided into 10 sections. Among them, the Chang 7 section features the largest lake period, forming a large area of the deep lake area. During that time, a large-scale lake phase shale layer was developed in the middle and lower part of the Chang 7 section under stable sedimentary environment (Zou et al., 2013). After the Chang 7 period, the lake tends to be shrank, the lacustrine facies are developed in the western of the research area primarily, following that the sedimentary facies evolve to the fan delta front subfacies. In the middle of the research area, the lacustrine facies is also developed, but the sedimentary facies evolve to the braided river delta front subfacies subsquently. As for the south of the research area, it is denuded bacause of the uplift of the strata (Yin et al., 2019). Influenced by the tectonic movement, the terrigenous sediments mainly from the norwest of the Alashan area, Kongzite belt and bayanhaote area.
The thickness of the Chang 7 lacustrine shale layer varies greatly, with a maximum thickness of 130 m, and it present approximately 3 × 10⁴ km2 shale distribution with a thickness exceeds 10 m. The shale distribution area is symmetric about the line connecting Jiyuan and Zhengning, extending to both sides and extending to the north and south ends of the study area. Flat and fully developed formation of Chang 7 shale, slow tectonic movement, stable sedimentary environment, large thickness of shale and wide distribution area provided the proper conditions for the accumulation of shale oil.
Experimental section
Experimental setup
Fourteen samples are collected from Chang 7 shale oil reservoir in Ordos Basin. The LP-CO2A mainly aims at the pores with the radius less than 2 nm. However, those pores contribute little to the transportation of the fluids flow. Besides, the accuracy of the results using CO2 adsorption were under verified (Juliao et al., 2015; Wang et al., 2019), especially when evaluating the pore structure of shale and unconventional sandstones during the oil flow. Therefore, the LP-N2A and MIP methods were utilized to determine the pore size distribution (PSD) in this research. The argon ion polishing FE-SEM was used to recognize the pore type, pore development and pore connectivity of shale oil reservoir.
The apparatus used in this research includes Quanta200F FESEM from FEI, IM 400 Argon ion polishing machine from HITACHI, the automatic specific surface area and micro-pore analyzer (ASAP2420), and the automatic mercury invasion instrument AutoPore IV9500. The FEI Quanta200F has an accelerator voltage of 200 V-30KV and an accuracy of 3.5 nm. The ASAP2420 and AutoPore IV9500 are from Micromeritics of USA. The ASAP2420 detects the pore with radius between 0.35 nm to 500 nm, with the minimum detected pore volume being 0.0001 cm3/g, the minimum measured specific surface area being 0.0005 m2/g, and the resolution in micro-pores reaching 0.2 nm. The maximum pressure of AutoPore IV9500 is 99.96 MPa, which corresponds to the minimum pore aperture of 7.35 nm.
Experimental procedures
Results
Pore types
Three types of pores were observed in the Chang 7 shale oil reservoir by argon ion polishing FESEM, intergranular pores, intragranular pores and organic pores as shown in Figure 2. However, the abundance, distribution and pore connectivity of different types in the samples are different. The intergranular pores in Chang 7 shale oil reservoir are well developed and these pores are well connected. Five types of intergranular pores are developed between brittle granules, brittle and clay, aggregated clay, organic and clay, and pyrite granule and clay. The main types of intragranular pores are intragranular pores and illite intercrystalline pores in clay particles. The granules of clay granules are widely distributed in the clay and appeared in groups. The intergranular pores of the illite developed in the form of interconnected pore groups compose of nanometer-scale pores in the Chang 7 shale oil reservoir samples. The organic pores can also be observed to different degrees because of the maturity of organic matter, and most of the pores are larger than 10 nm in diameter. In addition, micro-cracks were found in the Chang 7 shale oil reservoir samples in this study, though with only a small proportion of micro-cracks can be observed. According to the statistics of micro-crack parameters, the micro-nano-scale cracks are developed. The micro-crack length of the sample ranges from 5.27 to 89.46 μm (average of 27.75 μm). The micro-crack aperture varies from 80 to 880 μm (average of 330 μm). As a typical transitional shale reservoir, the mineral matrix pores are developed in Chang 7 shale oil reservoir (Figure 2), which is quite different with that in the marine shale (Sun et al., 2016; Yang et al., 2016). For the transitional shale, there is a large amount of supply of terrestrial materials (Yu et al., 2019), the content of the organic matters is less than that of the marine shale, then the dominant pore structure difference of the transitional shale and the marine shale would be the pore types, the mineral matrix pores would be the typical pores in the transitional shale, while the organic pores would be the dominant pores for the later one. There is still some organic pores in the Chang 7 shale, while these pores are commonly meso-pores, and the micro-pores are not developed (Figure 2(h)).

The pore types of Chang 7 shale oil reservoir samples. (a) Brittle granule and clay intergranular pores; (b) Organic and clay intergranular pores; (c) Pyrite granule and clay intergranular pores; (d) Aggregated clay intergranular pores; (e) Pyrite granule intergranular pores; (f) Clay granule intragranular pore; (g) Illite intagranular pore; (h) Isolated organic pores; (i) Directionally arranged micro-crack.
Pore size distribution through LP-N2A
Figure 3 shows the LP-N2A curves of the Chang 7 shale samples. According to adsorption and desorption characteristics, two types can be clearly distinguished from the LP-N2A curves. The first type of isotherm corresponds to the IV type isotherm of International Union of Pure and Applied Chemistry (IUPAC) and the H2 type hysteresis loop (Figure 3(a)). At the initial stage of adsorption, mainly when the relative pressure below 0.8, the adsorption curve presents a slightly convex shape, and first increases linearly with the increase of relative pressure. When the relative pressure ranges from 0.8 to 1, the adsorption rate features a sharp increase. This phenomenon is characterized by capillary condensation of nitrogen on the surface of shale. No adsorption saturation occurs, indicating that there is a certain quantity of macro-pores. The desorption curve does not coincide with the adsorption curve when the relative pressure decreases to 0.4. The coincidence of the adsorption and desorption curve at the relative pressure of 1 means the open pores in the sample. There is also a significantly knee point when the relative pressure decrease to approximately 0.5, and the two curves close again at the lower relative pressures, forming a wide H2 hysteresis loop, reflecting “the ink bottle” shaped pores which are mainly large pore, small throat and well developed meso-pores and micro-pores. The second type of isotherm corresponds to the type I isotherm of IUPAC and the hysteresis loop of H3 type (Figure 3(b)). The adsorption curve is very gentle in the region with low relative pressure; the adsorption amount is not large, and adsorption increased significantly when the relative pressure is close to the region of 1, and no adsorption saturation appeared, reflecting the development of macro-pores. The desorption curve and the shape of the adsorption curve are almost overlapped, and a small hysteresis loop is formed only in the region with high relative pressure, with no knee point at 0.5 reflects that the parallel “plate-like” pores which are open all around are relatively developed, and the pore size range is widely distributed.

Adsorption and desorption results of Chang 7 shale samples. (a) Group I, (b) Group II.
The LP-N2A results of the Chang 7 shale oil reservoir samples show that the average pore diameter of the samples is between 9.79 and 17.35 nm. According to the BJH method, the pore size distribution curves of the samples No. 7, No. 9, No. 13, No. 16, No. 30, No. 39 and No. 57 show a unimodal pattern, and the peak appears in the range of 4 to 6 nm; while for samples No. 12, No. 33, No. 35, No. 36, No. 37, No. 46 and No. 47, the distribution curves show a bimodal pattern with two peaks in the range of 4 ∼ 6 nm and 50 ∼ 100 nm (Figure 4). The bimodal feature of second type samples demonstrate the well-developed pores with diameters larger than 50 nm. These typical pore size distribution characteristics indicate the various pore structures in the Chang 7 shale oil reservoir samples. Therefore, the Chang 7 shale samples are classified into two groups, i.e. Group I and Group II as shown in Figure 4. Commonly, there are two different methods that can help us to classify the pore sizes in the porous mediums, IUPAC’s and Hotot’s, and for the shale and shale oil reservoir samples, the former one is mostly used. According to commonly used pore classifications of IUPAC standard, pores with pore diameter less than 2 nm are defined as micro-pores; pores with diameter between 2 and 50 nm are identified meso-pores; and pores with diameter larger than 50 nm are called macropores. As for Chang 7 shale oil reservoir, it is found that the IUPAC standard cannot fully represent the relatively larger pores obtained from MIP results. Hence, we define a new range of the three categories of pores for the Chang 7 shale oil reservoir as the following: micro-pores (<10 nm), meso-pores (10 ∼ 100 nm) and macro-pores (>100 nm). In the new standard, the major oil-bearing pores still belong to the mesopores.

Pore size distribution of Chang 7 shale samples using LP-N2A. (a) Group I, (b) Group II.
The SSA, determined based on the BET model, are between 2.70 ∼ 11.43 m2/g (average of 5.44 m2/g). The total PV of the samples is determined based on BJH model, resulting in the range of 0.012 ∼ 0.03 cm3/g and with an average 0.0197 cm3/g. According to the new standard, the micro-pores, meso-pores and macro-pores in average accounts for 67.80%, 30.51%, 1.69% of the total SSA, respectively, and accounted for 21.53%, 63.09%, 15.39% of the total PV, respectively. The results of LP-N2A showed that the micro-pores and meso-pores in the Chang 7 shale oil reservoir provide the main SSA, while the meso-pores are the main contributors to the PV. Besides, the two different groups of the shale oil reservoir samples also features the significantly pore structure characteristics according to the new standard. For Group I, the micro-pores are quite developed, which contributes dominantly to the total PV, with the small pore diameter, it is difficult for the flow of the shale oil in it. As for the Group II, both the micro-pores and meso-pores are developed, which will favor the continuously and stable flowing of the shale oil in it.
Pore size distribution from MIP
The mercury intrusion and extrusion curves of MIP for the Chang 7 shale oil reservoir samples are shown in Figure 5. The significant differences in pore type, size and connectivity can be discovered because of the various testing results. The discharge pressure was between 2.10 MPa and 34.89 MPa, with an average of 14.81 MPa. The samples were well sorted, and the sorting coefficient of pore was between 0.39 ∼ 1.89, with the average of 1.08. The maximum mercury saturation of each sample ranged widely from 26.15% to 91.34%, with the average of 50.63%; and the mercury removal efficiency was between 0.02% ∼ 62.46%, with an average as low as 39.25%. The lower mercury removal efficiency was related to the development of a large amount of nano-pores in the shale and the poor pores connectivity. The pore sizes distribution and pore connection in the porous medium would significantly influence the pattern of the mercury intrusion and extrusion curves. According to discharge pressure and pore sorting coefficient, the fourteen samples were divided into two groups. It is very meaningful that the classification results of mercury intrusion parameters are consistent with those of LP-N2A. Compared with the Group I, the samples of Group II of show the lower discharge pressure, higher mercury removal efficiency and higher pore sorting coefficient (Table 1). The mercury intrusion and extrusion curves were shown in Figure 5. It can be found that the intrusion curves show a sudden drop feature and mercury pressure increases rapidly. For samples in Group I, the mercury intrusion curve had a significantly increased interval in the low pressure section, a nearly horizontal interval in the middle. This indicated that these samples were well sorted and had the similar pore size. As for samples in Group II, the increase trend of mercury intrusion curve is relative slow, and the curve platform segment is not developed. This indicated that the pores of samples in Group II were poorly sorted, complex in pore types, and different in pore size distributions. It should be noted that the larger sorting coefficient represents higher heterogeneity of the pore sizes, and indicates the existence of relative larger pores in the samples. Hence, the samples with bigger sorting coefficient have higher contents of relatively larger pores.

The capillary pressure curves of Chang 7 shale oil reservoir samples. (a) Group I, (b) Group II.
Pore structure parameters for the Chang 7 shale oil reservoir samples.

According to MIP results of Chang 7 shale oil reservoir samples, the pore diameter of some samples are distributed within a range of bigger than 1000 nm, and the curve peaks are in the large pore range, as shown in Figure 6. The pore size distribution of samples in Group I is relatively narrow in the range of 14.7 ∼ 122 nm. While the samples in Group II has a wider distribution range between 14.7 nm to 1426.8 nm, and the peak appears among 60 nm to 240 nm. Therefore, the MIP results demonstrate that the samples in Group I had smaller pore size but are concentrated and well sorted. The samples in Group II had dispersed pore size distribution with more meso-pores and macro-pores.

The pore size distribution of Chang 7 shale samples using porosimetry. (a) Group I, (b) Group II.
As a summary, the Chang 7 shale oil reservoir samples had the total PV ranges from 0.03 to 0.40 cm3/g(average of 0.17 cm3/g); and SSA varies from 7.13 to 50.72 m2/g (average of 26.49 m2/g). The detailed information about the total PV and the SSA, as well as the contributions from meso-pore and macro-pore are listed in Table 2 for each core sample. It is noted that the minimum pore diameter determined from mercury intrusion tests is 14.7 nm, which beyond the range of micro-pores. Besides, the meso-pore and macro-pore contributes 92.02% and 7.98% to the total PV, respectively, and 98.60% and 1.4% to the SSA, respectively. This means that the meso-pores are the main contributor to both the total PV and the SSA. The difficulty of entering the mercury in the fine pore increases, resulting in an increase in mercury saturation and a larger calculation result of the SSA and PV. Therefore, it is hard for the MIP method to measure the micro-pore and limited in characterizing the pores with relatively small radius. It is recommended to combine the results from both LP-N2A and MIP, which leads to the overall size distribution of shale oil reservoir samples from micro to macro pores.
The total PV and SSA, and their contents.

Discussion
Overall pore size distribution of shale oil reservoir samples
The previous research had investigated the combined mercury invasion and nitrogen adsorption methods to describe the characteristics of pore structure. It was verified that LP-N2A can represent accurately the pore size under 50 nm, but can hardly represent larger size pores in shale; while the mercury invasion measures larger size pores as a complementary method. The combined method resulted in an overall radius distribution for pores in shale. To achieve a proper combination of the results from the two methods, the connection point of 50 nm and 10 nm was recommend by Tian et al. (2012), respectively, to combine smaller pores from nitrogen adsorption measurement and larger pores from mercury invasion measurement. However, the authors believe that the connection points should be different variables for different samples, instead of a preset constant. Hence, the intersect point of the two measurements was applied in this research as the connection point. As shown in Figure 7, the two sets of measurements of pore diameter distribution were plotted in the same figure, in which the intersection point was automatically determined as the connection point (Gao et al., 2019). Both measurements were truncated at the connection point and then the smaller pores from nitrogen adsorption measurements and the larger pores from the mercury invasion measurements are connected as the overall size distribution. The pore size distribution characterized from mercury injection methods are lower than 100 nm, and intersects with that from N2 adsorption methods. This ensures the combination of both curves into one without gap. According to above new method, the connection points of fourteen samples are calculated. The results show that connection point is not a fixed value, but varies between 20.8 nm and 42.2 nm, with an average of 27.8 nm.

The pore size distribution from both LP-N2A and MIP. (a) Group I, (b) Group II.
The overall pore size distribution of pores is shown in Figure 8. It can be learned that the combined pore diameter distribution for the fourteen samples in Change 7 shale oil reservoir exhibited multimodal feature. Three peaks, indicating micro-pore, meso-pore and macro-pore from left to right, were observed around 3 – 7 nm, 20 – 60 nm, and 200 – 700 nm, respectively. For the pore structure acquired from the LP-N2A, the shale samples were divided into two types, and all of these shale samples features as bimodal (Figure 4), the differences between these two types are the pore aperture according to the secondary peaks are various. When it comes to the pore structure characteristics from the MIP, the pore structure still present as bimodal (Figure 6), and the differences is almost the same with that in the LP-N2A. However, it should not be ignored that not only the pore structure from the LP-N2A, but also that from the MIP cannot truly describe the pore size distribution in the shale. According to the comprehensive analysis of the pore size distribution, it can be found that the pore size distribution of various shale samples is almost the same, featuring as triple-peak pattern, and this is similar as reported by Yu et al. (2019).

The overall pore size distribution of the Chang 7 shale samples.
The fourteen samples were classified to two groups according to above classification. In Group I, the size distributions exhibited a bimodal feature in a narrow range from 1.71 to 100 nm, as shown in Figure 9(a). The trimodal feature of size distributions was captured in Group II shown in Figure 9(b), in which the pore diameter ranges from 1.71 to 1426.8 nm. For Group I, the pores mainly developed at two different size range, and the pore volumes for these two ranges are almost equal, indicating the smaller sorting coefficient and good pore connectivity. While for the Group II, the trimodal corresponds to the complex pore structure and larger sorting coefficient.

Two types of the overall pore size distribution of the Chang 7 shale samples. (a) Group I, (b) Group II.
The PV proportions and the SSA of micro-pore, meso-pore and macro-pore were calculated for all four samples, as shown in Figures 10 and 11, respectively. The PV of the samples distributed from 0.02 ∼ 0.26 cm3/g with an average of 0.11 cm3/g, and the SSA was from 3.48 ∼ 22.76 m2/g with the average of 11.20 m2/g. The average PV of micropore, mesopore and macropore were 11.77%, 67.08% and 21.15%, respectively, and the SSA of micropore, mesopore and macropore were 36.8%, 57.90% and 5.30%, respectively.

PV distribution diagram of Chang 7 shale samples calculated from overall size distribution. (a) Group I, (b) Group II.

SSA distribution diagram of Chang 7 shale samples calculated from overall size distribution. (a) Group I, (b) Group II.
For samples in group I, the average PV and average SSA are 0.05 cm3/g and 9.05 m2/g, respectively. These samples contained large amount of micropore and mesopore, which contributes 21.5% and 71.69% to the total PV respectively, and 47.06%, 51.48% to the SSA respectively.
Compared with samples in Group I, those in Group II contained certain amount of macro-pores, resulting in larger total PV (0.17 cm3/g as an average) and bigger SSA (13.34 m2/g as an average). The volume fraction of micro-pore, meso-pore and macro-pore in samples of group II are 2.05%, 62.50% and 35.51%, respectively. It is noteworthy that the 2.0 5% micro-pore contributes little to the total PV but 26.54% of the specific volume. Hence, it was concluded that the macro-pore can effectively increase the total PV, while the micropore and mesopore contribute the main SSA.
Influence factors on pore structure
There are various minerals in the shale reservoir, and some minerals present brittleness, which will produce natural fractures in the shale reservoirs, and these minerals are commonly named brittle minerals. In this study, the quartz, feldspar, carbonate and pytires are thought as the brittle minerals. The brittle minerals occupied a large proportion in Chang 7 shale oil reservoir. In the brittle minerals, the average compositions of the quartz, feldspar, carbonate minerals and pyrites are 30.51%, 16.9%, 20.6%, and 2.8%, respectively. The compositions of clay minerals are between 11.2% and 46.2%, with an average of 29.18% for the fourteen samples. The illite is the dominant clay minerals in these samples, and contents for the chlorite and kaolinite are less. Different brittle mineral and clay mineral contents lead to complex pore types and wide scale pore sizes (Table 3).
Basic information of the Chang 7 shale oil reservoir samples.


The correlations between the brittle minerals and PV and SSA.
Similarly, when pores feature larger PV greater than 0.12 cm3/g, it shows a significantly positive linear relationship between the PV and the brittle minerals and these six samples mostly fall into Group II. Figure 10 presents that the contents of macro-pores and meso-pores are important for the both two groups, while that for the micro-pores is very low. The increase of brittle mineral content contributes to the development of macro-pores with larger pore diameters. Therefore, it shows that the increase in brittle minerals corresponds to the larger the PV.
The overall relationship between the total PV and the clay minerals compositions is not obvious for samples in Chang 7 shale oil reservoir. However, as discussed before for the effects of brittle minerals, the correlation is obvious for the measurement with lower SSA than 10 m2/g and higher PV than 0.12 cm3/g, as shown in Figure 13. The SSA of the Group I sample is below 10 m2/g, and the PV of the Group II sample is basically greater than 0.12 cm3/g. The above analysis shows that the pores of samples in Group I are mainly micro-pores and meso-pores, and the pores samples in Group II are mainly macro-pores and meso-pores, while the content of micro-pores is very low. The higher the micro-pore content, the larger the SSA; and the more developed the macro-pore, the larger the PV. Therefore, for the Group I samples, the higher the clay mineral content, the more favorable development of micro-pores and meso-pores, and the larger the SSA of the pores. However, for the samples in Group II, as the clay mineral content increases, the macro-pores are less developed, resulting in a decrease in PV.

The correlations between the clay minerals and PV and SSA.
It can be found that the content of brittle minerals and clay minerals with the PV and SSA feature as the two-step styles with the knee points of 10 m2/g and 0.12 cm3/g respectively, and this has a great deal with the change of the sedimentary. Yu et al. (2019) studied the pore structure of the transitional shale in four different sedimentary environments, and found that the change of the sedimentary environments is commonly accompanied by the hydrodynamic intensity. The hydrodynamic intensity decides the content of the supplied terrestrial materials. The higher hydrodynamic intensity would carry large amount of terrestrial materials, then the content of the clay minerals in the shale would increased (Fu et al., 2018), leading to the decreased brittleness of the shale. The clay minerals can provide large amount of the pore volume (Li and Wu, 2015, 2019), this would be the main reason for the Group II shale samples features high PV. With the detailed study on the mineral composition, it can be found that the Group I shale samples contains no feldspar and carbonate, and this would be related to the change of salinity of the water, then the reservoir physical characterization of the shale changed. It can be concluded that the Group I shale mainly developed in the lacustrine deposit, while the sedimentary environment for Group II shale may change to the fluvial deposit.

The correlations between TOC contents and PV and SSA.
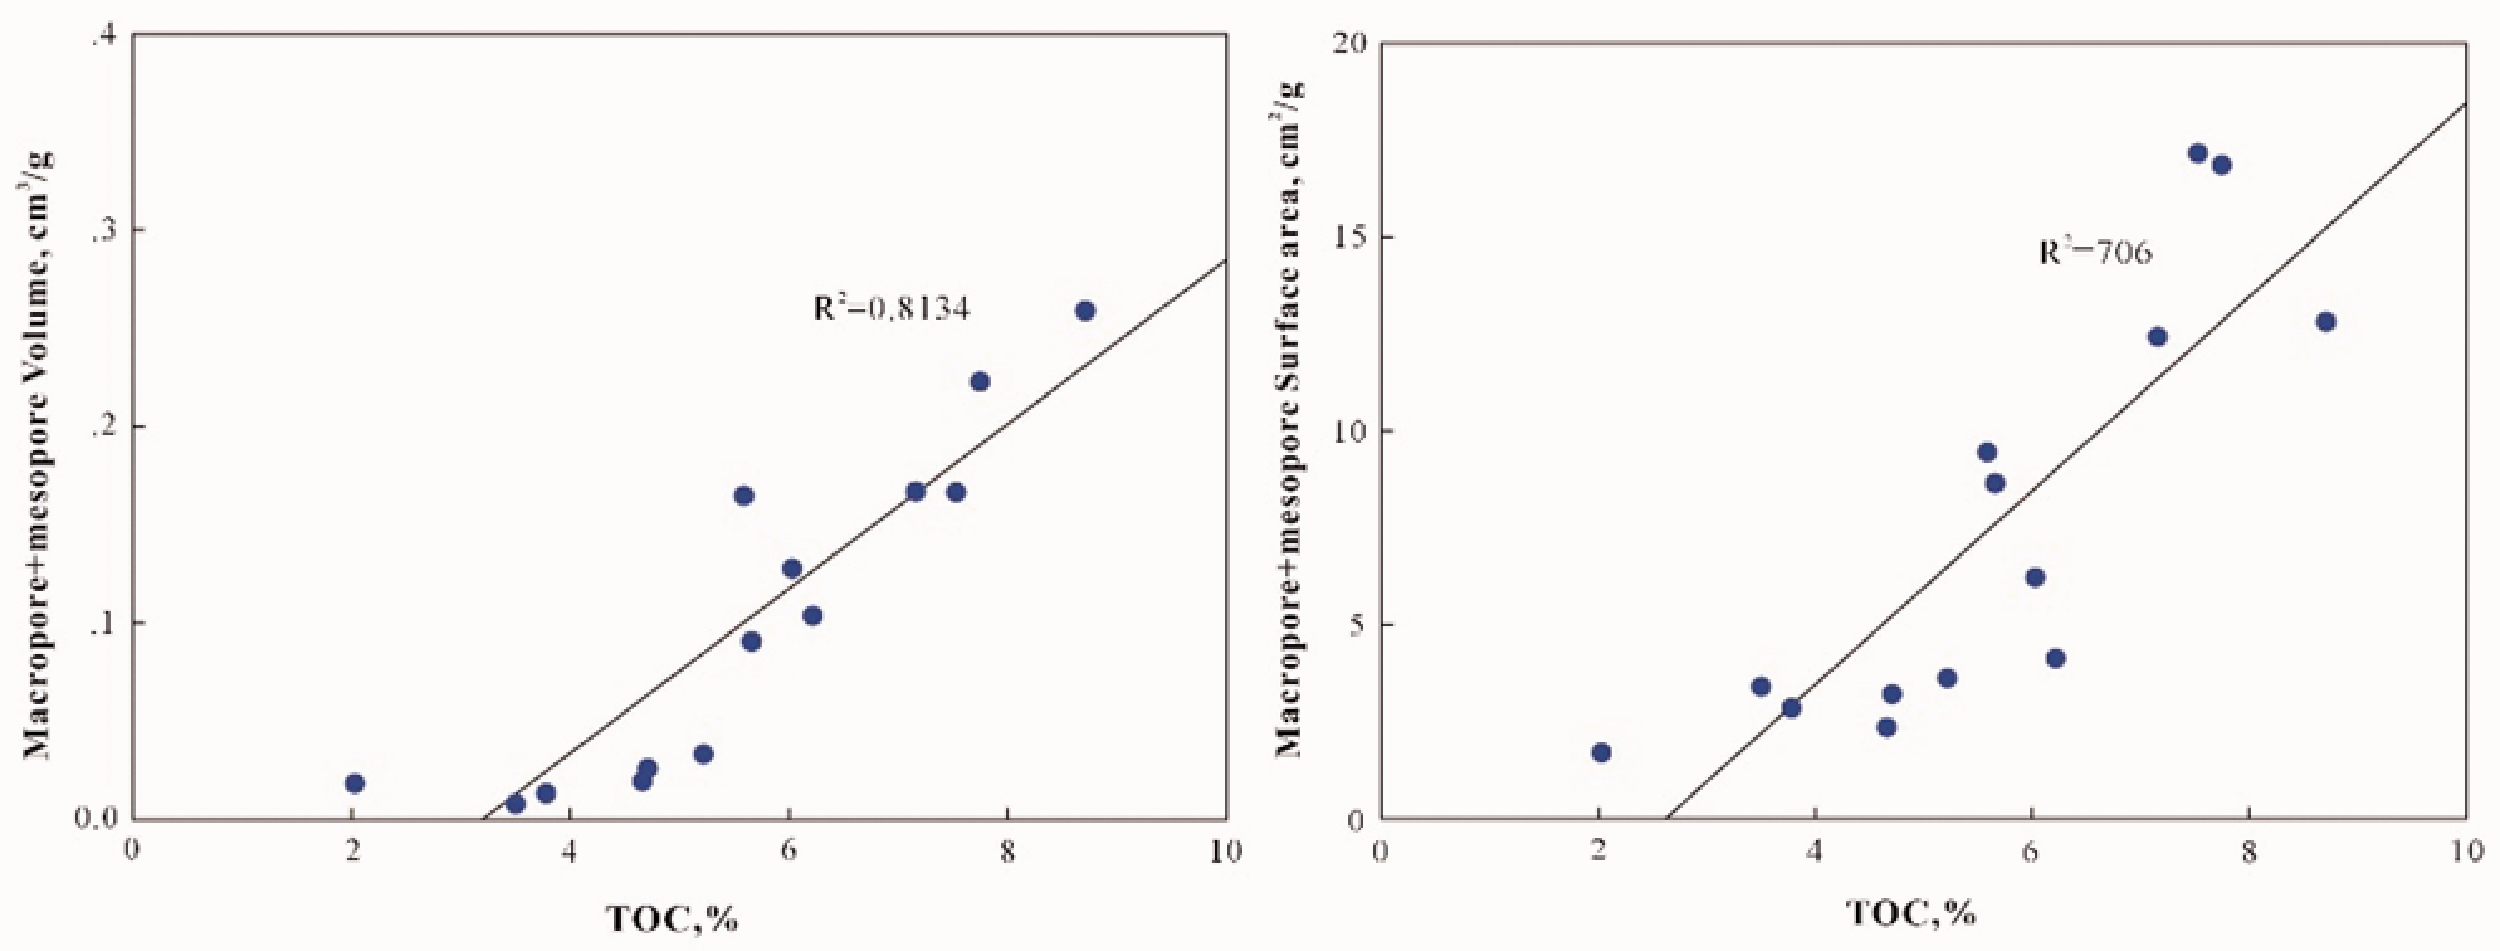
The correlation between the TOC contents and meso-pores and macro-pores.
Conclusions
The intergranular pores, intragranular pores and organic pores coexist in the Chang 7 shale oil reservoir. The intergranular pores are well developed, with good pore connectivity. A small number of micro-scale to nano-scale micro-cracks can also be found. The LP-N2A results are in accord with type IV isotherm and the H2 type hysteresis loop, and the type I isotherm and the hysteresis loop of H3 type. According to the results of MIP, Chang 7 shale oil reservoir is characterized by high displacement pressure, low pore sorting coefficient, low maximum mercury saturation and low mercury removal efficiency. The full scale pore distribution has the characteristics of double and triple peaks, which means various contents of different scale pores, and the well-developed meso-pore is the most important pore type for Chang7 shale oil reservoir. For measured samples Chang 7 shale oil reservoir, there is no obvious correlation between the SSA, the total PV and the brittle mineral, clay mineral content. However, the total PV and SSA are positively correlated with TOC content, and TOC mainly affects the total pores by controlling the development of macropores and mesopores for Chang 7 shale oil reservoir. Furthermore, if the SSA is lower than 10 m2/g, there is a conspicuous negative correlation between the brittle mineral contents and the SSA, and a positive correlation between the clay mineral contents and the SSA. As for the pores with larger PV than 0.12 cm3/g, there exists an obvious positive linear correlation between the PV and the brittle minerals and negative correlation between the clay mineral contents and the SSA.