
Abstract
Keywords
Introduction
Imbibition is a process in which a wetting phase in porous media is drawn in by capillary force to replace the nonwetting phase. As a quite common phenomenon, imbibition affects the distribution and flow of fluid in porous media. In the early 20th century, Lucas and Washburn established the classic Lucas-Washburn (L-W) imbibition model (Lucas, 1918; Washburn, 1921) for a wetting liquid, which has been applied in many areas. Imbibition continues to receive attention from scholars in geology, aerospace, and materials science at home and abroad, and many scholars have performed intensive research on the mechanisms and theoretical models of imbibition (Cai et al., 2010; Handy, 1960; Li and Zhao, 2012; Popescu et al., 2008; Zhmud et al., 2000).
In oil and gas reservoirs, imbibition is an important mechanism for the replacement, migration, and redistribution of oil, gas, water, and other fluids, so it inevitably has a profound impact on the formation and development of oil and gas reservoirs. Imbibition oil recovery is an important mechanism for enhanced oil recovery technologies such as fracturing stimulation and chemical flooding in oil reservoir development (Brownscombe and Dyes, 1952; Tong et al., 2015; Wang et al., 2020; Xiao et al., 2019; Xiao et al., 2020; Yang et al., 2001; Zhang et al., 2021; Zhu et al., 2002). Since water is a wetting phase during gas reservoir development, the negative effect of water imbibition is relatively prominent. Water imbibition brings about the unbalanced invasion of edge-bottom water into gas reservoirs. The resulting water-sealed gas constitutes an important mechanism for the unbalanced production of gas reservoir reserves and lower recovery efficiency. Along with the evolution of natural gas development technologies and hydraulic fracturing in recent years, the important role of water imbibition is relatively prominent in the development of fractured gas reservoirs, tight gas reservoirs, and shale gas reservoirs (Hu et al., 2016; Li et al., 2018; Tong et al., 2015; Yang et al., 2019; You and Kang, 2013).
Since the beginning of the 21st century, more attention has been given to imbibition recovery in oil and gas development (Ji et al., 2002; Morrow and Mason, 2001; Tavassoli et al., 2005). Chinese scholars joined the research on imbibition relatively late; on an engineering application-oriented basis, their research findings were mostly on the mechanism of imbibition oil recovery, the improvement of the recovery ratio, and other summaries of patterns (Li et al., 2007; Xu et al., 2015; Zhang, 1999). In the practice of gas reservoir development, many scholars have noticed the impact of imbibition on gas reservoir development. However, since their focus was primarily on the mechanism and qualitative understanding, in-depth theoretical research and quantitative evaluation of water imbibition are still inadequate (Jiang et al., 2012; Li et al., 2004; Zhu et al., 2004). Therefore, it is necessary to clarify the imbibition mechanism of water-driven gas reservoirs and to gain insight into the impact of imbibition on the water invasion and reserve utilization of gas reservoirs, based on which a theoretical model of imbibition can be built for the quantitative evaluation of the effect of imbibition on gas reservoir development.
Mechanism of water imbibition in gas reservoir development
Reservoir development is a process in which fluids such as oil, gas, and water flow rapidly and are extracted. Seepage driven by the pressure difference often plays a dominant role during development. In contrast, since fluid imbibition in reservoirs is a slow process, its importance is frequently overlooked. Moreover, because quantifying the imbibed volume and the impact of fluid imbibition on development is difficult, this issue has not been emphasized enough in related research. However, since oil and gas reservoir development often lasts for decades, the continuous long-term impact of imbibition on gas reservoir development should be emphasized. Theories and experiments are integrated to analyze and demonstrate the effect of imbibition on oil and gas reservoir development and to deepen the understanding of heterogeneous water invasion in gas reservoirs and the mechanism of water-sealed gas.
Imbibition during water invasion
During the development of water-driven gas reservoirs, water would invade reservoirs through fractures or high-permeability zones unevenly. The water-sealed gas resulting from gas reservoir segmentation constitutes the greatest risk in gas reservoir development. A physical simulation experiment on water invasion in fractured reservoirs intuitively demonstrates the process where water penetrates along the fractured reservoir and is imbibed by the surrounding matrix zone. The experiments reveal that the formation of heterogeneous water invasion and water-sealed gas can be simply divided into two processes by the dominant flow mechanism, as shown in Figure 1. In the first process, the water invades into fractures or high-permeability zones under the pressure difference. In the second process, the water seeps and invades into the surrounding low-permeability matrix zones through fractures or high-permeability zones after the water saturation rises in the high-permeability zones. In this process, the dominant driving force of the flow should be capillary force.

Experiment revealing water invasion and imbibition in water-driven gas reservoirs.
Figure 2 expands on how the water invades through fractures and is imbibed into the matrix. At the beginning of gas reservoir development, the water, fractures, and matrix reservoirs are in equilibrium, where the pressure in all parts is equal to the initial reservoir pressure

Diagram of the mechanism of water invasion and imbibition in water-driven gas reservoirs.
Experiment of water invasion
The typical geological model for a fracture-water driven gas reservoir is extracted based on geological and development examples of actual fractures in a water-driven gas reservoir. On this basis, a physical simulation experiment on the mechanism of water invasion in water-driven gas reservoirs is designed and implemented. As shown in Figure 3(a), the left side of the model is the aquifer, and the right side is a heterogeneous reservoir, which is composed of fractured zones (FZs) and matrix zones (MZs) with different physical properties. The FZs are located above and below the MZs. The MZs are divided into MZ 1 and MZ 2 according to different physical properties (indicated by the different filling colors in Figure 3(a)). According to the geological model, an experimental device and method for the development of fractured water-driven gas reservoirs are established. In the experiment, a large-scale core model with a single length of 50 cm and a total length of 200 cm is used to simulate different regions of the gas reservoir in Figure 3(a). The core holders were equipped with multiple pressure probes to monitor the gas reservoir pressure profile in real time. The experimental flow chart is shown in Figure 3(b), and the core parameters of different reservoir zones are shown in Table 1.

Geological model and schematic diagram for fractured water-driven gas reservoirs. (a) Geological model for fractured water-driven gas reservoirs. (b) Schematic diagram of the experiments.
Basic parameters of the gas reservoir and increases in water saturation in different areas after the experiment.

The experiment is briefly described as follows:
Nitrogen was injected into the core samples to 30 MPa to simulate the gas reservoir. Water was injected into a container, and a pressure of 30 MPa was applied. The volume of water was 15 times the pore volume of the samples. Water was connected with the samples. A production rate of 400 ml/min was set for the simulated gas well. During production, the pressure at different parts of the samples was recorded through the pressure measuring probe set on the core holder; gas, water production, and water breakthrough time were also measured. After the experiment, the samples were weighed to obtain the water saturation of different parts.
To focus on the mechanism of reservoir water invasion in the experiment and the effect of imbibition on water-sealed gas, this article does not specifically discuss the gas and water production of gas wells but instead analyzes the pressure of each part of the core during development and the changes in water saturation upon completion of the experiment.
After the experiment, the water invaded into different areas of the gas reservoir, resulting in an increase in water saturation (Table 1). The increment of water saturation in the FZs (cores 1 and 3) directly connected to the aquifer is the largest, reaching 46.34% and 47.47%, respectively, indicating that the water invasion in this area is the most serious. For MZ 2 (core 4), which is near the well and the farthest from the aquifer, the water saturation also reached 44.3%. MZ 1, surrounded by the FZs, had the lowest average water saturation, only 27.60%, which was considerably lower than those in other zones.
During the experiments, the dynamic pressure of the gas reservoir was monitored in real time to intuitively reflect the distribution of the residual sealed gas in the gas reservoir. The pressure fields at different stages are plotted as shown in Figure 4. Combined with the variation law of the water saturation and pressure field, the water invasion process of the gas reservoir can be determined. Water first reached the near-well MZ 2 (core 4) through the FZ (cores 1 and 3). Then, driven by the large pressure difference (Figures 4(c) and (d)), water invaded MZ 2 (the final water saturation increased by 44.43%). The mechanism of water invasion into MZ 2 is determined to be the seepage process driven by the forward pressure difference.
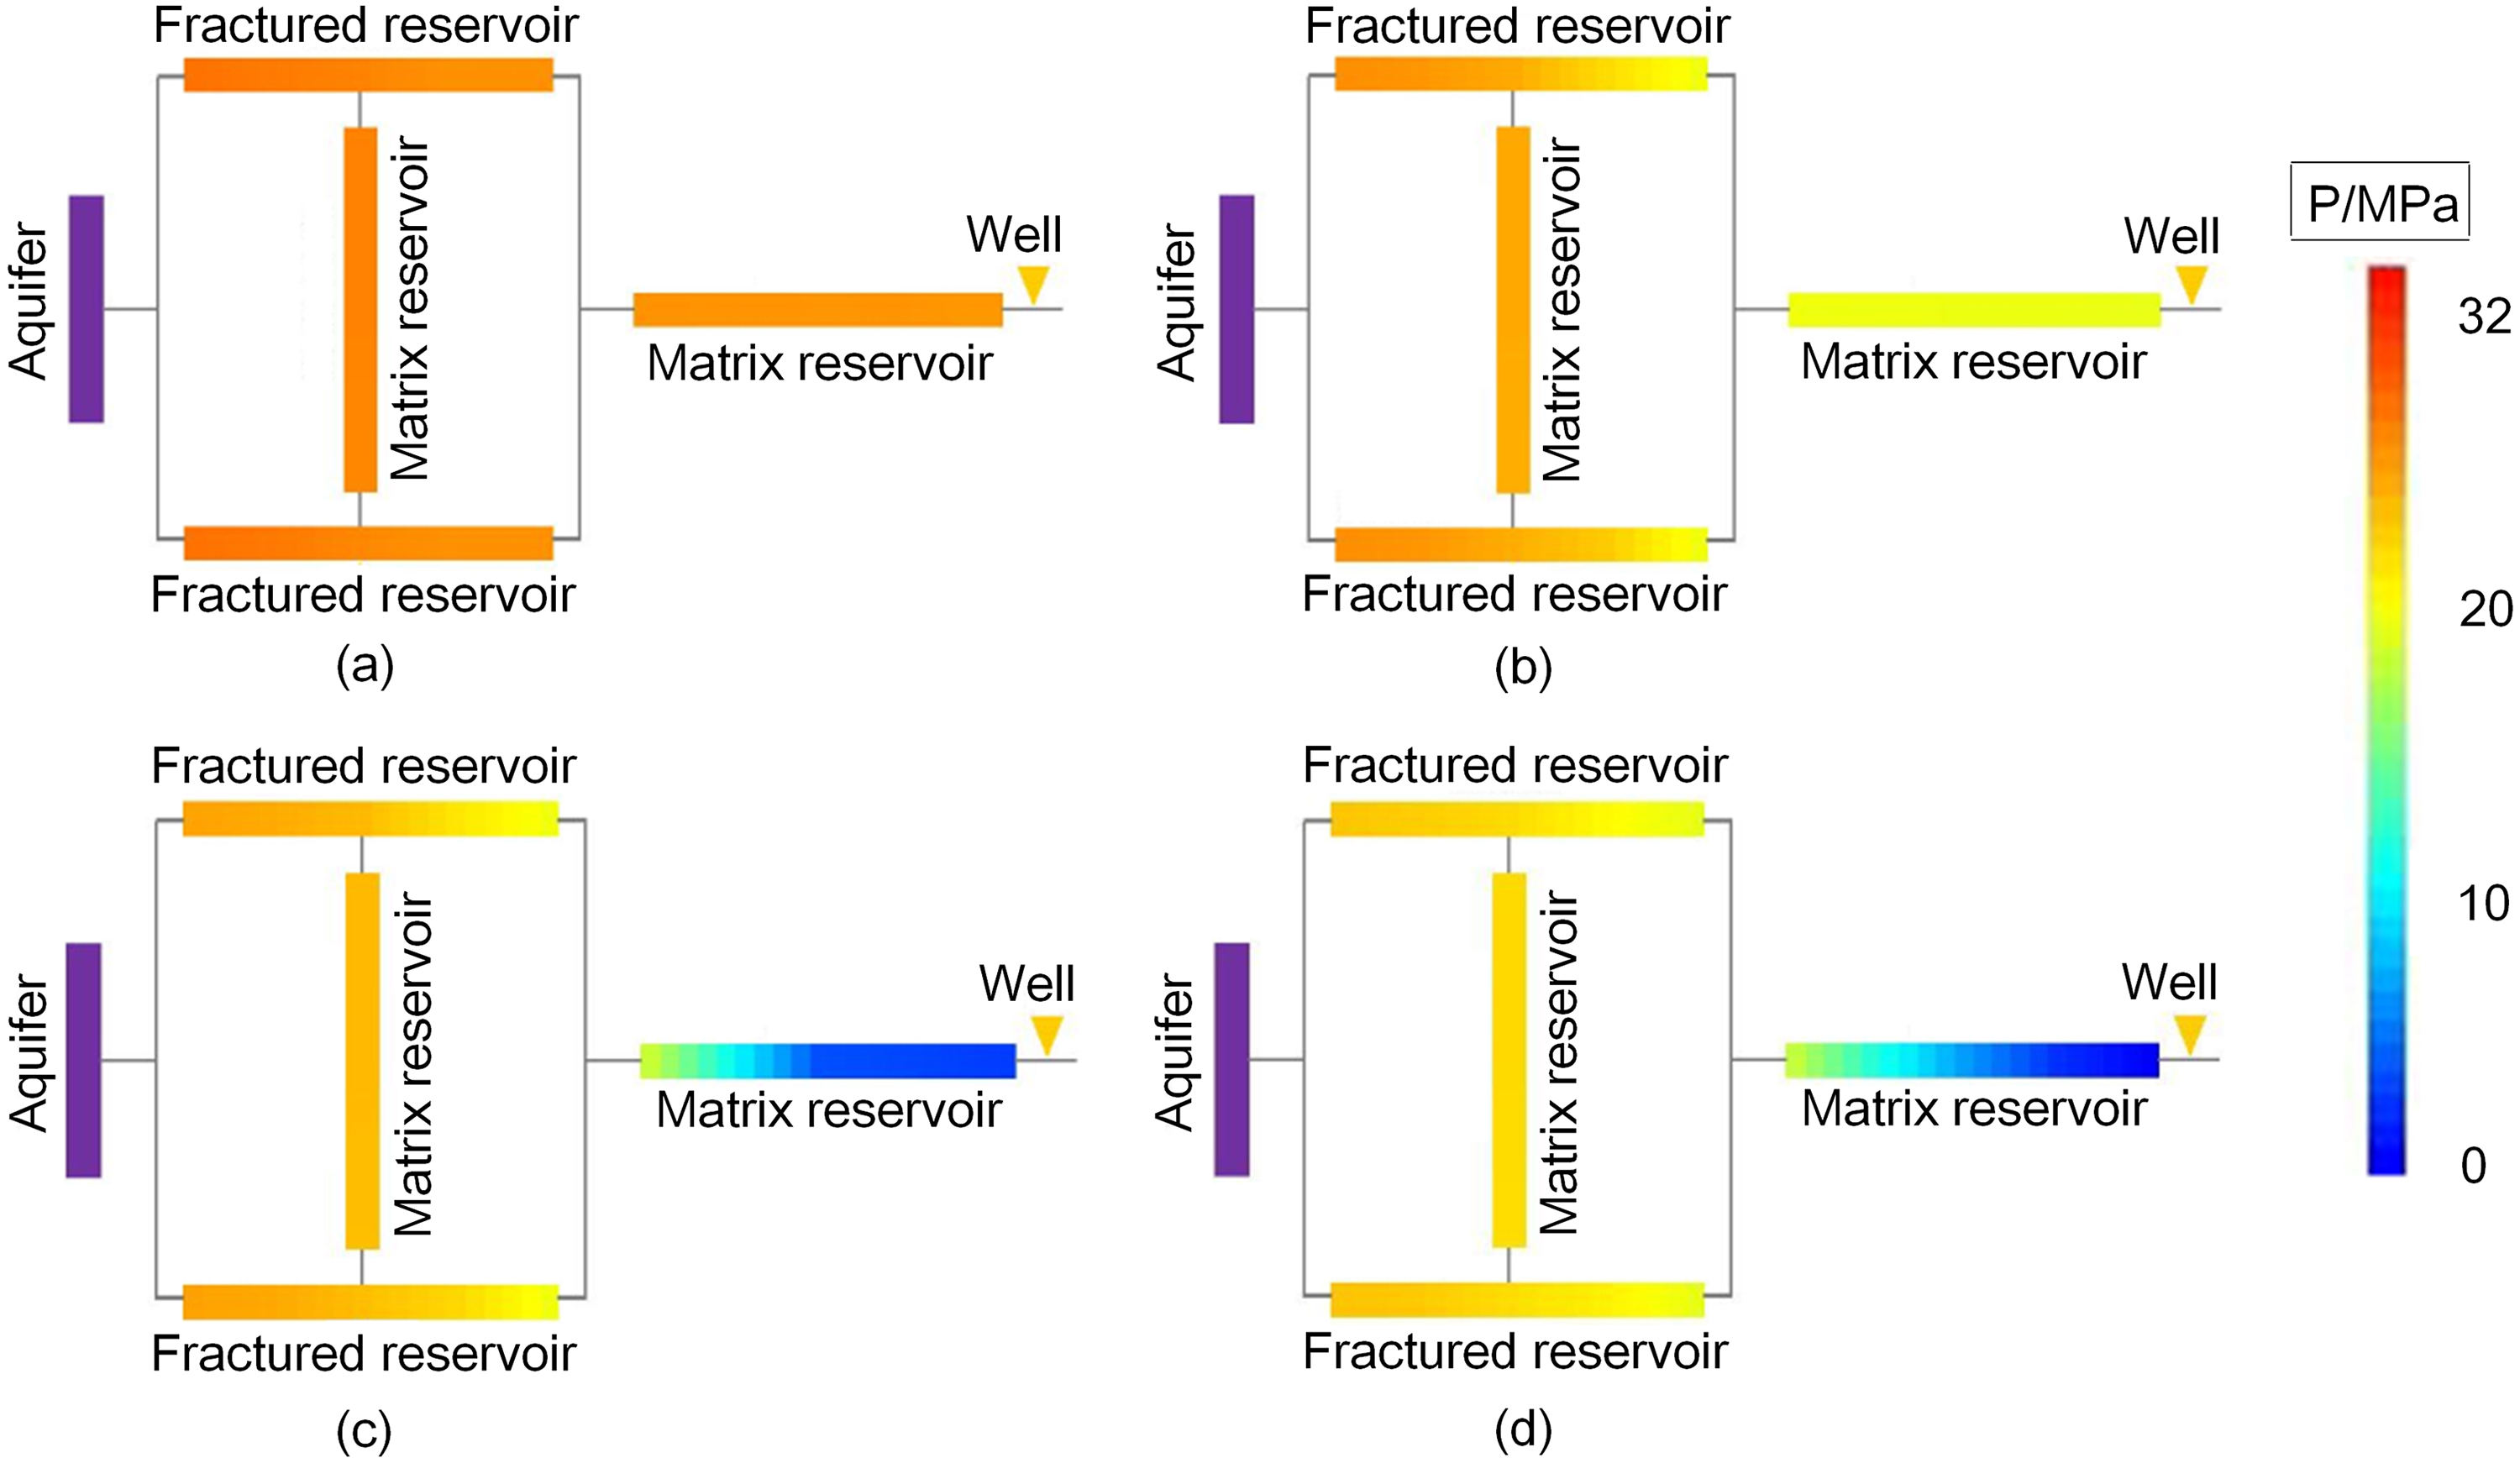
Diagram of the pressure distributions at different stages in the exhaustive development experiment of the water-driven gas reservoir.
The water invasion mechanism of MZ 1 surrounded by fractures is completely different from that of MZ 2 near the gas well. According to production pressure profile 4, the pressure of MZ 1 is always slightly higher than that in the connected FZ (cores 1 and 3) over the same period during gas reservoir production. Consistent with the theoretical analysis in Figure 2 above, the FZs are principal seepage channels for gas and water. The permeability of the MZ is far lower than that of the peripheral FZs, resulting in slow gas supply and lagging reserve utilization, causing the pressure in the MZ to always be higher than that in the peripheral FZ during production. According to the principle of seepage mechanics, it is impossible for gas and water to flow from the low-pressure FZ to the high-pressure MZ under the negative pressure difference. Therefore, capillary force-induced imbibition is the only driving force of water invasion in MZ 1. The water saturation of MZ 1 ultimately increases by 27.6% due to imbibition.
Figure 4 also shows that the residual pressure of MZ 1 surrounded by fractures is above 20 MPa before the end of gas reservoir production and that much of the remaining reserves cannot be developed due to water seals. The experiment fully reveals the formation mechanism of imbibition-induced water invasion and water-sealed gas in MZ 1 of the water-driven gas reservoir.
Based on the theory and experimental analysis above, the mechanisms of water invasion and water-sealed gas clearly may vary significantly depending on geological conditions or even in different areas of each gas reservoir. In particular, imbibition is often the principal cause for the formation of water seal zones in the low-permeability matrix zones of fractured water-driven gas reservoirs.
Imbibition experiment and theoretical model optimization
The L-W imbibition model is one of the classical models used to describe the imbibition of porous media. The equation is expressed as (Lucas, 1918; Washburn, 1921)
To simplify the model, gravity and inertial forces are usually ignored to obtain the following equation:


Imbibition experiment
To study the law of reservoir imbibition, sandstone reservoir samples were selected to carry out an imbibition experiment, as shown in Figure 5 and Table 2.
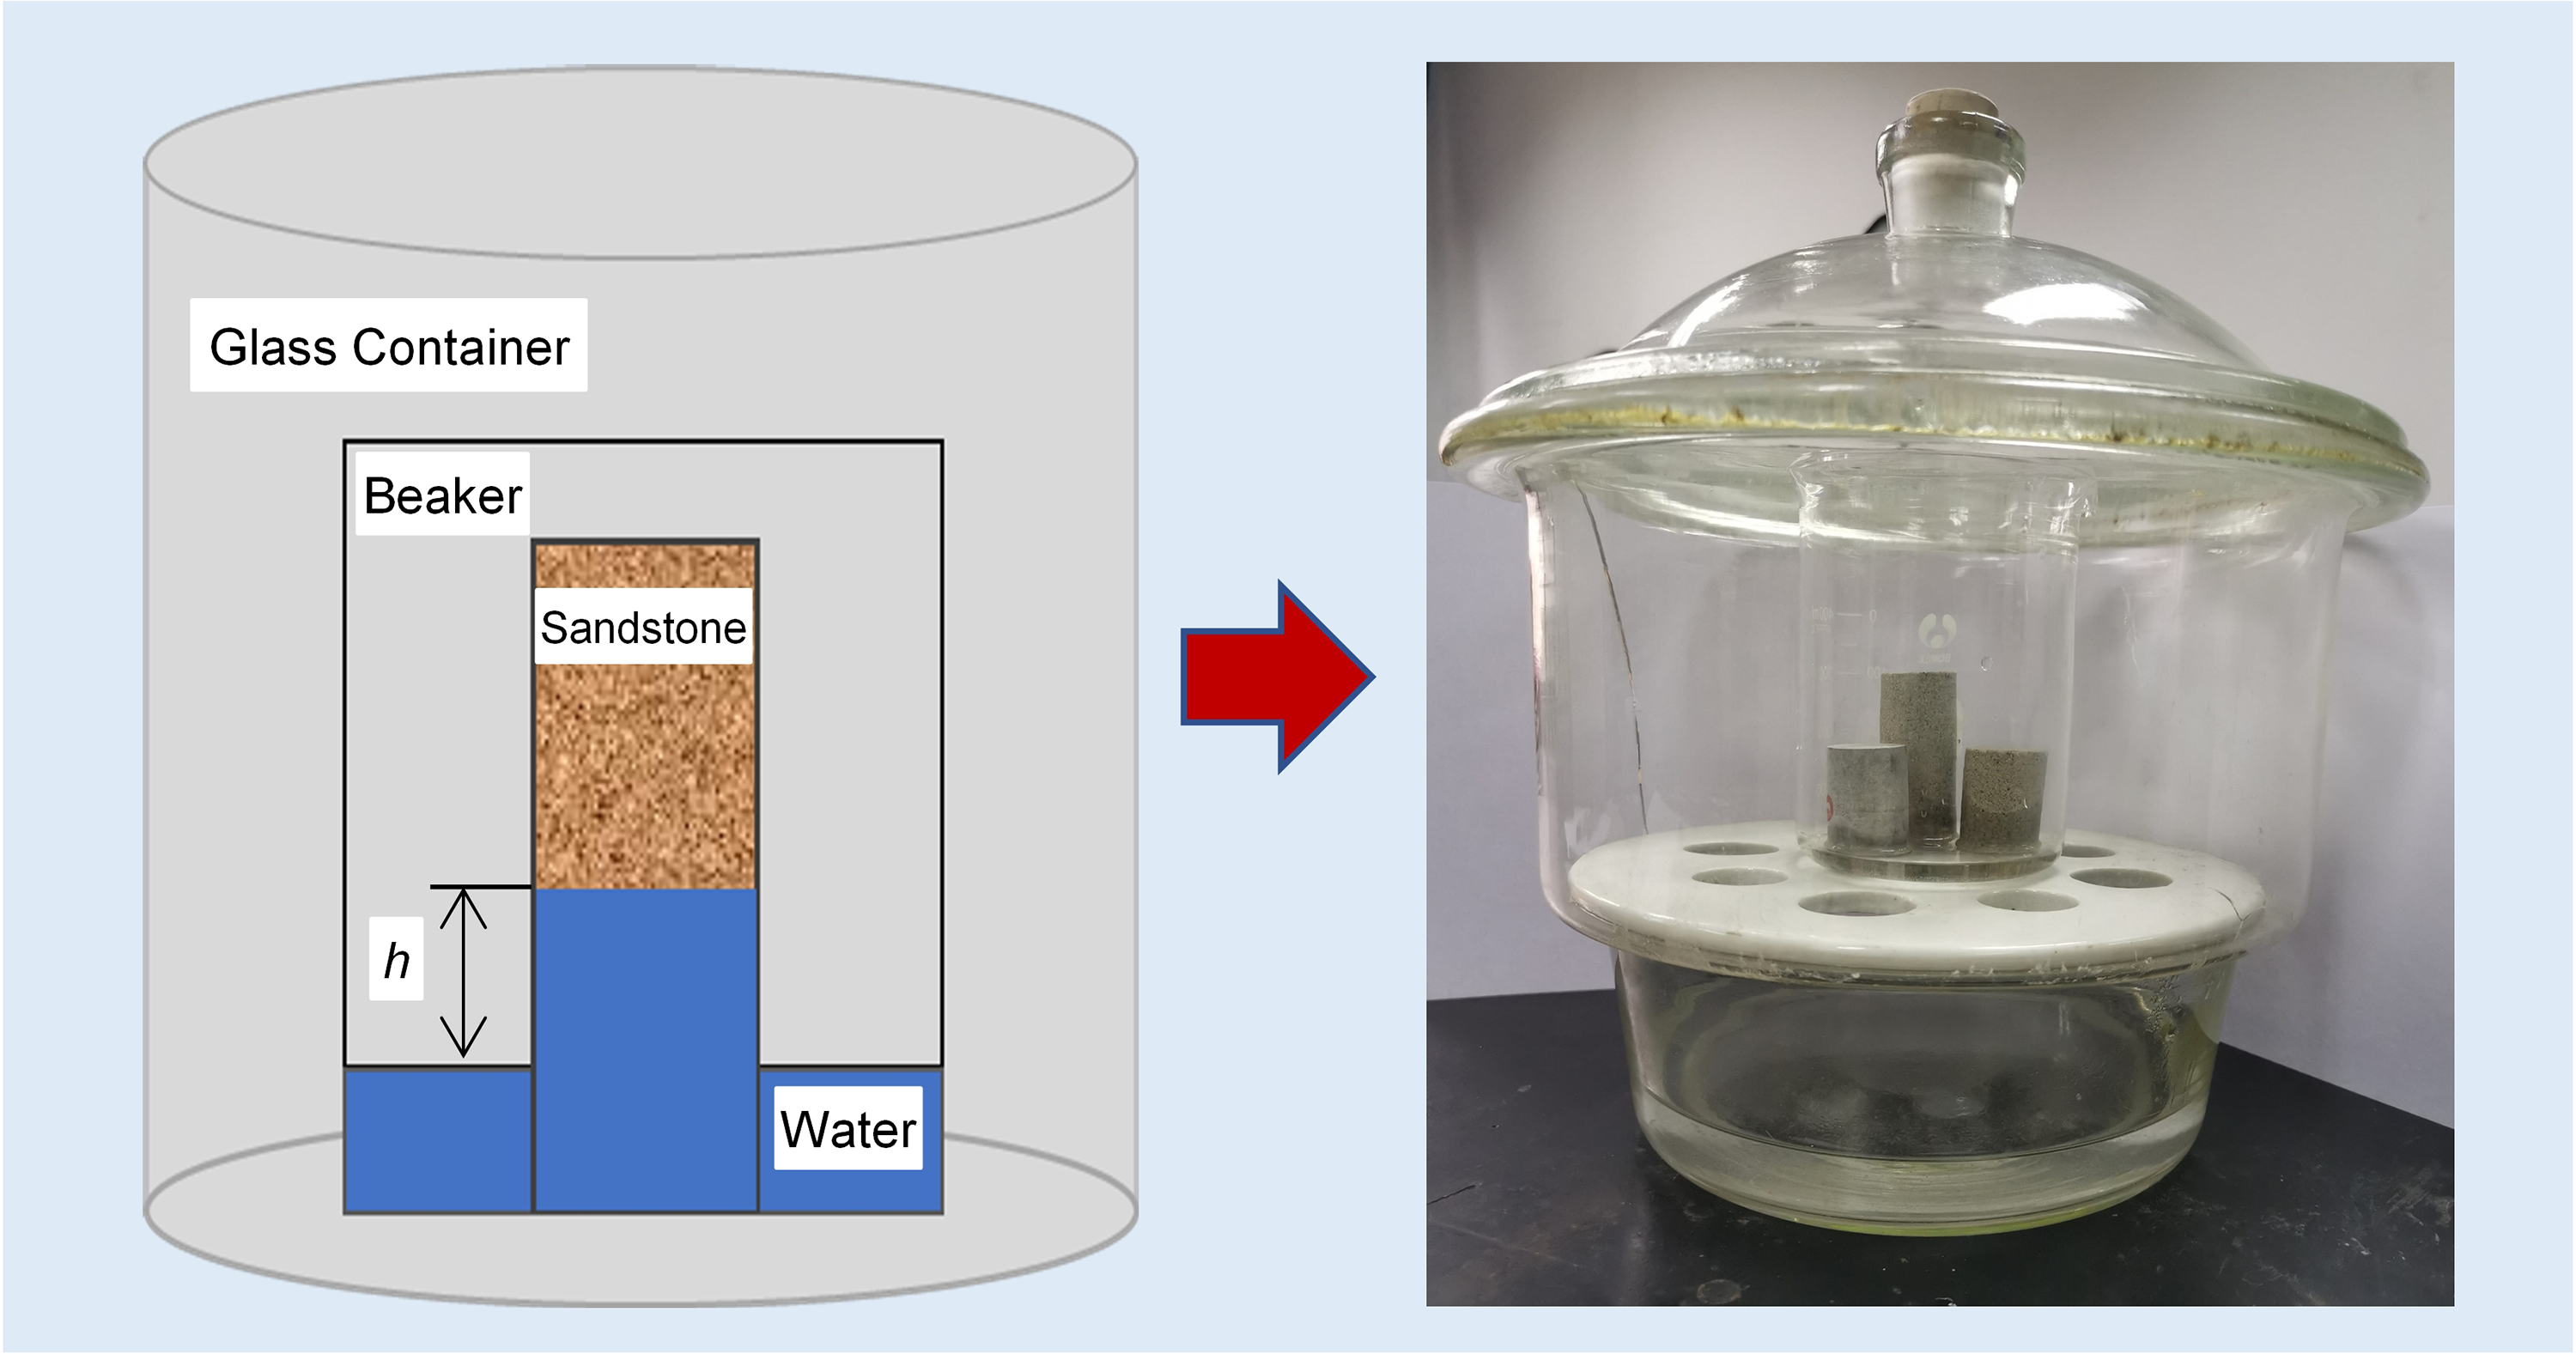
Schematic diagram and device picture for the gas-water imbibition experiments.
Basic parameters and partial experimental results of sandstone samples.

Figure 5 is a diagram of spontaneous imbibition. The experiment is briefly described as follows:
To prevent the imbibition water from evaporating, the experiment was carried out in a closed glass container. The rock samples were dried, the lower ends of the samples were immersed in a beaker filled with distilled water, and the immersion depth of the samples was 0.1 cm. During the experiment, the samples were weighed regularly, and the imbibition water of the samples was recorded. When the sample weight became stable, which indicated that the water imbibition reached the maximum, the experiment was terminated.
Figure 6 shows the quantity of imbibed water in the six specimens over time. At the beginning of the experiment, the amount of imbibition increased rapidly within approximately 700 min. In the later stage, due to the limited core length, the imbibition fronts gradually reached the upper edge of the samples, and the imbibition amount gradually approached a fixed value.

Water imbibition in the imbibition experiment.
Combining with the L-W imbibition model is helpful in better elucidating the imbibition law. According to Equation (4), when the imbibition does not reach the upper edge of the sample, there is a strong positive linear correlation between the water imbibition and the square root of time in all specimens.
Figure 7 shows the square root relationship between imbibition water saturation and time. At the initial stage of imbibition (700 min; 26, when converted to the square root of min), the water imbibed of all samples shows a strong linear positive correlation with the square root of time. After 700 min, the growth rate of water imbibition began to slow down, and the curves gradually became flat. The theoretical model (Equation (3)) also shows that for porous media with larger porosities and pore radii, the front rises faster. Therefore, for cores with higher porosity and permeability, such as S8 and S10, the earlier the imbibition front reaches the upper boundary, the earlier the imbibition saturation tends to stabilize.

Water saturation vs. the square root of time.
Optimization and experimental correction of the imbibition model
To simplify the calculation of imbibition, the L-W model assumes that the imbibition is a uniform piston-like process, and the water saturation in the imbibition area is 100%. However, experiments have confirmed that these assumptions are not correct t (Akin et al., 2000; Handy, 1960). In addition, for the L-W model, the average pore radius of porous media needs to be determined; however, for oil and gas reservoirs, the pore sizes are very different, and the accurate pore radius r is difficult to obtain. These factors bring inconvenience to the application of the L-W model in the reservoir.
Based on these, the L-W model needs to be corrected and optimized. The established relationship between the average pore radius and permeability of the reservoir solves the problem that the model must obtain the pore radius (Dullien, 1979; Peng, 1986):


Experimental test on reservoir physical properties and associated parameters.

Figure 8 shows the curves between the experimental water imbibition and the calculated value of the L-W optimization model (Equation (10)). The comparison shows that the correlation between the calculated results of the model and the measured results is very good. However, as shown in Figure 8, there are still differences between the calculated value and the measured value, and the application of the model in reservoirs needs to be corrected through experiments:

Experimental water imbibition vs. the calculated value of the L-W model.
The calculation of the imbibed water is of great significance for studies on water invasion volume and subsequent drainage and water control; however, in view of the assessment of water-sealed gas, evaluating the range or distance of imbibition is still necessary. The water saturation of the imbibition zone should be considered for the conversion; with Equations (7) and (11), the imbibed distance can be expressed as
Application
With the above-noted water imbibition model, it is possible to effectively evaluate the imbibed weight and distances of oil, gas, water, and other fluids in oil and gas reservoirs. Imbibition oil recovery, chemical replacement, and fracturing fluid damage can be evaluated during oil reservoir development. Technical support can be provided for the formulation of production strategies, such as evaluation of the water invasion extent, drainage, and water shutoff, during gas reservoir development. The application of imbibition theory in oil and gas reservoir development is elaborated with the water seal and water influx in the water-driven gas reservoir as an example.
Prediction of the water seal coverage
With cores S1, S6, and S9 as an example, the imbibed volume is measured through an imbibition experiment to identify the water saturation of the imbibition zone and to model the correction factor
As shown in Figure 9, the water seal coverage expands quickly during the preliminary stage of water invasion and slows later. The water seal coverage of reservoirs S1, S6, and S9 reaches 0.26 m, 0.40 m, and 0.54 m, respectively, within the first 100 days; 0.83 m, 1.27 m, and 1.72 m, respectively, in 1000 days; and 1.58 m, 2.44 m, and 3.29 m, respectively, in approximately 10 years. In low-permeability reservoirs, the segmentation effect of the water seal zone on the gas reservoir when its coverage reaches a few meters, as well as its negative impact on reserve utilization, is apparently not negligible. After the water seal is formed, the fluid in the low-permeability matrix zone needs a sufficient pressure difference (i.e. the so-called breakthrough pressure) to overcome the resistance of the water seal zone and to flow into the gas well or high-permeability zone.

Variation in the imbibed distance with time during water invasion.
Prediction of the breakthrough pressure in the water seal zone
A water seal zone in a low-permeability reservoir severely affects gas reservoir development because the water invasion process is almost irreversible; the rising water saturation brings about a sharp increase in seepage resistance, and the starting pressure needs to be overcome when the fluid starts to flow. The starting pressure or breakthrough pressure is a non-Darcy seepage phenomenon due to the capillary force and viscous force in two-phase flow, which has been studied by many predecessors. According to the theory, fluid flows only when the driving pressure is greater than the starting pressure of the reservoir (Gao et al., 2021; Ning et al., 2019; Wang et al., 2017; Xu, et al., 2015; Xu, et al., 2016). The study on the trend of the threshold pressure gradient after water penetrates into the low-permeability reservoir demonstrates that the threshold pressure gradient can be unified into the following general formula when the effects of water saturation and permeability are comprehensively considered (Xu et al., 2016):
The pressure difference required to break the water seal at reservoirs S1, S6, and S9 can be evaluated with consideration of the threshold pressure gradient parameters based on the coverage of the imbibition zone:

Breakthrough pressure of the water seal zone.
According to Figures 9 and 10, the coverage of the water seal and the threshold pressure gradient jointly determine the breakthrough pressure in the water seal zone. Even if the water seal zones formed in reservoirs with very low permeability, such as S1, are much narrower than those in reservoirs S6 and S9 with higher permeability, the greater threshold pressure gradient (2.16 MPa/m) would cause greater resistance after water sealing, which may result in a greater breakthrough pressure needed for reservoir S1. This finding also suggests that it is more difficult to break a water seal caused by water invasion in reservoirs with stronger heterogeneity and lower matrix permeability and that once water invasion occurs, it will be extremely difficult to utilize the remaining reserves.
Prediction of the imbibed water
The imbibition water influx in the matrix zone can be further calculated with consideration of the fracture parameters obtained in earthquakes or logging based on the abovementioned theories. The calculation results constitute a basic water control strategy, such as the drainage scale. An example is given to illustrate the calculation method of imbibed water. With the assumption that a fracture in contact with the matrix zone of a reservoir is 500 m in length and 30 m in height, the contact area between the fracture and the matrix zone is 1500 m2. Since imbibition occurs on both sides of the matrix zone in contact with the fracture, the imbibed water should be twice the volume calculated with Equation (11). Based on the above assumption, Figure 11 is created by determining the imbibed weight during gas reservoir development and converting it into the volume of water invasion.

Variation in the imbibed water volume with time during water invasion.
Figure 11 demonstrates the volume of imbibed water that invades the matrix zone of the gas reservoir through the fracture. As seen from the figure, the volume of water invasion reaches dozens of cubic meters at cores S1, S6, and S9 within the first 100 days; the highest water influx caused by imbibition reaches nearly 400 m3 in 1000 days; the reservoir water influx volumes are 144.4, 481.3, and 756.8 m3, respectively, in approximately 10 years. The water influx resulting solely from imbibition is clearly not negligible. In the event of gas reservoirs developing in fractures or high-permeability strips, the volume of water that invades by imbibition is greater after water breakthrough.
Conclusion
The theoretical analysis of fluid mechanics and the simulation experiment of gas reservoir development indicate that the mechanisms of water invasion and water-sealed gas may vary significantly depending on geological conditions. For water-driven gas reservoirs partitioned by fractures, water invasion can be divided into two processes, i.e., water breakthrough along fractures and water imbibition into the matrix. Imbibition plays an important role in water invasion and the water seal zone.
The L-W imbibition optimization model is derived and then tested and modified through water imbibition experiments. The experiments show that the imbibed water predicted by the optimization model deviates from but strongly correlates with the measurement. With the experimental correction, the applicability and accuracy of the model are remarkably improved, with a satisfactory calculation of the imbibed distance and imbibed mass in oil and gas reservoirs.
An application study is carried out based on the imbibition model. Example calculations are performed to predict the coverage of the water seal zone induced by imbibition during water invasion in the gas reservoir and to evaluate the breakthrough pressure and imbibed water in the water seal zone. The study reveals that a water seal zone with coverage of a few meters has a significant effect on the segmentation of the gas reservoir. Neither the breakthrough pressure for water-sealed gas nor the imbibition-induced water influx is negligible in low-permeability reservoirs. The research findings are of important theoretical and practical significance for the adequate recognition of the large impact of imbibition on the development of water-driven gas reservoirs, the assessment of the extent of water invasion, and the formulation of water control strategies.