
Abstract
Keywords
Edible oil and oilseeds sector occupies an important position in the agricultural economy of India. Moreover, India holds the fifth position in the vegetable oil economy of the world, next only to USA, China, Brazil, and Argentina. The demand for edible and non-edible oil is increasing due to the growing Indian population, rising income, and expanding urbanization. The domestic demand for vegetable oils has increased more than the domestic output, leading to a rise in the import bill. According to a data collected by the Solvent Extractors’ Association of India, from November 2011 to October 2012, edible oils worth INR 562.95 billion were imported constituting about half of India’s total edible oil consumption (Gulati, 2013). The import bill has increased by 380 per cent from 2006–2007 to 2011–2012, resulting in a huge current account deficit. At the end of the 12th Five Year Plan, the edible oil requirement of the country is expected to be 16.34 million tonnes while the production is estimated at 10.55 million tonnes in 2016–2017. The gap of 5.79 million tonnes in 2016–2017 will be met through imports (Jha et al., 2012).
At present, oilseeds account for 13 per cent of the gross cropped area, 3 per cent of the gross national product, and 10 per cent value of all agricultural commodities (Ramanathan, 2001). Crude palm oil and Refined, Bleached and Deodorized (RBD) palm oil together constitute 77 per cent of our consumption while the share of soya bean oil is 12 per cent. Despite being one of the largest oilseeds producers in the world, 50 per cent of India’s domestic requirement is met through imports. Prices of edible oils in the international market are more competitive. This together with nearly duty-free import structure has facilitated larger imports in India. Imports have also increased the per capita availability of edible oils from 5.8 kg in 1992–1993 to 14.5 kg in 2010–2011 (Bose, 2013).
The growth rate of domestic oilseeds production has been a meagre two per cent, year on year (Jha et al., 2012). The oilseeds industry faces challenges in terms of institutional and technological barriers. Cultivation of oilseeds is dependent on rainfall due to which there is high instability in production. Because of this uncertainty, it is cultivated on marginal lands which further leads to low yields. The problem is aggravated by the absence of technological advancement to develop high-yielding varieties of oilseeds. The domestic prices of oilseeds and edible oils are un-remunerative for farmers and the sector has been sustaining on government subsidies. Unless substantial improvement is brought about in yields and processing of oilseeds, facilitated with conducive trade policies, India’s dependence on imports is likely to be high.
On the global front, as per the OECD-FAO (2011) projections, prices in oilseeds complex will continue to trend upwards due to tightening in global supplies caused by high marginal cost of area expansion, profitability of competing crops, and environmental constraints. On the other hand, resumption in demand after the global economic crisis and robust buying by importing countries has resulted in wide demand-supply gap and fall in global stock to use ratio. It is estimated that the developing countries in Asia, mainly China, will continue to show an increase in vegetable oil consumption. Growth in consumption of vegetable oils in China and India is primarily for food use whereas in the US and the EU, biodiesel industry will be the main demand driver. Biodiesel production is expected to account for 16 per cent of the total consumption of vegetable oils. Hence, fundamental constraints of demand and supply mismatch, along with technological, environmental, and other social challenges faced by the oilseeds commodity chain have put pressure on the government, traders, and investors to combat expected price volatility and take appropriate measures for a more robust oilseeds sector. Local market prices are under pressure due to low stocks, anaemic domestic production, and dependence on imports.
The government has tried to bring price stability through market intervention. But such practices create uncertainties for cultivators and traders with respect to long-term strategies and ultimately affect the price structure of oilseeds relative to their competing crops. Therefore, forward-looking policies are needed to encourage stakeholders to continue cultivation and trading. Among other reforms, price risk mitigation instruments in the form of derivative contracts go a long way in improving the status of the stakeholders. The introduction of futures trading in oilseeds segment has resulted in better price realization to the farmers. Oilseeds futures contracts are the most liquid counters on commodity bourses. However, the impact of futures trading on the volatility of the underlying spot market is a debatable issue since on many occasions physical market prices have exhibited heightened volatility in the presence of high trading volume in futures market. The present study investigates the volatility dynamics of spot and the futures market of select oil and oilseeds commodities. Theoretically, speculative activity in the futures market is purported to have two opposing effects on the spot price volatility:
Futures Trading Stabilizes Spot Market Prices
Spot traders are able to hedge their positions only because of additional liquidity that comes from the speculators present in the futures market. Additional liquidity in futures market reduces the impact cost or the cost of executing a transaction since the buyers and sellers constantly have opportunities for buying and selling in the futures market at a reasonable cost. In the absence of liquidity, they face high transaction cost. A liquid futures market enables traders with physical possession of the commodity to hedge against unfavourable movements in prices. The risk is transferred from hedgers to speculators who are willing to take the risk to earn more profits. Since risk is transferred, spot price volatility may reduce because the need to incorporate risk premium in spot prices is eliminated (Figlewski, 1981). Speculation in futures market will not destabilize the prices if the speculators are a well-informed lot. They will buy when the prices are low, pushing them up, and sell when the prices are high, pulling them down and eventually lead the prices to their mean level. Therefore, such profitable speculation reduces spot market volatility.
Futures Trading Destabilizes Spot Market Prices
Futures trading may be considered to increase spot price volatility because any news about changes in fundamentals is assimilated in futures prices more readily as they are more informationally efficient. Through the arbitrage process, the price changes are transmitted to the spot market of the same underlying causing the volatility to increase. The presence of uninformed speculators brings in herd behaviour in the markets making them more volatile. Market manipulation and fraudulent activities are easier to perpetrate in futures market. By building large positions in futures markets, speculators are able to capture the market and manipulate and influence future price. Formation of cartels and trading through related entities is also prevalent wherein futures market players collude with spot market traders and hoard physical stocks. It creates artificial scarcity of the commodity resulting in price distortion.
Volatility and Information: Study of Volatility Spillover
The volatility of asset prices is also related to the information flow in the market. Spot price volatility is bound to change if the informationally efficient futures market increases transmission of information. The volatility in returns manifests that information is flowing in the market. The increase in spot price volatility in the presence of futures trading reflects that there is improved flow of information brought about by a large number of traders and speculators participating in futures market. If futures market leads in the process of transmission of information, it will cause spillover of volatility to the spot market. In this context, the reverse is also true if spot market is more efficient in the transmission of information.
Indian futures markets have faced allegations due to its destabilizing impact on the physical market volatility, especially in 2006–2007, when futures trading of a few agricultural commodities (wheat, urad, tur, and rice) were suspended due to increase in food grain inflation during that period. Since futures trading has been blamed for increasing the spot price volatility, the following issues have been empirically investigated in the present study:
Volatility spillover from futures to spot market or vice versa. Impact of futures trading activity on spot price volatility by examining the relationship between spot price volatility, futures trading volume, and open interest.
LITERATURE REVIEW
The diverse views on the impact of futures market volatility on the volatility of spot markets have been explored by academicians, researchers, and policy makers to evaluate the past performance and chart the path for a more efficient and vibrant derivatives markets of commodities and financial products. Studies which have made a notable contribution in this area are discussed briefly.
Volatility Spillover
When volatility of one market influences the volatility of another market, volatility spillover occurs. It helps in identifying the market which leads to the assimilation of information and transmission of the information to the other market. With increased inflow of information in one market, its volatility increases, and due to the arbitrage process, volatility spills over to the other related market. Liao and Williams (2004) pointed out that news or volatility is transmitted through two channels. The first is the increase in the volatility of variance of returns or price changes and the second is the increase in volatility of variance of forecast error or noise. Volatility spillovers from one market to another occur because of the fact that speculative price changes are linked with higher moment dependencies (Bollerslev, Chou, & Kroner, 1992). According to Chan, Chan, and Karolyi (1991), volatility spillovers can provide an alternative measure of information transmission if the return analysis becomes inconclusive. Therefore, the study of the relationship between spot and futures returns (first moment) is expanding towards examining higher moment dependencies in the form of time varying spillover of volatility between markets through which the impact of one market on another can be assessed. The hypothesis in volatility spillovers is to test the lead–lag relation in volatilities of two or more markets.
Research on how volatility of one market affects the process of the volatility of another market, that is, the study of the volatility spillover effect, has made use of GARCH family models which best capture the time varying nature of volatility in financial markets. Named as ‘meteor showers’, the theory of volatility spillovers between markets based on GARCH models was introduced by Engle, Ito, and Lin (1990). Chan et al. (1991) studied the intraday volatility spillover between S & P 500 stock index and stock index futures market using bivariate GARCH model. Strong dependence in the volatility of price changes in cash and futures market was observed in their study as compared to dependence in price changes themselves. Though the relationship between cash to futures returns provided some predictability, a stronger relationship was observed between cash market and futures market volatility. The results have an important implication that due to inter-market volatility dependence, it is possible to predict the volatility of a market on the basis of price innovations or shocks that originate in the other market. Koutmos and Tucker (1996) applied the Exponential GARCH (EGARCH) model to daily data to study volatility spillover and asymmetric effect of volatility. Their findings indicated that volatility spillover was from futures to spot market and in both markets volatility increased more with bad news compared to good news. Spot market innovations had no impact on futures market. Tse (1999) observed bidirectional volatility spillover in Dow Jones Industrial Average (DJIA) spot and futures market on analysing minute by minute data using the bivariate EGARCH model. However, DJIA futures exhibited greater informational efficiency as spillover was more from futures to spot market.
Mukherjee and Mishra (2006) studied volatility spillover in Nifty spot and futures index market in India and examined whether there was any variation in the relationship at the time of the release of macroeconomic and firm-specific information. The authors introduced a dummy variable representing the release of different information, for example, activities of Foreign Institutional Investors (FIIs), Mutual Funds (MFs) or asset acquisition and disposal. The results exhibited that in general there was bi-directional volatility spillover but the direction of causality was stronger from spot to futures market. The analysis of the impact of the release of firm-specific information on the lead–lag relationship in volatility of NIFTY spot and futures index indicated that the leading role of futures market was weak after the release of firm-specific information. In order to capture the asymmetric behaviour of volatility and test the volatility spillover effect on individual stocks and their futures traded on NSE, EGARCH model was applied by Mallikarjunappa and Afsal (2010). Their study reported findings similar to Karmakar (2009) that both markets were information efficient but futures market caused greater volatility spillover to spot market for the majority of stocks. However, for a few stocks, the reverse was true.
Understanding of the volatility transmission process in commodities helps the decision makers in devising new risk-management strategies. The information transmission process between Malaysian crude palm oil futures and its cash market at mean and volatility level during 1990-2003 was tested by Azizan, Ahmad, and Shannon (2007) using bivariate Autoregressive Moving Average EGARCH (ARMA-EGARCH) model. The analysis revealed bidirectional volatility spillover between futures and cash market with the impact from futures to cash being stronger than cash to futures. Bidirectional volatility spillover in crude oil futures and cash market was also reported in studies by Chan et al. (1991), Lin, Chen, Hwang, and Lin (2002), Yu (2000), and Yakob (2005).
Adopting similar methodology, Mahalik, Acharya, and Babu (2009) examined volatility spillover in four spot and futures indices of Multi Commodities Exchange (MCX), namely agriculture, energy, metal futures price index, and aggregate commodity index from 2005 to 2008. The results of bivariate EGARCH for testing volatility spillover gave an indication of bidirectional volatility spillover with greater strength from futures to spot market for metal, energy, and aggregate commodity index. However, in the case of agriculture index, spot market was a source of volatility for futures market pointing to the fact that agriculture futures market was not being used by farmers because of lack of incentives, low quality of technology, or risk of relying on unjustified rising prices perpetrated by speculators. This was contrary to the results of volatility spillover studied by Srinivasan and Ibrahim (2012) on similar indices. Using similar bivariate EGARCH model, it was observed that there was a stronger volatility spillover from spot to futures markets represented by agriculture, metal, energy, and composite commodity indices and, therefore, traders in futures market would have to watch out for the volatility in the spot market. Srinivasan and Ibrahim (2012) applied the same methodology on gold spot and futures and revealed a greater ability of gold spot market in exposing new information through its channels of innovation, and at the same time, pointing to less effectiveness of futures market in disseminating new information. Shihabudheen and Padhi (2010) tested volatility spillover on highly liquid commodities traded on MCX and NCDEX including gold, silver, crude oil, castor seed,
Impact of Futures Trading Activity on Spot Price Volatility
Earlier studies on the impact of futures trading on cash price volatility focused on the paradigm of the introduction of futures trading. They compared cash price volatility before and after the introduction of futures trading (Gulen & Mayhew, 2000). However, market behaviour is influenced by a number of factors and so it is wrong to attribute the differences in market behaviour pre- and post-futures to the presence of futures market. As pointed out by Stein (1987), the impact of more or less speculation from an established futures trading on cash market volatility is far more relevant to the real world than to the introduction of futures market. Researchers like Bessembinder and Seguin (1992) and Adrangi and Chatrath (1998) examined the issue in a different manner and analysed how the level of futures trading activity (futures trading volume and open interest) affected the volatility of cash market prices.
Figlewski (1981) modelled the volatility in Government National Mortgage Association (GNMA) pass-through certificates, cash prices by incorporating factors like volatility in related markets, futures market activity in the form of open interest and current trading volume, GNMA prices, liquidity, and breadth of GNMA cash market. By performing simple regression analysis, evidence was found that increased liquidity, volume of cash market activity, and lower average prices had a stabilizing impact on the market whereas futures market activity increased the price volatility. The possible explanation for this was that GNMA dealers in cash market were more informed than the new class of traders in futures market who were less informed and less experienced than the spot market dealer. Hence, the additional noise in futures prices was being transmitted to cash market causing increased volatility.
Bessembinder and Seguin (1992) studied the interrelationship between equity volatility and futures trading activity along with spot trading volume for S&P 500 index from 1978 to 1989. The components of futures trading activity which included trading volume and open interest were separated into unexpected and expected component using Autoregressive Integrated Moving Average (ARIMA) (0, 1, 10) formulation. Regression results for daily S&P 500 return standard deviation on the spot and future trading volume indicated that equity volatility had a positive relation with contemporaneous futures trading shocks or the unexpected component of futures trading activity, meaning thereby that heavy trading in futures market is destabilizing. However, there was a negative relation between expected open interest and expected trading volume indicating that equity volatility was reduced when the expected level of trading activity was high. Their findings that futures trading helped in improving the depth and liquidity of equity markets were consistent with the theories such as Grossman (1988). Studies by Gulen and Mayhew (2000), Gupta and Kumar (2002), Thenmozhi (2002), and Chen, Han, Li, and Wu (2012) also found evidence of a decrease in spot index price volatility after the introduction of index futures.
Following Bessembinder and Senguin’s methodology, Chatrath, Song, and Adrangi (2003) re-examined the impact of futures trading activity on spot price volatility of S&P 500 index. The study found strong evidence of an increase in price volatility with the increase in participation of institutional traders, whereas there was no evidence of a destabilizing impact of positions held by speculators and small traders.
The response to trading in commodity futures has been more intense as compared to equities because commodity prices are very sensitive for the agricultural and industrial sectors in an economy. Commodity futures markets, often accused of speculation and gambling, have faced opposition from various segments especially the farm sector. Pashigian (1986) measured geographic opposition from grain traders towards futures trading and suggested that opposition had diminished over time. The study by Weaver and Banerjee (1990) did not support the hypothesis that futures trading led to dynamic instability in cattle prices, even though it could not be inferred that they gave stability to cash prices. Yang, Balyeat, and Leatham (2005) applied the methodology earlier used by Bessembiner and Senguin (1992) on corn, soya bean, wheat, cotton, sugar, hogs, and live cattle data from 1992 to 2001. The analysis was restricted to unexpected futures trading activity since the impact of expected component was already embedded in the spot prices. The results indicated that unexpected futures trading activity (open interest and trading volume) caused cash price volatility, thus strengthening the ground for growing criticism towards commodity futures for their role in aggravating price volatility.
Not many Indian studies have used this methodology in the commodities market, wherein futures trading activity is linked to spot volatility. A recent study by Sehgal, Rajput, and Dua (2012) examined the period after the setting up of national level commodity exchanges in India which gave momentum to comm-odity futures trading. The destabilizing effect of futures trading activity on spot volatility was indicated by Granger causality flowing from futures trading activity to spot volatility for all commodities except pepper and barley.
Hence, what emerges from the discussion of empirical studies is that though futures trading has been in existence for many years, its impact on spot volatility has been inconclusive. A few prominent studies, which have reported the destabilizing role of futures trading on spot markets volatility, are by Figlewski (1981), Chatrath, Ramchander, and Song (1996), Adrangi and Chatrath (1998), Chatrath et al. (2003), Bhargava and Malhotra (2007), Yang et al. (2005), and Sehgal et al. (2012). Some studies have, on the contrary, found evidence that trading in futures market does not destabilize the spot market (Bohl & Stephan, 2012; Darrat & Rahman, 1995; Pashigian, 1986; Weaver & Banerjee, 1990). In India, research is still very limited in the area of agricultural commodities especially oil and oilseeds segment which makes it all the more pertinent to explore these issues empirically especially when the modern research tools are more robust and capable of capturing the changing trends of market variables.
RESEARCH DESIGN
Profile of Commodities Selected

Daily closing spot and near months futures prices have been converted into log returns to reduce the effect of heteroscedasticity. It has been done by taking the first difference of spot and futures log prices called logarithmic returns. Log transformation by taking first difference of log prices helps in making a non-stationary series as stationary and valid conclusions can be drawn from analysis of stationary data.

In addition to daily spot and futures prices, data on futures trading activity has been used to study the impact of futures trading on spot prices volatility. Following the methodology adopted by Bessembinder and Seguin (1992), Darrat and Rahman (1995), and Yang et al. (2005), the components of futures trading activity, viz. futures trading volume and open interest have been used as explanatory variables and their data is downloaded from the exchange itself. Both these variables are indicative of the behaviour of futures market participants. While futures trading volume reflects movements due to speculators activity, open interest movements primarily reflect hedgers activity (Bessembinder & Seguin, 1992; Working, 1962).
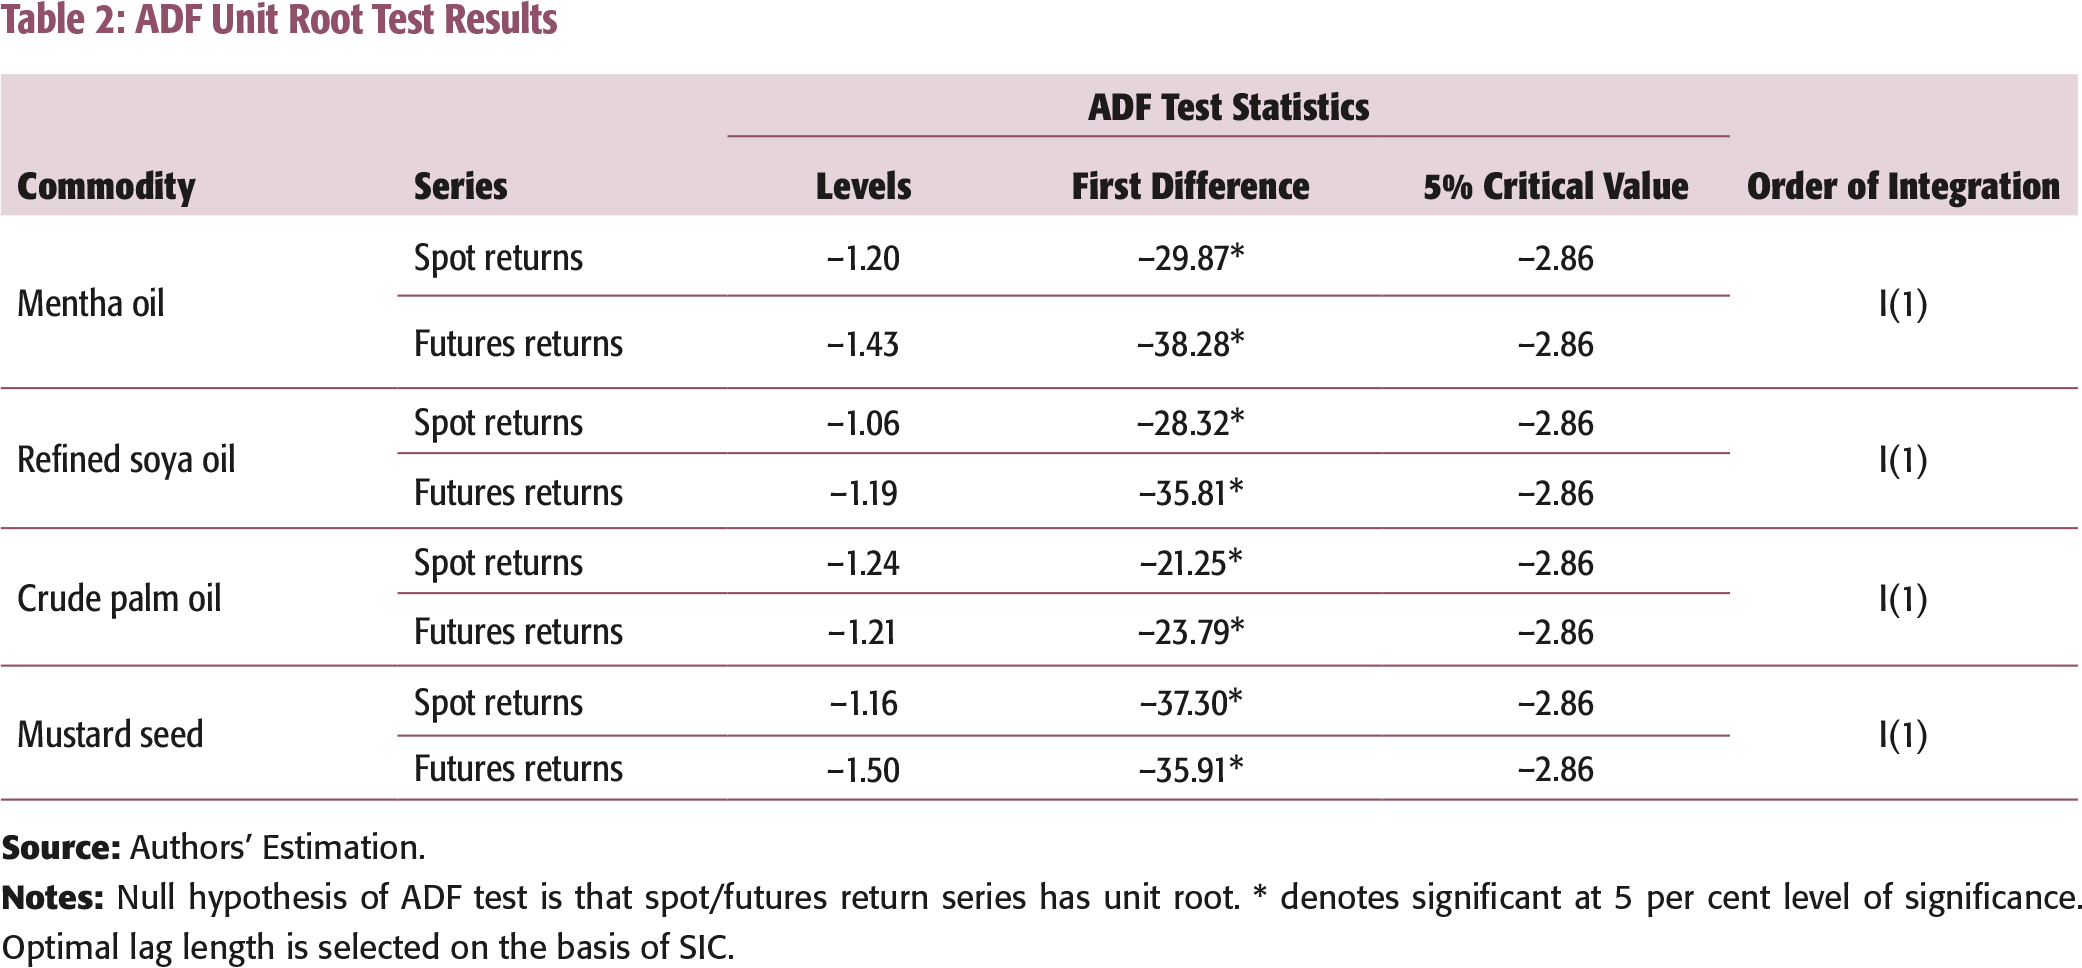
If the variables being examined are stationary, that is, their mean and variance are constant over time, the regression analysis done would provide time invariant and efficient estimates. However, most of the macro economic and financial time series data exhibit random walks and are found to be non-stationary. Regression analysis done with non-stationary variables leads to spurious results which might produce misleading inferences about the degree of association between the variables and the estimated parameters. If two-time series are non-stationary in levels but their first differences are stationary, they are said to be integrated of order one and denoted as I(1). The spot and futures log price series of each commodity are first subject to Augmented Dickey–Fuller (ADF) test (Dickey & Fuller, 1979) to determine whether they are I(1). The test checks for the presence of unit root and if detected, the log prices are differenced to remove unit root and make them stationary. This gives spot and futures return series.
Volatility Spillover: Bivariate GARCH (1, 1) Model
The present study uses basic GARCH model to capture volatility in prices of the selected commodities. First, an autoregressive moving average (ARMA) model of spot and futures return series is formulated. The conditional mean equation of spot and futures returns has been specified as an ARMA (p, q) process. An ARMA (p, q) model associated with Box and Jenkins (1976) is one in which current value of a dependent variable depends on its own past values plus the current and past values of white noise error terms. The autocorrelation and partial autocorrelation functions of residual from the model are examined using Ljung Box (LB)
For volatility analysis, in order to apply GARCH model, the presence of Autoregressive Conditional Heteroscedasticity (ARCH) effect is first tested to see if the data series exhibit features of heteroscedasticity and volatility clustering. The presence of ARCH effect connotes autocorrelation in volatility, that is, the conditional variance of error terms depends on the value of immediately preceding squared error. ARCH effect is examined with the help of autocorrelation and partial autocorrelation of the squared residuals from the estimated ARMA (p, q) model. The LB
ARCH effect in residuals of ARMA (p, q) model has also been tested with ARCH Lagrange multiplier (LM) test. If the computed test value exceeds the critical value, it leads to the rejection of the null hypothesis of ‘no autocorrelation’ in squared residuals. If ARMA (p, q) model reports no autocorrelation in residuals and ARCH LM tests reports the presence of ARCH effect, the authors further proceed to formulate GARCH (1, 1) model so that spot and futures price volatility can be modelled.
In the present study, bivariate GARCH (1, 1) model developed by Bollerslev (1986) has been used as it has been found to be the most parsimonious representation of ARCH class of models and acceptability of the order has been proven empirically in many studies employing time series data. Higher order GARCH (p, q) specification very often has many local maxima and minima and therefore basic GARCH model beats the higher order models. ‘GARCH model predicts that the best indicator of future variance is the weighted average of long-run variance, the predicted variance for the current period, and any new information in this period, as captured by squared residuals’ (Engle, 2001).
After formulating GARCH (1, 1) model for each of the series, ARCH LM test is run again on the residuals of the model to check if the ARCH effect has been removed by the model. As a part of the diagnostic check, LB test is also run on standardized residuals and squared standardized residuals. If ARCH effect is no more present in the residuals, it is an indication that the model is an adequate fit and can be used for volatility spillover analysis. Bivariate GARCH model makes use of information in the histories of two different markets and can be used in testing volatility spillover between two markets of the same underlying commodity.
The residuals from GARCH (1, 1) model of spot and futures return series are then squared to ensure that variance is positive. We now have two series:
Squared residuals of GARCH (1, 1) equation of spot returns. Squared residuals of GARCH (1, 1) equation of futures returns.
The squared residuals of a market are used as a proxy for shocks emanating in one market and are introduced in the volatility equation of the other market to test the volatility spillover from one market to the other. The model framed for testing volatility spillover is:


where
Volatility of the current period is measured as a lag of squared residuals of the previous period derived from the mean equation, that is,
Relationship between Spot Volatility, Futures Trading Volume, and Open Interest
The issue of stabilizing or de-stabilizing impact of futures trading is generally investigated from two perspectives: (a) examining the volatility of spot prices before and after the introduction of futures trading and (b) examining the relationship between futures trading activity and spot price volatility. The second methodology has been followed in this study since it gives a more interesting perspective to the study of the impact of futures trading by incorporating other factors which influence the market behaviour rather than just attributing the differences in market behaviour pre- and post-futures to the presence of futures market. A few studies, known for such kind of analysis, are Figlewski (1981), Bessembinder and Seguin (1992), Adrangi and Chatrath (1998), Gulen and Mayhew (2000), and Yang et al. (2005) among others.
The spot price volatility is modelled as a GARCH (1, 1) process as it captures the time varying nature of volatility. GARCH variance series is generated from E-Views and used as cash price volatility series. Two variables, viz., futures trading volume and open interest have been taken as the proxy for the level of trading activity. As pointed by Leuthold (1983), daily futures trading volume is largely indicative of speculative activity since the transaction of hedgers constitute only a small proportion of trading volume. However, since open interest represents trading positions which are longer than intraday positions, open interest data on an average captures activity of hedgers. This interpretation is also consistent with the studies of Working (1962), Bessembinder and Seguin (1992), Kamara (1993), and Yang et al. (2005).
Both series are first examined for stationarity with ADF unit root test. If the trading volume and open interest series are not stationary, then the first difference is taken which eliminates unit root problem and the analysis is done on the series which is integrated of the first order, that is, I(1).
Following the methodology of Adrangi and Chatrath (1998), the expected and unexpected components of trading volume and open interest are decomposed using Hodrick–Prescott (HP) filter (Hodrick & Prescott, 1997). Partitioning the series into expected and unexpected components helps in examining the heterogeneous effects of anticipated versus surprise component of trading activity (Bessembinder & Senguin, 1992). Decomposition of the unexpected component with HP filter produces results which are similar to those obtained by taking the difference of actual series and those fitted with ARIMA model. There is a high correlation between the expected and permanent components derived from HP-filter and those calculated with ARIMA model (Adrangi & Chatrath, 1998).
Series of expected futures trading volume and open interest are then generated as the difference of actual series and the unexpected component. ADF unit root test is run again on the four series, viz., expected futures trading volume (ETV), unexpected futures trading volume (UTV), expected open interest (EOI), and unexpected open interest (UOI). The relationship between spot returns volatility modelled as GARCH variance series and trading activity variables is examined with models discussed below:
1.

where
The significance and sign of futures trading activity variables will determine if spot volatility is influenced positively or negatively by trading volume and open interest.
2.
According to the rational expectation theory, information contained in the expected component of futures trading is to a large extent already reflected in the cash prices. Therefore, only the unexpected components of futures trading activity are examined for determining causality as they indicate unusual levels of trading activity associated with speculative positions that may be destabilizing. With the objective of studying the dynamic relationship between unexpected open interest and unexpected liquidity in the futures market and underlying spot market volatility, Granger (1969) causality test has been used. Granger causality ascertains causal link in two variables and has been used in the present study to determine whether the increase in futures trading activity leads to increase in cash market volatility or vice versa.
To test Granger causality between unexpected liquidity/ unexpected trading volume or unexpected open interest and cash price volatility, the following specifications are used:


Equations (4) and (5) ascertain the causality between UTV and cash returns volatility (CV) while equations (6) and (7) ascertain causality between UOI and CV,
Inference about destabilizing impact of futures trading can be drawn if the contemporaneous coefficient of UTV or UOI in Augmented GARCH is significant and positive and lagged coefficients of UTV or UOI are significant in Granger causality test specification indicating that causality is flowing from unexpected futures volume/open interest to spot volatility. In this respect, examining the signs of statistically significant parameters in the VAR will provide additional information about their relationship.
EMPIRICAL RESULTS
ADF Unit Root Test Results
Empirical Results for Volatility Spillover—ARMA (p, q)-GARCH (1, 1)

RESULTS OF VOLATILITY SPILLOVER
The order of ARMA model, which minimizes the information criteria, is selected for the conditional mean equations of both spot and futures returns (results for ARMA and ARMA-GARCH models are explained earlier in the article). After formulating autoregressive moving average model, volatility is modelled with GARCH (1, 1). The residuals from the GARCH model so formulated for each market are squared and introduced as shocks in the volatility equation of the other market to test the volatility spillover effect from futures to spot market or vice versa. Table 3 presents the results of the volatility spillover. Volatility spillover coefficients are highly significant in spot and futures equations of all four commodities indicating that futures market volatility spills over to the spot market and vice versa. Except mustard seed, the volatility spillover coefficient from futures to spot market is of relatively smaller magnitude than the spillover coefficient from spot to futures market. In the case of mustard seed, the model reports bi-directional volatility spillover with equal strength. The magnitude of spillover coefficient from spot to futures is greater in the case of soya oil, Mentha oil, and crude palm oil (CPO). Therefore, spillover effect from spot to futures is more than the spillover from futures to spot. An increase in volatility of spot prices increases the volatility of futures prices more as compared to the other way round. Information in both markets can be used to predict the volatility of other market but the information transmission mechanism of spot market is stronger. Therefore, futures market of oilseeds needs to be developed further in order to be a leading source of information transmission and provide efficient risk transfer mechanism. Similar findings of stronger volatility spillover from spot market to futures market have been reported in Indian studies on agro commodities by Dey et al. (2011) in case of pepper, Mahalik et al. (2009) for agricultural index at MCX, Srinivasan and Ibrahim (2012) for gold, and Srinivasan (2012) for MCXCOMDEX (composite index of metal, energy, and agro-commodities). The model results are ratified by the diagnostic test criteria wherein
Relationship between Spot Volatility, Trading Volume, and Open Interest
Unit Root Test Results—Futures Trading Volume and Open Interest

Contemporaneous Relationship between Futures Trading activity and Spot Price Volatility—Augmented GARCH Model
As per the methodology of Bessembinder and Seguin (1992), expected and unexpected components of futures trading activity variables are introduced as exogenous variables in the volatility equation of spot returns modelled as a GARCH (1, 1) process. The GARCH (1, 1) model augmented with additional explanatory variables enables the estimation of the contemporaneous relationship between components of trading activity and conditional spot volatility. Table 5 presents the results of Augmented GARCH model.
ETV is positively related to cash price volatility in the case of mentha oil and soya bean oil; however, it is negatively related to CV in mustard seed. UTV is positive and significant in soya bean oil and CPO while it is negative and significant in mentha oil. EOI is negative and significant in soya bean oil and mustard seed implying that there is an inverse relation between the two, that is, increase in anticipated open interest representing hedger’s positions is associated with reduced cash price volatility. UOI is positive and significant only in mentha oil.
Augmented GARCH Model of Spot Return Volatility with Expected and Unexpected Futures Trading Volume and Open Interest

Dynamic Relationship between Spot Price Volatility and Unexpected Futures Trading Activity—Granger Causality
The contemporaneous relationship between spot price volatility and unexpected futures trading volume does not account for the possibility of reverse causation, that is, causality from spot volatility to futures trading activity (Figlewski, 1981). Therefore, analysis of the lead–lag relationship between trading activity and volatility helps in ascertaining the causality and gives a clear picture regarding the stabilizing or destabilizing impact of futures trading.
VAR Granger Causality Test Results

Mentha Oil
Chi-square test statistics for UTV and CV relationship is significant indicating that current cash returns volatility is influenced by the past level of unanticipated futures trading volume. However, this is not destabilizing as the lagged coefficients of UTV in VAR (not reported here) are negative. Coefficient estimate of UTV in GARCH model (Table 5) is also negative implying that unexpected surge in trading volume reduces the spot price volatility. According to the Mixture of Distribution Hypothesis, there is a positive relation between trading volume and variance of stock returns. Empirical evidences of an inverse relationship between the two are rare in the literature and are also in sharp contrast to the widely held perception that volume and volatility have positive correlation (Kawaller, Koch, & Peterson, 2001). Daigler and Wiley (1999) found empirical evidence of a positive relation between volume and volatility when volume was driven by uninformed general public. However, when the volumes were driven by the activity of informed traders like floor traders and clearing members, it was inversely related to volatility. Damodaran and Subrahmanayan (1992) concluded from a survey of a number of studies that commodity futures helped in reducing the variance in commodity markets. In relation to S&P index, Brown-Hruska and Kuserk (1995) gave evidence of decline in spot price volatility with an increase in futures volume. The present analysis also provides evidence that unexpected futures trading volume is not destabilizing for the underlying spot market. ETV is significant in GARCH equation but its lagged terms in VAR (not reported here) are not significant leading to rejection of Granger causality from ETV to CV. Overall, UTV or sudden increase in futures trading volume is not destabilizing for mentha oil spot market volatility.
Chi-square test statistics is also significant for causality running from UOI to spot price volatility. GARCH model coefficient of UOI and lagged terms of UOI in VAR are mostly positive indicating that unexpected open interest has a destabilizing impact on spot price volatility. Similar findings have been reported in the study by Darrat and Rahman (1995), Yang et al. (2005), and Kumar (2009) on selected commodity futures traded in India. This aspect was discussed with commodity research analyst at NCDEX. Mentha oil futures market has a peculiar nature as it is highly speculative with low trading volume and high open interest. Participation of real hedgers is very low for this commodity. The speculators try to corner the stocks by buying futures contracts and rolling over the positions on contract expiry. This gets reflected in an increase in open interest, whereas the trading volume is low as contracts do not change hands due to a limited number of participants. The increase in levels of open interest in mentha oil is associated with speculative positions and leads to increased spot price volatility.
Causality is also observed in the direction from cash returns volatility to futures trading volume with mixed positive and negative signs in the VAR indicating that erratic nature of cash price volatility also affects the futures trading volume. The possible role of speculative interest in the spot market cannot be ruled out, wherein spot price volatility induces greater volumes in futures market.
Refined Soya Oil and Crude Palm Oil
Chi-square statistics is significant for causality running from unexpected futures trading volume to cash price volatility. Lagged terms of UTV in Vector Autoregressive Model have positive sign. This along with the positive significant coefficient of UTV in Augmented GARCH model is an indication that unanticipated surges in futures trading volume is increasing the spot price volatility and is an evidence of destabilizing impact of futures trading on soya bean oil and CPO spot price volatility. The increase in unexpected futures trading volume may arise from uninformed speculators who infuse noise in the market which is transmitted to spot market through arbitrage and causes increased price volatility. Futures trading volume represents the activity of speculators and as they increase positions during the day, volatility of underlying cash market, which takes price signals from futures market, increases. Studies on Indian commodity futures markets which have come up with similar findings are Kumar (2009) and Sehgal et al. (2012). Causality is not significant in other directions. Unexpected open interest has an insignificant coefficient estimate in GARCH model and causality from UOI to CV is also rejected; therefore hedging activity does not influence cash price volatility.
Mustard Seed
The coefficients of expected trading volume and open interest are significant and negative in augmented GARCH (Table 5). It implies that the increase in the level of trading volume and open interest is associated with reduced spot volatility. This is consistent with the views expressed in several studies that activities in futures markets attract informed traders to the physical market imparting more liquidity and making it less volatile (Pericli & Koutmos, 1997). On the other hand, the model reports that sudden and unanticipated levels of trading volume and open interest have no influence on the volatility of spot market.
Unexpected trading volume or open interest is not Granger causing the volatility in the cash market. The result of Granger causality coincides with that of GARCH model in which coefficients of UTV and UOI are insignificant. Hence, there is no evidence of price destabilization effect of futures trading which is a positive sign for the mustard seed futures market. Mustard seed is the only commodity in which there is no evidence of destabilizing impact. A possible explanation for this may be that first, mustard seed commodity price data is referred from NMCE exchange which is not dominated by excessive speculation. Second, it is one of the 25 commodities which are subject to minimum support price fixed by the Government of India to protect farmers against excessive fall in prices during bumper production. Also, India is almost self-sufficient in mustard seed and mustard oil and its domestic market prices are not much influenced by prices in the international markets. Since its prices are not purely determined by market forces, the result of the impact of futures trading differs from other commodities.
In three out of four oilseeds commodities analysed, the study provides empirical evidence of the destabilizing impact of futures trading activity either in the form of trading volume or open interest on the volatility of spot prices. Unexpected levels of futures trading volume are responsible for driving up the spot price volatility in the case of soya oil and CPO. The daily trading volume reflects speculative positions and only a small portion of hedging transactions. When volumes in futures market are predominantly driven by uninformed speculators, underlying spot price volatility will also increase as the two markets are linked by arbitrage. On the other hand, open interest comprises longer than intraday trading positions and generally represents positions of hedgers or actively informed traders who bring fundamental information about the commodity to the futures market. The increase in hedgers’ position imparts depth to the market. They are traders who have relatively homogenous beliefs and agree on prices which are close to the intrinsic value of an asset. Therefore, higher liquidity from the participation of informed traders in the form of expected and unexpected open interest is not having a destabilizing impact on the spot price volatility.
CONCLUDING REMARKS AND POLICY SUGGESTIONS
Oil and oilseeds commodities are hot counters on com-modity futures exchanges. They are heavily demanded for domestic consumption and industrial use by biodiesel industry. Futures trading is expected to bring price stability for the development of its physical market. However, the potential of futures contracts for price discovery and price risk management is untapped. The present study investigates the volatility dynamics in spot and futures markets of select commodities from the sector. The econometric analysis is undertaken to test the volatility spillover between spot and futures market, and to ascertain whether an unexpected increase in futures trading volume or open interest is destabilizing for the underlying spot market. It is observed that though there is bidirectional volatility spillover, the volatility of spot market has a greater impact on the volatility of futures market, indicating that informational efficiency of oilseeds spot market is stronger than that of futures market. The analysis provides evidence of destabilizing impact of futures trading on the volatility of physical market prices in three out of four commodities analysed. It indicates that badly informed traders present in futures market are destabilizing the underlying spot market by inducing noise and lowering the information content of prices.
The results are important for hedgers in commodity markets who expect welfare gains from futures trading, which is possible only if the latter does not increase the spot price volatility. However, if the speculative activity in futures market does not lower the volatility, the overall risk of a hedged portfolio is not reduced resulting in welfare reduction. Spot markets in India for agricultural commodities are fragmented, unorganized, and are not electrically traded. Due to the lack of transparency, it becomes an easy victim of instability perpetrated by noisy speculative activity in futures markets.
Therefore, it is important to encourage participation of farmers, traders, processors and other stakeholders who will bring fundamental information about the underlying commodity into the futures market. Educating and training farmers and traders will enhance their confidence in the use of derivative contracts. Spot markets can be strengthened by equipping them with information-technology based price dissemination terminals like electronic price ticker boards. Such measures will bring speed and transparency in the spot trading mechanism which can coexist with the state-of-the-art commodity futures exchanges. Greater financial and administrative autonomy to the Forward Market Commission (FMC) which is till now operating under the Department of Consumer Affairs (Ministry of Consumer Affairs, Food and Public Distribution), will enable it to handle incidents of price rigging and abusive practices like hoarding and cartelization. The punitive powers of FMC need to be increased so that it can take stringent action against traders engaging in fraudulent activities. Whenever such instability is witnessed, the regulator can control the impact of excessive speculation by adopting measures, such as close monitoring of members’ positions, imposing additional margins, declaration of stocks in warehouses, and staggered delivery systems, and so on. It is also proposed that futures trading should not be allowed in narrow commodities. These are the commodities which do not meet the suitability requirement for futures trading. They face constraints like limited domestic production due to which reliable and timely demand and supply forecasts are not available. Narrow agricultural commodities like mentha oil and cardamom become potential candidates for price manipulation in the absence of any precise data.