
Abstract
Keywords
There are over 4.39 billion internet users worldwide and 451 million users in India in 2019 (Digital, 2019). Internet has now become one of the most rapidly growing forms of shopping worldwide (Mandavia, 2019). This has created tremendous opportunities for businesses and customers to acquire and deliver information and services to customers and businesses. It has transformed how people and businesses interact (Agag et al., 2016). This rapid acceleration and progress in internet and information technology has resulted in phenomenal growth of online retailing, particularly in emerging economies. It has attracted many new e-retailers such as Amazon, Flipkart, Snapdeal, ShopClues, Jabong, Paytm, Myntra, HomeShop18 and eBay, resulting in crowding and fragmented market space (Kumar & Anjaly, 2017). This overcrowding creates a challenging situation for online retailers to compete and create a niche in the online market ecosystem. To sustain in such an ecosystem, online retailers must provide financial and non-financial benefits on purchases. The costs incurred (on inventory carriage, delivery, return costs, cash-on-delivery, etc.) by online retailers are unsustainable in the long run because of a lack of loyal customer base (Chawla, 2015, p. 16). Shipping costs significantly impact the profitability of e-stores (Shao, 2017) and cost-conscious customers tend to abandon shopping carts if the e-retailer levies delivery charges (Kawamoto, 2008). Shao (2017) has deciphered that free shipping may benefit small retailers with small local markets, but it intensely damages the big retailers. On the other hand, product return is very crucial in online retailing than in offline retailing (Dholakia et al., 2005), as return costs cause profits to sink by around 3.8% every year (Petersen & Kumar, 2010). These challenges with returns are forcing e-retailers to rethink allowing liberal returns (Griffis et al., 2012). Piron and Young (2000) and Rosenbaum and Kuntze (2005) argued that around 18–20% of total customers engage in ‘retail borrowing’, that is, using a product for a while and then returning it without a valid justification. These practices and their associated costs may drive online retailers out of business until some concrete reforms are not made. Therefore, online retailers must emphasize sustainable business practices and encourage customers for sustainable consumption (Ashworth et al., 2006).
Costanza and Patten (1995, p. 193), while describing sustainability, expressed that ‘the basic idea of sustainability is quite straightforward: a sustainable system is one which survives and persists’. Sustainable business practices refer to earning sustained profits through value proposition and value delivery to focused customer groups (Bhat et al., 2020; Laasch, 2017). The electronic commerce business models where the exchange is entered electronically using internet networks are entirely based on profit logic of values. The strategic choice of these organizations is shaped by commercial and non-commercial value logics (Ocasio & Radoynovska, 2016). Online retailers are now recognizing stakeholder’s commitment to sustainability as a prerequisite for long-term competitiveness (Balderjahn et al., 2013).
The online retailing literature depicts that most research in this area is largely empirical driven, in which a questionnaire is often used to collect data, and structural equation modelling or multivariate regression techniques are employed for data analysis (Kock et al., 2016; Teng et al., 2018; Xu-Priour et al., 2017). Researchers have argued that effective measurement is a cornerstone of scientific research (DeVellis, 2003; Kumar & Anjaly, 2017; Slavec & Drnovsek, 2012). The challenge of applying these methods to social sciences in general and to online retailing research in particular is difficult because most constructs used in these studies are operationalized as latent variables, which are used as proxy measures (cannot be directly observed) and have to be assessed by manifest measures that are directly observed (Diamantopoulos et al., 2008). To increase the likelihood of construct validity and reliability of a scale and its application in empirical research for valid inferences, several scale development and validation procedures have been suggested by researchers in the domain of management research (Anand & Kaur, 2018; Arora & Kaur, 2019; DeVellis, 2017; Kumar & Anjaly, 2017; Morgan et al., 2018). These procedures make up a ‘set of recommendations’, ‘scale development processes or conceptual framework’. Fourne et al. (2018) proposed an eight-step process of scale development that includes conceptual definition, item generation, content validity assessment, exploratory factor analysis (EFA), confirmatory factor analysis (CFA), convergent validity assessment, discriminant validity and nomological validity assessment. But the criteria for item elimination and retention vary when compared with other scale development methodologies. Several researchers found that respondents did not perceive the scale items fit to predict the latent construct even after applying a well-premeditated scale development procedure (Hinkin, 1995; Pearce & Gregerson, 1991). It infers that no clearly defined scale or procedure is available to tap any situation more precisely as desired (DeVellis, 2017). Consequently, it becomes imperative to have a comprehensive process of developing a measurement model for these latent constructs. Researchers have acknowledged scale purification, that is, justified removal of items from multi-item scales, as an important step towards the creation of any scale (Hardesty & Bearden, 2004; Homburg et al., 2015; Liu & Arendt, 2016; Pijls et al., 2017). The study will empirically demonstrate how to apply various judgmental and statistical criteria to decide which items to omit and which to retain to purify the scale.
The study addresses these challenges and contributes to the literature of scale development in e-retailing. It helps to generate a pool of items that measure sustainable online retailing and then reduce these items into key factors, namely, trust (Chen & Dibb, 2010; Mukherjee & Nath, 2007; Toufaily et al. 2013; Zboja & Voorhees, 2006), innovation (Evanschitzky et al., 2015; Merlino et al., 2020; Ruiz-Molina et al., 2017), usefulness (Ha, 2020; Kripesh et al., 2020; Park et al., 2014; Renko & Druzijanic, 2014), internet speed (Page & Lepkowska-White, 2002; Rao, 2006; Sohn, 2000; Yang & Jun, 2008) and customer support services (Holloway & Beatty, 2003; Melis et al., 2015; Simms, 2002), which determine consumers’ perception of online retailing. Since sustainability has been operationalized in the study as long-term growth and stability, therefore, the above factors were found more relevant than customer satisfaction, customer retention and new customer acquisition in e-retailing. The study attempted to develop a comprehensive, reliable, valid scale that captures the perception of customers regarding sustainable e-retailing. Scale development procedure and the various criteria applied can help researchers to evaluate the quality of scales, guide them in scale development and purification, and provide reviewers and editors with tools to identify methodological errors while making review decisions. Further, the scale will allow e-marketers and researchers to precisely gauge consumer perception and develop more effective and sustainable marketing strategies for delivering superior customer value.
THEORETICAL BACKGROUND
Scale Purification Criteria
The study employs both statistical and judgmental criteria for scale development and purification. Statistical criteria relate to statistical heuristics or tests wherein ‘cutoff criteria’ are involved in evaluating the quality of scale (Lance et al., 2006). Rossiter (2008) has argued that statistical procedures are inappropriate and are unable to provide evidence to establish the validity of a scale. On the contrary, Rigdon et al. (2011) argued that content considerations are seriously undervalued in contemporary scale development. Borsboom et al. (2004) deciphered that statistical measures of correlation cannot provide much evidence for validity. Therefore, the problem must be addressed by the substantive theory. It is evident from literature related to scale development and validation that both criteria (statistical and content) are important for scale purification. The judgmental procedure involves sorting items by judges to establish which items should belong to which constructs (Delcourt et al., 2016). The judgmental criteria is a counterpart to statistical factor analysis in which the latter involves both theoretical and empirical justifications (Anand & Kaur, 2018; Balaji & Chakraborti, 2015; Moore & Benbasat, 1991). The judgmental criteria is particularly important for higher-order measurement models (reflective and formative). After a thorough literature review and consultation with the subject experts regarding the various measurements of sustainable online retailing, the study has identified five dimensions that are operationalized under the following headings.
Trust
Trust is defined as ‘a psychological state comprising the intention to accept vulnerability based on positive expectations of the intentions or behaviours of others’ (Rousseau et al., 1998, p. 395). Trust is perceived when two parties come together and believe in each other’s integrity (Mukherjee & Nath, 2007; Oh et al., 2012). Trust is significant in the e-marketplace as social capital in online activities because the online shoppers rely on the internet for information about purchases and are attitudinally less loyal towards e-retailers (Bansal et al., 2016; Bhat et al., 2020; Schlichter & Rose, 2013). Thus, understanding how online shoppers evaluate website trustworthiness is critical for online retailers (Roghanizad & Neufeld, 2015). Trust is operationalized as the willingness to rely on the partners with whom one has confidence. Trust has been measured by five items, as shown in the Appendix. These items have been adopted from the research studies of Khan and Rahman (2016); Oh et al. (2012); Dennis et al. (2009) and Kim et al. (2008) using the highest CFA loading criteria.
Innovation
The study conceptualizes innovation as the adoption of novel ideas, behaviour, systems, policies, programmes, devices, processes, products or services in an organization. Innovation deals with all types of e-retail innovations such as technological, non-technological, marketing, operational and process (Damanpour, 1992; Goldsmith & Hofacker, 1991). The main focus of innovation is to adopt novel methods that will assist businesses to enhance competitiveness and performance (Chahal & Bakshi, 2015; Gandotra, 2010; Huy et al., 2012). Innovators are novelty seekers who desire to seek out what is new and different (Hirschman, 1980). Innovation is ’the willingness of an individual to try out any new information technology’ (Agarwal & Prasad, 1998). Innovators are more willing to adopt novel ideas and are ready to cope with financial risk or uncertainty arising from innovation adoption (Lee & Huddleston, 2006; Thakur & Srivastava, 2015). Therefore, retailers need to innovate consistently to develop innovation and integrate emerging innovations into their management processes (Pantano, 2016; Panatano et al., 2018). Innovation was measured with five items adopted from the research studies of Bigne-Alcaniz et al. (2008); Huy et al. (2012); Kafetzopoulos and Psomas (2015); Khan and Rahman (2016) and Bhat et al. (2020) using the highest CFA loading criteria (Appendix).
Usefulness
Usefulness has been operationalized as ‘the degree to which a consumer believes that using a particular system/technology would enhance his or her shopping performance’ (Davis, 1989). Usefulness plays a key role in the initial and subsequent stages of the technology-adoption process (Bhat et al., 2020; Mou et al., 2017; Wu et al., 2017). Usefulness in online retailing is conceptualized as the benefit and expected value of purchasing products/services electronically (Huang, 2017). Many items have been identified from the literature that measure usefulness but, based on the researchers’ own judgement and consultation with subject experts, only four items were adopted to measure usefulness. The previous studies that were consulted for these four items include Davis (1989), Ahn et al. (2003), Bigne-Alcaniz et al. (2008) and Bhat et al. (2020) (Appendix).
Internet Speed
Internet speed is considered an important determinant of website access because it enables users to attain their goals quickly. Several researchers consider download delay as an important design criterion on the internet (Nielsen, 1999; Palmer, 2002; Tilson et al., 1998). Dallaert and Kahn (1999) suggested that for website evaluation, it is less damaging to wait for the homepage to download than to wait during the interaction with the website. Delays shorter than expected lead to better website evaluation. Researchers have found a negative relationship between download time and the probability of requesting additional web pages within the website (Sismeiro & Bucklin, 2004). The negative feeling acquired by waiting experience can decrease consumer preference towards the website in future. This study will consider the user’s perception of download delays. The items for this construct were developed by the researchers and were measured by four items as shown in the Appendix.
Customer Support Services
Customer support service has been operationalized as the willingness of a webstore to respond to customer needs and other logistic support provided to a consumer while purchasing online. Customer service in online retailing includes product/service selection services, addressing customer inquiries promptly, handling frequently asked questions (FAQ) through e-mails and other communication channels, showing sincere interest in solving customer problems, keeping customers informed and providing logistic service support (Bhat et al., 2020; Cao et al., 2018; Park & Kim, 2003; Shergill & Chen, 2005; Zeithamal et al., 2002). Many items have been identified from the literature that measure customer support services. However, based on the researchers judgement and consultation with subject experts, only five items were adopted to measure customer support services. The previous studies that were consulted for these five items include Lee and Lin (2005); Shergill and Chen, 2005 and Bhat et al. (2020) (Appendix).
Several scales measuring trust, innovation, usefulness, internet speed and customer support are available in the literature, but most of them were found to measure sustainability in terms of environmental sustainability. The scale items considered fit for this study describe sustainable business practice in terms of long-term growth and stability, and customers’ adaptability to e-retailing. There are very scattered scales available in the literature regarding sustainability (operationalized in terms of long-term growth and stability), and no comprehensive scale is found in the literature. The study adopted CFA loading criteria for selecting items from previous studies. Items with the highest loading against their respective constructs were selected for further research. The reason for selecting this criterion is that highly loaded items will explain maximum variance in their respective constructs.
MATERIALS AND METHODS
The instrument contains 23 statements regarding the five dimensions of sustainable online retailing discussed in the literature review. A 5-point Likert-Scale was employed to obtain responses ranging from strongly agree (5) to strongly disagree (1). Most of the multivariate statistical techniques are applicable to continuous scales. Therefore, a question arises about the continuous nature of the Likert-Scale (Hair et al., 2006). Byrne (2010) argued that a categorical scale can be treated as a continuous scale when the number of categories in a scale are large. Consequently, a scale containing more than four response categories can be treated as continuous or interval scale. Likert-Scale is often used in marketing research as it allows divergence of responses (Back, 2005; Han et al., 2008).
The study used an online survey method by employing google survey forms to collect data from the respondents that have a prior online shopping experience. Snowball sampling technique was adopted (Khan & Rahman, 2016), where each participant was asked to refer someone who could be part of the survey based on the eligibility criteria. The data was collected in three stages, namely Study 1, Study 2 and Study 3, to systematically satisfy the scale purification process. The instrument was developed based on three stage framework suggested by Moore and Benbasat (1991) that includes creating pool of items, instrument development and instrument testing. Descriptive statistics, EFA with a reliability test, and CFA with reliability and validity measures were conducted on various data sets collected at different stages using SPSS 16 and AMOS 20 statistical software packages.
Study 1
During Study 1, three professors from the field of strategy marketing and consumer research, four PhD research scholars from the field of marketing and one marketing expert from the industry were invited to check the relevance, logic and inclusiveness of the questionnaire. As a result, minor changes were made in the questionnaire’s original wording and sequence of statements. Further, only those items that were judged appropriate in context to their corresponding constructs were retained, as discussed in the earlier section (Delcourt et al., 2016). After initial screening by experts, the list of items were reviewed by the authors for any other exclusions and inconsistencies. Considering the comments of experts and discussions carried by authors, three redundant items were eliminated, and the wording of four items was revised from the initial pool of 26 items. The resulting pool of items containing 23 statements was subjected to an empirical multi-sample scale purification and validation process (Seo & Yun, 2015). It has been argued by Malhotra (2004) that the sequence of statements in a questionnaire influences the nature of responses received from respondents. The empirical criteria applied during Study 1 include intra-item, intra-factor, inter-item and item-total statistics.
Intra-item and Intra-factor Statistics
Intra-item and intra-factor statistics was evaluated by mean and
Results of Intra-item Statistics (Descriptive Statistics).

Descriptive statistics for intra-factor coefficients is given in Table 2. The five constructs/factors were computed from their respective items by taking the mean of their respective scores. It is revealed from Table 2 that all the five constructs have a mean close to the central scale point (i.e., 3 in the case of 5-point Likert-scale) and a
Results of Intra-factor Statistics (Descriptive Statistics).

Inter-item and Item-total Correlation
Inter-item and item-total statistics was evaluated by determining correlation coefficient between items for each factor and correlation of each individual item to the total factor to which it belongs. This criteria applied the threshold limit proposed by Hair et al. (2003) that inter-item correlation should not be <0.30 and >0.90 and item-total correlation should not be <0.50 and >0.90 (Ruekert & Churchill, 1984). Results of inter-item and item-total correlation are presented in Table 3. These results revealed that the item-total correlation of T5 belonging to Trust is 0.912, which is above the threshold of 0.90, and was dropped because of the high degree of positive correlation. Similarly, U11 has an item-total correlation of 0.934 and was dropped because of high correlation. It has been argued by Bearden et al. (2011) that the correlation between items representing the same construct should be high and low for items representing different constructs. The results presented in Table 3 depicts that the second criteria of Inter-item and item-total correlation statistics is met.
Results of Inter-item and Item-total Correlation.

Study 2
Study 2 was conducted for empirical validation and purification of the research instrument. Data for study 2 was collected from a sample of 176 respondents. The population of the study includes online retail shoppers in the state of Jammu and Kashmir. Empirical criteria applied to the data of study 2 include EFA and reliability statistics.
Exploratory Factor Analysis
Exploratory factor analysis, also referred to as data reduction technique, was conducted to express items in terms of few factors or components based on similarity among the items. EFA was performed on the remaining 21 items on a sample of 176 respondents using SPSS 16. Principle component analysis (PCA) extraction method along with Varimax rotation was used to conduct EFA. The reason for using PCA for extraction is that it is one of the best rotation procedures because it maximizes the number of items with high loadings on a component, thereby enhancing the interpretability of components (Malhotra, 2002). The indices based on which EFA was evaluated includes Kaiser-Meyer-Olkin (KMO) measure of sampling adequacy, Bartlett’s test of sphericity, Eigen value, item loading, and percentage of variance explained by each component. Researchers have argued that a KMO value of 0.50 or greater indicates that a sample is adequate for factor analysis. Further, Bartlett test should be significant at 0.05; factors with Eigen value greater than 1 were considered; 0.6 as a threshold for item loadings; and 0.50 as a threshold for cumulative variance explained by all the five components are considered as the basic criterion of EFA (Hair et al., 2003).
Table 4 depicts item loadings, Eigen value and cumulative percentage of variance explained by the five components. Based on the Eigen value criteria, five components were obtained after the rotation of the dataset as depicted in Table 4. The cumulative percentage of the variance of all the five components was found to be 66.56%, which was above the threshold limit of 50% (Table 4). The items with loading above 0.60 were retained in their respective components (Hair et al., 2003). It took about 10–20 iterations to clean the whole dataset based on criteria set earlier. The rotated component matrix is shown in Table 4. Through data reduction, two items have been removed from the dataset containing 21 items. In Trust, all four items were retained and out of five items of customer support service, four were retained with the deletion of CSS19. In internet speed, all the four items were retained; however, in innovation, three items were retained with the deletion of I9. In usefulness, all the three items were retained. Hence, out of 21 items, 19 were retained and two items were dropped.
Results of Principle Component Analysis (Rotated Component Matrix).
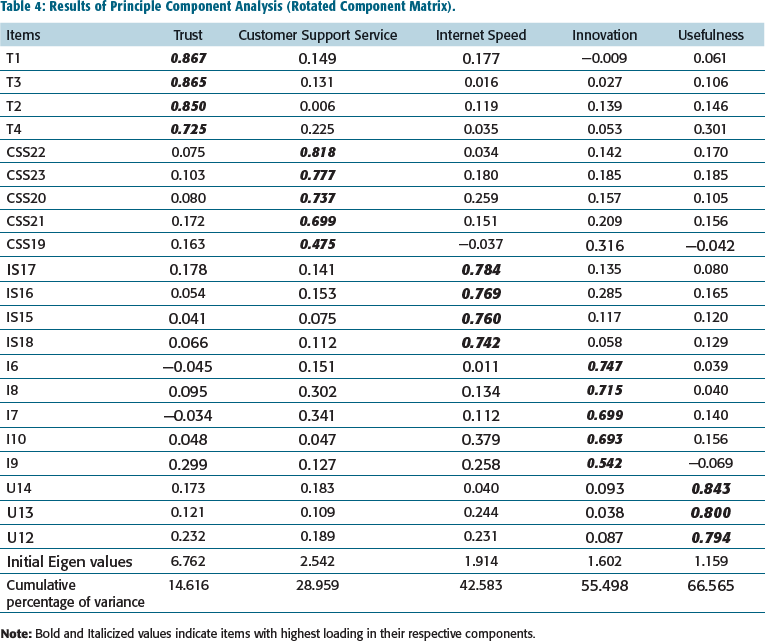
Table 5 depicts commonalities after extraction, the KMO measure of sampling adequacy and Bartlett’s test of sphericity. Extracted commonalities represents the sum of squared loadings for an item across all components. The higher the commonalities value for each item, the better their loading in the component matrix will be. Table 5 reveals that all items have good commonalities values except I9 and CSS19, hence, reconfirming the results of Table 4. Further, it is revealed from Table 5 that the dataset has KMO of 0.820 and Bartlett’s test of sphericity is significant at 0.001 level (χ2 = 188,
Results of Commonalities, Reliability Statistics, KMO and Bartlett’s Test.

EFA Reliability Statistics
Internal consistency and reliability of constructs were examined through reliability coefficients such as Cronbach’s Alpha and Split-Half (Hair et al., 2009). Cronbach’s Alpha was computed for each construct. In Split-Half, items were divided into two equal parts for which Cronbach’s Alpha was computed. Further, Guttman Split-Half coefficient was determined for both the split-halves. The estimated value of Cronbach’s Alpha ranges from 0–1, but the study took ≥0.60 as an acceptable limit (Nunnally, 1978). The results of reliability statistics are presented in Table 5, which depicts that Cronbach’s Alpha of each construct is above 0.60 and the Split-Half reliability coefficient of both the halves (first half containing T1, T2, T3, T4, I6, I7, I8, I10, U12 and U13; second half containing U14, IS15, IS16, IS17, IS18, CSS20, CSS21, CSS22 and CSS23) is above the threshold limit of 0.60. It is further revealed from Table 5 that the Guttman Split-Half Coefficient is above the threshold limit of 0.60. However, it is noteworthy that Cronbach’s Alpha and Guttman Split-Half Coefficient have been computed without considering I9 and CSS19, because these items have been dropped in the prior step of scale purification.
Study 3
Study 3 was conducted to confirm EFA results and to purify the research instrument. Data for Study 3 has been collected from a sample of 589 respondents. The population of the study includes online retail shoppers in the state of Jammu and Kashmir. CFA and some reliability and validity tests were performed on the dataset of Study 3 for final validation of the scale using AMOS 20.
Confirmatory Factor Analysis
After obtaining the underlying factor structure from EFA, CFA was performed on the final 19 items to confirm EFA findings and further refine the scale. AMOS 20 was used to perform CFA by adopting a maximum likelihood estimation approach. The measurement model was constructed in AMOS graphics, and various indices were determined to evaluate model fitness. The various model fit indices that were examined to check the fitness of the model include chi-square/
Results of Confirmatory Factor Analysis and Reliability/Validity Estimates.

It can be observed from the table that both the goodness of fit indices, that is, GFI and CFI, are above 0.90, and the badness of fit indices, that is, RMR and RMSEA, are below 0.08 threshold. It is also noted that the normed fit index, that is, chi-square/

CFA Reliability and Validity Statistics
Validity and reliability in CFA was established through composite reliability (CR), average variance extracted (AVE), maximum shared squared variance (MSV) and discriminant validity (DV). The acceptable limit for various reliability and validity measures is that the CR value should be 0.70 or above, AVE value should be 0.50 or above, MSV should be less than AVE and for discriminant validity, square root of AVE (diagonally in Table 7) should be greater than the correlation between constructs (below diagonal) (Hair et al., 2010). AVE, MSV and CR results are presented in Table 6, and DV results are shown in Table 7. It is depicted from Table 6 that CR, AVE and MSV for all the five constructs are in the acceptable range, hence confirming the convergent validity and reliability of the scale. Further, Table 7 depicts that the square root of AVE (aster mark) shown diagonally is greater than the correlation coefficients between various combinations of constructs shown diagonal. These results in Table 7 confirm the discriminant validity of the scale.
Discriminant Validity Results.

DISCUSSION
The study has applied both judgmental and statistical criteria to evaluate and purify the scale. The authors have identified five dimensions of sustainable online retailing. Their respective items were obtained by the literature review and authors’ compilation. In the judgmental criteria, items were sorted based on relevance, logic and inclusiveness to assign items to different constructs. After performing the judgmental analysis, it was found that the wording and coherence of some statements needed rework. Therefore, minor modifications were made in the initial set of questions/statements. It has been argued by Hair et al. (2006) and Gentry and Kalliny (2008) that sufficient support from the literature to construct measurements, enhances the face and content validity of measurements. Therefore, a pre-requisite to scale development and validation is a theoretical justification of constructs and their individual items, established through face and content validity.
The first empirical criteria applied by the author/s include intra-item and intra-factor statistics that were evaluated using basic descriptive statistics (mean,
The third empirical criterion applied by the authors was EFA. All the data reduction indices (such as KMO, Bartlett test, Eigen value, variance extracted, etc.) were found to be in an acceptable range. During the process of EFA, 19 items were retained. The commonalities of all the items were found to be higher (except I9 and CSS19,) which indicates obtaining a clean rotated component matrix without any cross-loading issues. Reliability during the EFA process was established through Cronbach’s Alpha and Split-Half. It was found that all the five factors have Cronbach’s Alpha above 0.60, and Guttman Split-Half coefficient was also found to be above 0.60 threshold. Therefore, EFA resulted in the retention of 19 items and the deletion of I9 and CSS19. These findings are in accordance with the methodology for scale development proposed by Hair et al. (2009).
The fourth empirical criteria employed by the author/s is CFA. The process of CFA resulted in the removal of two items, namely, T4 and I6, from the measurement model because of poor loading (below 0.70). The study found that all model fit indices were in an acceptable range after removing the poorly loaded items. CFA reliability and validity were established through CR, AVE, MSV and DV. It was found that all the five constructs have CR and AVE value above 0.70 and 0.50, respectively. MSV was found to be less than AVE for all five constructs and were empirically distinct from each other. These findings confirm the convergent validity and discriminant validity of constructs. These findings are in accordance with the methodological approaches proposed by Hair et al. (2010).
CONCLUSION
The genesis of this research work starts with the notion that there is a lack of a comprehensive and well-established standard measurement tool in the e-commerce literature about sustainable online retailing. Although measurement scales are available in different management disciplines, such as marketing and human resource, sustainable online retailing cannot solely rely on the measurement scales of other disciplines. The study attempts to adopt the existing fragmented scales to develop new ones. There is enough scope for scale development (new) and purification (existing). Therefore, an exhaustive scale purification process is crucial to enhance the trustworthiness of the research results. If not appropriately applied, any methodology loses its power to generate reliable, valid and plausible results. The study employed a dualistic approach for scale purification, including judgmental and statistical criteria. The judgmental criteria include the researchers own logic, understanding and theoretical justification. The statistical criteria include intra-item and intra-factor statistics, inter-item and item-total correlation, EFA and CFA. After applying all these criteria, six items were dropped from the initial scale of 23 items, which finally resulted in the retention of 17 items. The scale development and purification process undertaken in the present study will help us to overcome methodological negligence in future e-retailing research.
IMPLICATIONS
The study demonstrates the application of both judgmental and empirical criteria of scale purification. Online retailing researchers can adopt this comprehensive methodology for survey-based research. Practitioners and academicians must follow the methodological steps described in the study to get reliable and valid measures of indicators. Practitioners often hesitate to follow the detailed scale development and purification process. The results of this study can inspire them to consider both judgmental and statistical criteria while evaluating quality of a scale. Researchers in the online retailing need to emphasize judgmental criteria. It is these criteria that provide theoretical justification to the constructs with the empirical meaning of a scale.
There should be a consensus between judgmental and statistical scale development and purification approaches. A statistical approach should only be applied when items of a construct have sufficient theoretical justification.
Validity and reliability are the dominant quality lenses that researchers should take into consideration when purifying a scale. The study has demonstrated the application of these quality lenses in both judgmental (face and content validity) and statistical criteria (Cronbach’s Alpha, Split-Half, CR, AVE, MSV and DV). These quality criteria will help to cover the precision of measurement.
The study has applied intra-item, inter-item and intra-factor criteria for the removal of items. These criteria have implications for scale purification. These criteria consider a relationship of item with construct and a relationship of the item to other items. Therefore, the correlation between items of different constructs should be lower than the correlation between items of the same construct.
LIMITATIONS AND FUTURE RESEARCH
The study is mostly quantitative as most scale purification criteria were tested on survey data. However, the initial steps of scale development and purification process were qualitative based on the judgmental criteria used. The items for five constructs were mostly adopted from the existing literature, except for a few. The study could not demonstrate the content analysis (thematic analysis) procedure for item-generation regarding constructs with no existing scale. Therefore, future research should focus on the qualitative procedure for scale development in the case of an exploratory research. Future researchers can extend the methodology adopted in the current study to other disciples of management research. Furthermore, respondents in the study were not differentiated based on products/brand category. Future research may consider brand or product categories for a more insightful process of scale purification and validation.
APPENDIX
Trust
I can trust online retail stores.
Online shopping sites are promising whenever I purchase.
E-retail stores always keep their commitments.
I believe that this e-retail brand would not take adverse actions against its consumers.
Brands are not misrepresented at the web store I purchase in.
Innovation
I first tried to purchase online amongst my friends.
Web stores continuously build and improve relationships with customers.
E-stores continuously strive to improve existing products and bring in new and innovative products into the e-marketplace.
The web store puts in efforts to be less complicated and improve customer-web store interface.
The web store’s key focus is to improve customer experience and relationship management as compared to other e-retailers.
Usefulness
I can achieve my shopping goals more effectively from web shopping.
I can satisfy my shopping needs easily through online shopping.
Web shopping improves my shopping productivity/ saves me lot of money.
I can purchase goods quickly through online shopping.
Internet Speed
The website of the online retail store loads quickly.
Other webpage download quickly on this website.
The rate of information dissemination is fast enough on this website.
The speed of information is retrieval from the webpage is high.
Customer Support Services
The e-store website is willing and ready to respond to customer needs.
Customer inquiries are addressed promptly.
The website shows a sincere interest in solving customer problems.
The product delivery system of web stores in efficient.
Product return and cash back are governed by an efficient policy mechanism.