
Abstract
Introduction
In railway signalling systems, there are a considerable number of wayside objects installed along the tracks to ensure safe operation, e.g., optical signals, point machines of switches, axle counters, and barrier gates and warnings on level crossings. The wayside objects are controlled and driven by wayside object controllers (OC), which are linked to interlocking and centralized traffic control (CTC). 1 The wayside OCs are geographically dispersed either along railway lines or in stations. Traditionally, to control and power the OCs, fibre optics and copper cables are needed to be installed to link the OCs to the interlocking and the nearby power supply, respectively, so a great amount of civil work is associated with cabling. For the modern European rail traffic management system (ERTMS), data and instructions are digitally transmitted via wireless radio networks, which can help to significantly reduce the on-site cabling work along the railway track.2,3 Nevertheless, long power cables still have to be installed to connect the OCs to the electric power supply and hence cable ducts have to be built along the track to house the power cables. For electrified railway lines the electric power can be directly acquired from the catenary system along the track, but for non-electrified regional lines, there is still a significant amount of cabling work needed to link the OCs to the nearest stations or the public grid, which still leads to both high capital cost and high operational cost.
To save construction costs and minimize energy usage in operation, local renewable energy resources (RES) have been implemented in many applications with low-power demands, e.g., traffic lights, remote weather stations and service terminal systems.4,5 On the railway aspect, there are some studies on using renewable energy, e.g., solar panels, wind turbines and some energy harvesting technologies, for traction systems and trackside electronic equipment6,7; energy management systems considering uncertainties of renewable energy sources 8 and optimization of operations with the consideration of renewable energy and energy storage systems. 9 They show the possibility of totally or partly replacing the electric power supply with local renewable energy to power some of the railway subsystems. Therefore, to minimize the construction and maintenance costs and to assist decarbonisation in railway sector, a concept of smart wayside object controller (SWOC) is suggested, which is supposed to be autonomous, self-sufficient, remotely-monitored and locally-powered. 10 The SWOC is supposed to be off-grid and powered by local RES along the track, so the wayside power supply can help to not only reduce construction and operational costs but also make the railway more environmentally friendly.
On the way to develop the SWOC systems, the following work is presented to assist the system development and the planning of the test site for on-site demonstration. Firstly, to look for RES to power the system and configure the system setup, the work introduces a power management model to calculate the power and energy demands of the SWOC system. To estimate the life cycle cost (LCC) in long-term operation, the work also builds a cost model to calculate the capital costs and operational costs. Secondly, using the proposed models, the work performs a case study based on the inputs of a railway test site in Sweden, where the SWOC will be built and tested. Then, the SWOC system is compared against the existing OC system. In the end, the benefits of the SWOC systems are summarized, and some suggestions for future development are given.
Methodology
In order to assist the development of the SWOC system and help to make necessary planning before implementation and testing, this section develops a method to calculate the energy and power demand and configure the system setup according to different influencing factors, e.g., operational conditions, geographical conditions and renewable energy sources. Meanwhile, to allow LCC analysis, this section also builds a method to estimate the capital costs and operational costs of the SWOC system in long-term operation. 11
Power and energy
The SWOC system is off-grid and fully powered by local RES, e.g., solar power, wind power and other energy sources. In order to demonstrate the viability of the SWOC concept, this work first studies the configuration and dimensioning of different local RES and energy storage systems (ESS), which can provide sufficient power and energy to operate the SWOC system.
The RES is usually a low carbon energy source which is locally available for free but needs to be harnessed, which has a low impact on the environment. Using renewable energy shall meet the objective of building a sustainable and climate-neutral transport system. Meanwhile, using renewable energy along the railway track can help to make the railway infrastructure self sufficient. However, one of the main disadvantages of renewable energy is the variability in generation, which is dependent on many influencing factors, e.g., geographical conditions, weather conditions etc. However, for the railway system, a reliable and sufficient power supply is the top priority for operational safety and reliability, which limits the application of the RES. Therefore, ESS also need to be implemented to balance the unstable power supply of the RES and the demand of the signalling system.
All infrastructure for generating renewable energy, e.g., solar photovoltaics (PV) and wind turbines, has to be built along the tracks and near the SWOC. The generated electric power is stored in the ESS. When the SWOC needs to use electricity and drive some wayside objects, the energy is provided by the ESS. For the end user of the electricity, the instant power demands and total energy demands of different wayside objects and different functions of the SWOC vary a lot and are dependent on operational conditions. For the electricity provider, the amount of energy supplied is decided by not only the capacity of the electricity generation but also geographical and weather conditions. The ESS need to provide sufficient mean and peak power to the SWOC in the absence of sufficient RES, which decides both the capital and operational costs and the reliability of the system.
Figure 1 shows the method to study the configuration and dimensioning of the RES and ESS. Each SWOC is responsible for powering itself and controlling several wayside objects nearby. The first step is to calculate the maximum instant power peak and total energy of the energy system according to the energy usage and power peak of each energy user of the system, traffic volume, system composition, operational scheme of the wayside objects and location. The second step is to configure the RES to match the energy demand of the SWOC system with respect to the features of the local RES, geographical conditions and weather conditions. The configuration of different local renewable energy sources can be checked against available RES and the local climate conditions. Since most of the RES can neither provide a stable power supply (in a day or throughout a year) nor accommodate a high power peak, the energy storage system is used to balance the difference between the power supply and demand. The third step is to choose the right type of the ESS and dimension the size of the ESS according to the maximum instant power demand and the total energy demand. Of course, at each step, it is necessary to consider some safety margins to keep the energy supply reliable. Eventually, the method can indicate the possibility of using the SWOC system at the location and suggest the system setup (i.e., the configuration of RES and size of ESS). Since the railway system needs a reliable power supply, the boundary conditions of the SWOC system can be derived and a system backup can therefore be calculated. Configuration of local renewable energy supply (RES) and dimensioning of energy storage system (ESS).
Life cycle cost
Life cycle costs (LCC) are all the costs that will be incurred during the lifetime of the product, work or service. The costs form an important part of the assessment of any procedure. 12 The life cycle costs consist of three parts: initial (or capital) costs, recurring (or operating) costs, and disposal costs. 13 In order to evaluate and eventually promote the SWOC system, this work needs to find a method to estimate the LCC in long-term operation and compare its whole-life costs with the existing OC. 11
The LCC can include not only the financial costs but also the environmental and social costs. The financial costs of the SWOC system can be calculated according to the price or cost of each component and the operations & maintenance throughout the lifespan. But normally the environmental and social costs are more difficult to calculate if compared to the financial costs. Since the SWOC system is supposed to be fully powered by renewable energy, which perfectly fulfils the goals for reducing CO2 emissions and building a sustainable transport system, the environmental and social benefits of the SWOC system would be much more considerable than the existing OC system. Due to the difficulty of estimating the environmental and social costs, especially in long-term operations, this work only takes the financial part of the total costs into consideration.
Since the SWOC system is off-grid and fully powered by the RES close to the SWOC, the cabling-related costs are significantly reduced and the energy-related costs can even be totally removed. To reflect the benefits of the SWOC system over the existing systems, this work then proposes a method to estimate the LCC of the SWOC in long-term operation, as shown in Figure 2. The first step is to calculate the initial costs, which are decided by the layout of the questioned station or line, the position of all the wayside objects (WO), the position of the SWOC, and the setup of the RES and ESS. Based on the prices of designing, material and equipment procurement, cabling, civil work, and installation, the initial costs of the SWOC can be derived. Correspondingly, for the existing OC, the initial costs of the OC can be calculated, but the costs of the installation of the long power cable from the remote electric power supply to the OC are added to the initial costs. The second step is to calculate the recurring costs. Regarding the recurring costs, there are two parts: energy costs, which are saved because of the application of RES, and maintenance costs, which are linked to regular inspections, service and replacements/repairments of some key components. Economic factors like interest rates and inflation need to be considered. For the existing OC system, the energy costs are related to traffic volume, operational scheme and energy price. The third step is to estimate the disposal costs when the service life of the system is due. The sum-up of the three kinds of costs is the life cycle costs of the system. Regarding the initial costs, the big change between the SWOC system and the existing system is the removal of the installation of the long power cable from the remote electric power supply, so much civil work and cabling work can be avoided. For the recurring costs, since the cabling part is much simplified, the corresponding maintenance costs and energy costs during long-term operation are saved. Meanwhile, extra costs associated with the installation of local RES and ESS incur. By comparing the LCC of the SWOC and the existing OC, the marginal profit of the SWOC can be estimated. Estimation of life cycle cost (LCC).
Case study
Although the methods to configure the SWOC system and calculate the LCC are mentioned in, the system is dependent on many practical factors, e.g., traffic volume, layout of station or railway line, operational conditions, location and weather conditions, so it is hard to explicitly reflect the benefits of the SWOC system over the existing OC system. This section takes all the factors of a test site in Sweden, where the SWOC system will be built and tested, as a case study to assist the development of the SWOC and estimate the LCC in long-term operation. 11
Scenario description
The SWOC system is being built and tested at Tortuna station in central Sweden, a test site of the Swedish road and rail transport administration (Trafikverket). In order to assist the development of the SWOC system and the following testing activities in the future, this work takes Tortuna station for a case study. All the input factors for system configuration and cost estimation are based on the test site.
The location of Tortuna station is shown in Figure 3, so geographical and meteorological information on history can be acquired from the Swedish Meteorological and Hydrological Institute (SMHI). Furthermore, the local RES, e.g., the wind speed, sunlight radiation and duration and ambient temperature, can be correspondingly collected. The station is about 700 m long. There are six optical signals, four switches and one level crossing equipped at the station. There are two point machines for each switch and two movable barriers with warning lights for the only level crossing, as shown in Figure 4. All the wayside objects are almost located at the two ends of the station with a spacing distance of 700 m. For the OC system, all the wayside objects are driven and linked to the OC in the middle via cables installed through the station area, and an extra power cable is installed to get electric power from either the nearest station with electricity or the public grid. For the SWOC system, two SWOCs are separately installed at the two ends and each SWOC controls the wayside objects nearby. One of the two SWOCs works as master SWOC which is responsible for communication with both the CTC centre and the other SWOC (slave SWOC). Since the two SWOCs get power from the local RES, it is not necessary to install cables through the station. Figure 5 compares the schematic layouts of the centralized OC system and the SWOC system. Location of Tortuna station for on-site testing of SWOC. Testing facilities at Tortuna station: (a) Switch and point machines; (b) Movable barrier and warnings on level crossings. Schematics of (a) existing object controller (OC) powered by nearest electricity supply; and (b) smart wayside object controller (SWOC).

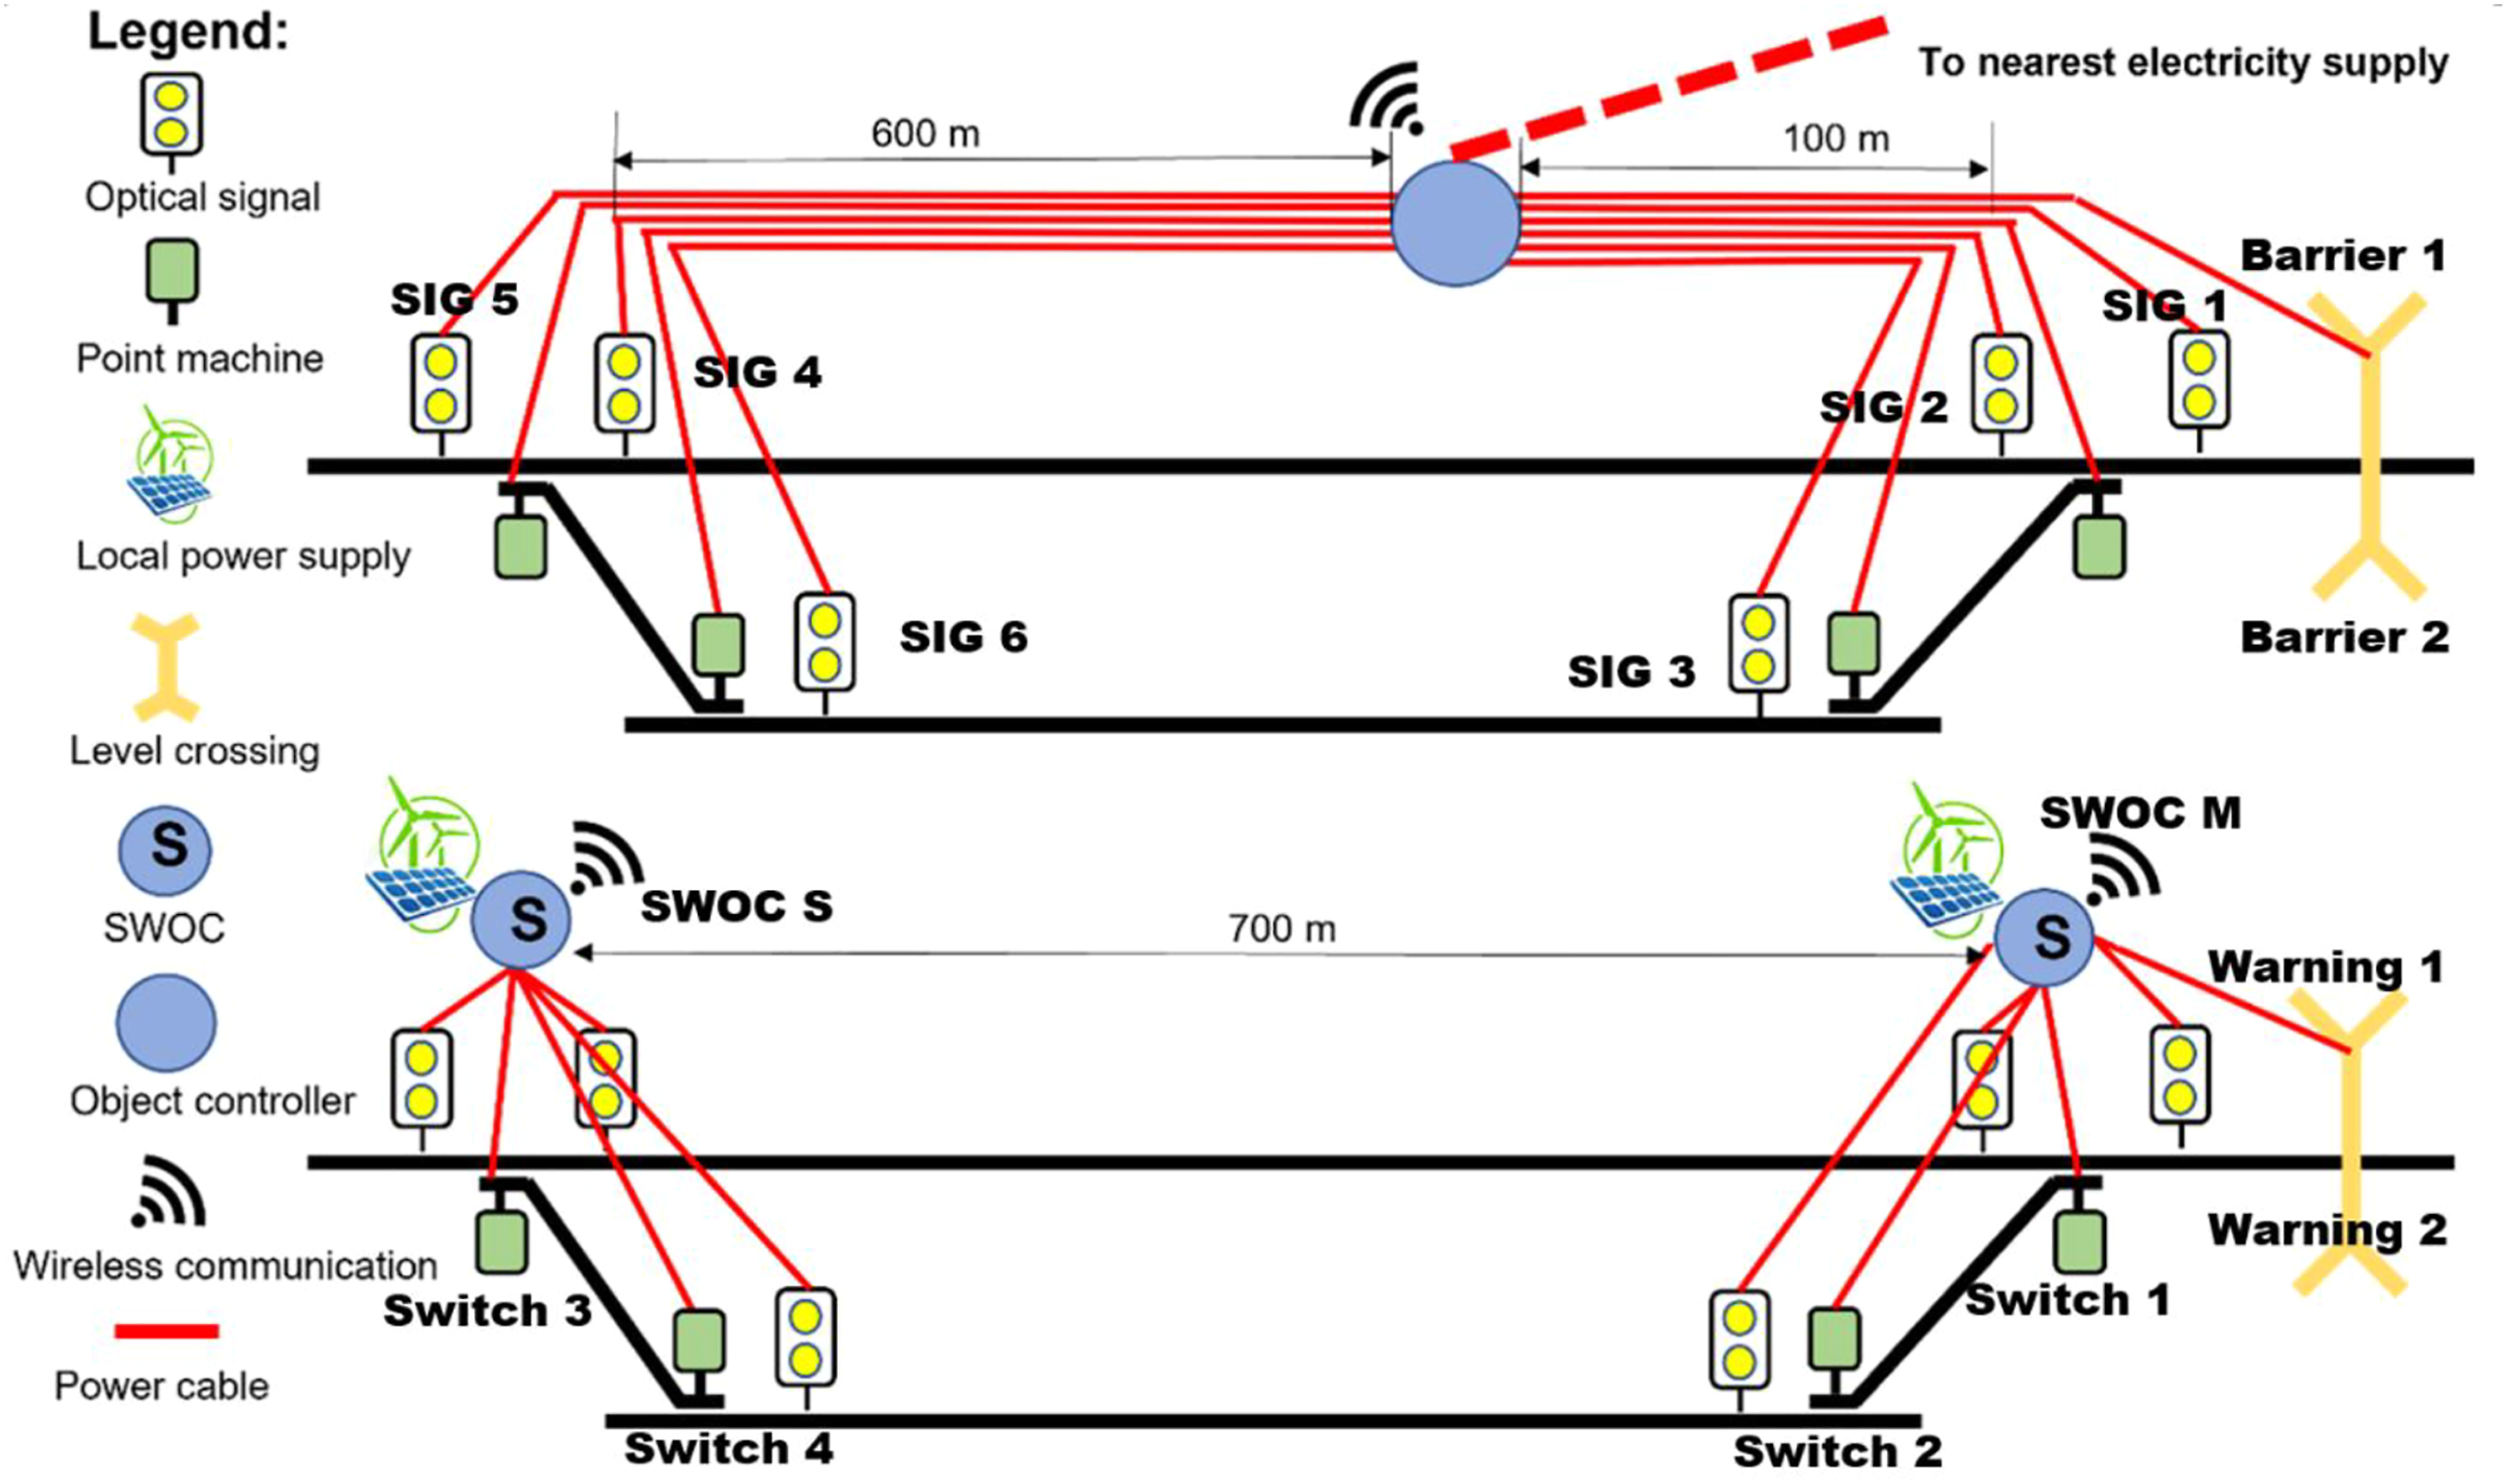
Composition of devices which uses energy (Confer to Figure 5).


Results and discussion
Based on the location, station layout, the composition of wayside objects, geographical conditions and weather conditions, and assumed traffic volume and operational scheme, it is possible to estimate the energy usage, maximum instant power demand and total costs according to the methods proposed. Meanwhile, in order to compare the SWOC system with the existing OC system, based on some assumptions the energy and total costs are calculated according to the same methods. Due to commercial confidentiality, the actual values of the energy and costs are not shown in this section. Instead, the calculated relative values are shown in graphical figures for comparison. Since the SWOC system is still under development and in long-term operation there are many uncertainties which can affect the system, the results shown and discussed in this section are not optimized and are only rough estimations based on some assumptions.
Configuration of local RES and ESS
Firstly, it is necessary to find out the possible local RES which can provide sufficient energy to power the two SWOCs. Of the two SWOCs, the most energy-demanding SWOC is the master SWOC which is responsible for powering three optical signals, two point machines, two level-crossing barriers with warning lights and communication with the CTC centre and the other SWOC. The daily energy demand can be calculated according to the energy usage of each movement (or operational time) of the energy-using devices and the operating scheme (or duration). The maximum instant power is derived from the superposition of the instantaneous power of all the energy-using devices.
Renewable energy utilization is limited due to its availability during a specific time. This work only takes into consideration the solar power generated by solar PV and the wind energy generated by the wind turbines. The type and size of the ESS are dependent on the large discrepancy between the energy production and energy requirement as well as the maximum instantaneous power demand. Since the daily energy generation from the local RES at Tortuna station is highly variable and an ESS needs to balance the variation, the energy generation of different RES (solar power and wind energy here) and energy demand of the SWOC are checked at a monthly scale, as shown in Figure 7. Monthly energy production is supposed to cover the energy need in the corresponding month, as indicated by red line in Figure 7. The ESS is responsible for purely powering the SWOC system for some days without power supply from the RES (in case of bad weather condition etc.), so a very small ESS is used here. Regarding dimensioning, the size of the ESS is, therefore, determined for covering the daily energy demand and the assumed days without support of RES. The size of the RES is configurated with respect to the daily energy demand and some redundancy for the charging of ESS. Comparisons of renewable energy production and energy demand: (a) Solar PV; (b) Wind turbine.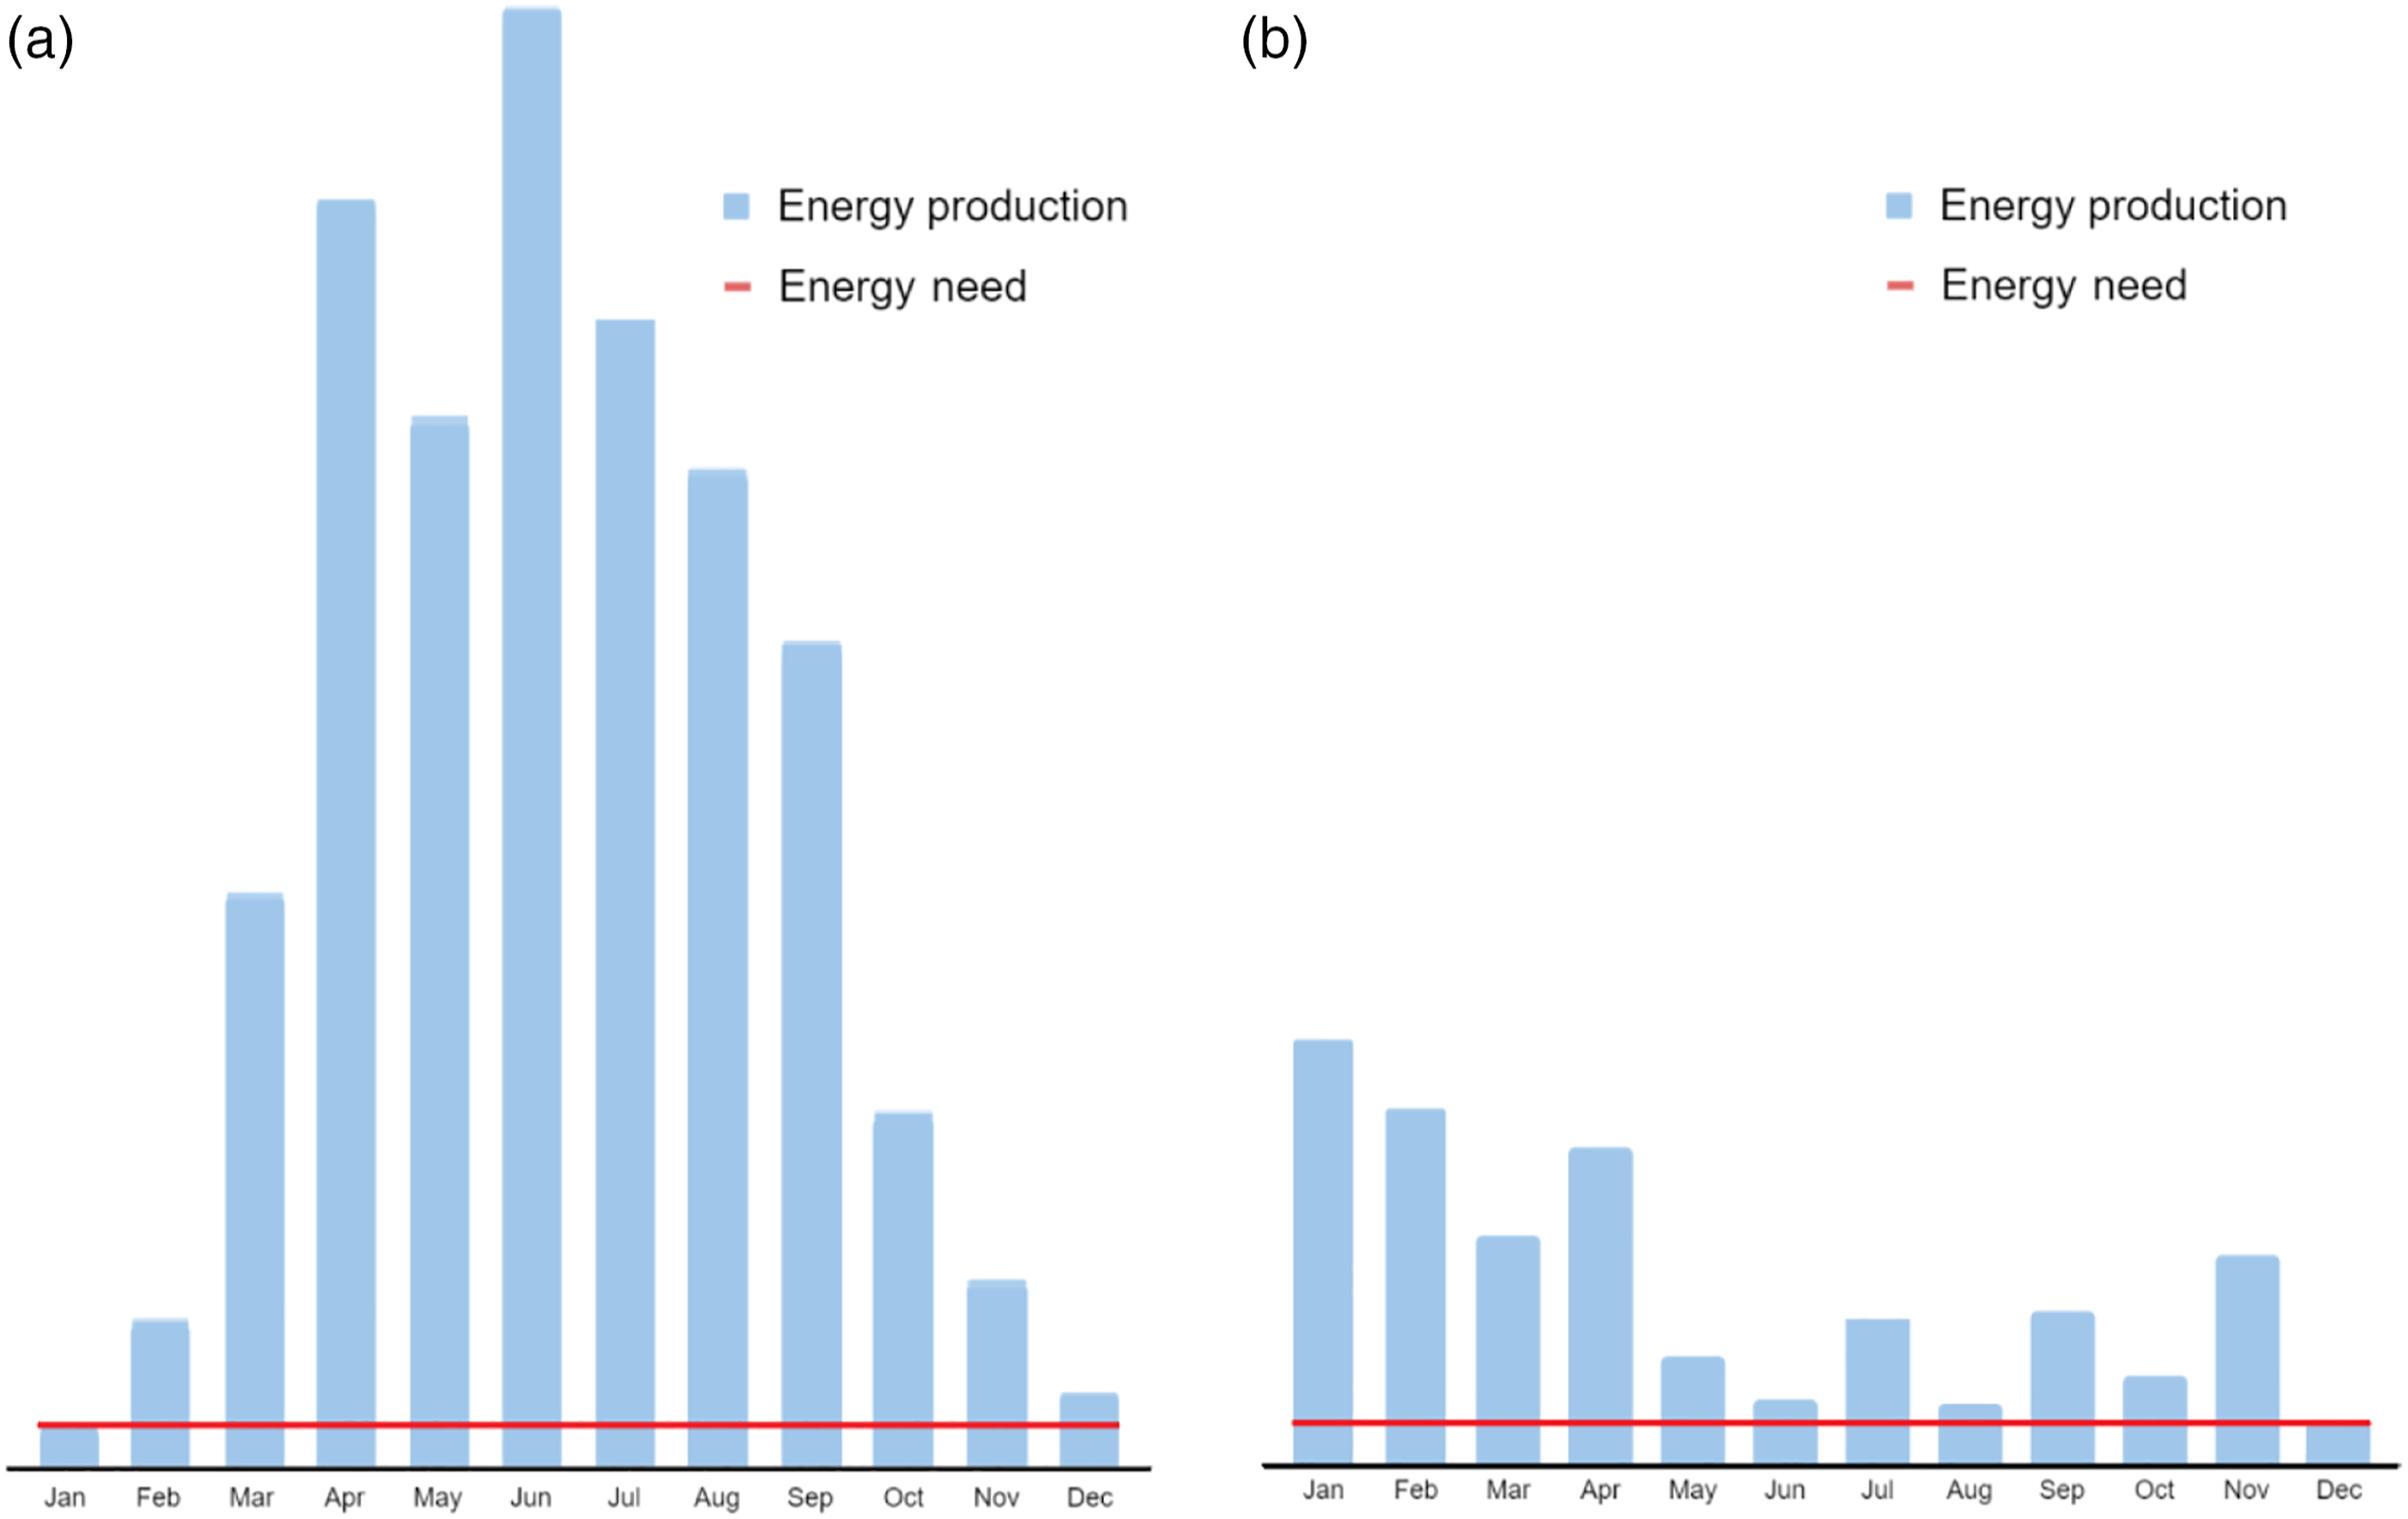
In Tortuna the energy production from solar PV is high during the summer months but very low during the winter months (December and January). The monthly energy production has a very large variation though a year and is continuously dropping from September to January. As the energy production is low energy in the two winter months and with a fixed size of the ESS, it is required to have a large very size of solar PV, which increases the costs and makes the whole system very sensitive to the local weather conditions. Regarding wind power which depends on the size of the wind turbine and the wind speed, the acquired wind power is based on the annual wind and weather statistics of a nearby place. 14 The variation of energy production of the wind turbine is much smaller than that of the solar PV. The challenging months are June, August and December (December is the most challenging month). The monthly energy production fluctuates and the low production months are not consecutive, so the size of wind turbine does not need to be largely oversized for these challenging months. To reduce the size of the RES and make the energy supply less sensitive to weather conditions, increasing the size of the ESS can help to balance the variation of energy production throughout a year. For the solar energy supply, due to the two consecutive challenging months, the system still needs both a large size of solar PV and large size of ESS to balance the variation. For the wind energy supply, it is suggested to let the energy surplus in November compensate for the energy deficit in December (similarly, May for June and September for August), so both the size of the RES and the ESS does not need to be much oversized, which can help to reduce the costs and increase the system reliability. Therefore, for Tortuna station, it can be seen that wind power is more suitable to drive the SWOC system than solar power. The ESS should have the ability to store energy for a relatively long time without much energy loss. The lowest measured temperature of a nearby location in the past five years (from 2017 to 2022) is −20°C, 15 so low-temperature lithium batteries available from the market can meet the working condition and are proposed to be used here. (In case of extremely cold weather, some thermal insulation for the batteries is supposed to protect the SWOC system.)
The energy production of RES is dependent on geographical location and weather conditions. To provide a constant and reliable energy supply to the SWOC system, the RES at the location with low variation throughout a year is suggested to be used. For some locations, a combined installation of both wind turbine and solar PV can be used to balance the significant variation in the energy generation in a year.
Life cycle cost analysis
In order to show the benefits of the SWOC system over the existing OC system, the LCC of the two systems are estimated and compared in this section. Since the LCC is affected by many factors, some of which are based on assumption, it is very difficult to estimate the exact costs in a long-term operation, especially when the product is under development and not available in the market. The costs are roughly calculated according to the method proposed. To simplify the calculation, disposal costs and environmental and social benefits are not considered. Due to commercial confidentiality, the costs of the SWOC system and the existing OC system are only expressed with a cost index.
Most railway systems have a lifespan of 25–50 years. 16 The wind turbine has a lifespan of 20–40 years with an annual maintenance cost of 1.5–2% of the initial cost for inspection, cleaning, lubrication and repairment.17,18 The lifespan of solar PV is 25–30 years with an annual maintenance cost of 1–2% of the initial cost for cleaning and preventive/corrective maintenance.19,20 The lifespan of ESS is determined by many factors and is difficult to be accurately calculated. The lifespan of electric car batteries is 10–20 years 21 and most electric car manufacturers have an eight-year guarantee of the batteries, 22 so the lifespan of the batteries of the SWOC system is assumed to be 15 years. Based on the information above, the lifespans of SWOC are assumed to be 30 years. There is only some maintenance of the RES needed within the lifespan while the batteries are supposed to be replaced after about 15 years. Since the batteries are to be replaced for sure, the costs of battery renewal are counted as part of the initial costs for simplification. In the long-term operation, the performances of energy harvesting and energy storage will reduce due to degradation and different weather conditions (e.g. lowest and highest temperature, wind speed, etc.), operational conditions (e.g. battery’s depth of discharge, charge/discharge cycles, etc.) and types of technology (e.g. manufacturers, maintenance requirement, technical development, etc.). Therefore, in practice, some redundancy of the RES and ESS should be given, which increases the relevant costs. However, to simplify the calculation, now only the norminal values are used and the redundancy is not considered.
Because the disposal costs are not considered, the LCC consists of only initial (or capital) costs and recurring (or operating) costs. The initial costs include system design, procurement of materials and equipment, construction and installation. For the existing OC system, the system design is complicated, a 700 m-long cable duct needs to be built through the station and much more cabling work is needed to connect the system to the nearest electricity supply. In this work, it is assumed to be used on a non-electrified line in a remote area where it is far away from the electricity supply. For the SWOC system, the design is simplifed, but the design cost is still assumed to be the same. The long cable duct through the station is avoided and the cabling work related to the installation of the power cable from the nearest electricity supply is totally removed, but the costs related to the ESS and the local RES are added to the SWOC system. Figure 8 shows that regarding the total initial costs, the SWOC system can save nearly 50% compared against the OC system. Comparison of LCCs of OC and SWOC.
The recurring costs consider the regular maintenance work, energy costs and moderate inflation. It is difficult to estimate the recurring costs in a long-term operation before the product is available, so an estimation is based on the following assumptions. During the lifespan, a constant inflation of 2% is used. For the existing OC system, it is needed to do regular inspection and maintenance of the long cable and cable duct through the station area and the long power cable from the nearest electricity supply to the station. The maintenance cost of the power cable and infrastructure per length is assumed to be a small percentage of the total maintenance cost of today’s track infrastructure (including track, signalling, electrification, etc.). The electricity costs in long-term operation increase the recurring costs, especially when the energy price can fluctuate very much in a long lifespan. In the study, a fixed electricity price from many other studies is used. For the SWOC system, the maintenance costs of the infrastructure can be much saved and the energy costs from the grid can even be nil, but the maintenance costs of the RES and the ESS are added. To simplify the calculation, the maintenance costs of the RES are assumed to be 2% of the initial cost of the RES. For the ESS, since the batteries are to be replaced in the middle of the lifespan, the costs of battery renewal are counted as a part of the initial costs. Figure 8 shows that the SWOC system has very low recurring costs compared to the OC system. Based on the input of Tortuna station and the necessary assumptions, the total LCC of the SWOC system can be reduced by 70% compared with the existing OC system.
Because the SWOC system is still under development and there are many uncertainties which can still affect the system development and testing/operation (e.g. operational conditions and weather conditions), the actual costs of the SWOC system are still unknown. The LCC analysis shown in the study is based on a rough estimation to show the benefits of the implementation of the SWOC system. In case of performance degradation, emergency situations and extreme weather conditions, it is needed to set a safety factor by oversizing both the RES and the ESS, which will correspondingly increase both the initial costs and recurring costs. To cover the development costs and make profit in business, the procuring price of SWOC itself would be higher than that of the existing OC system. The increased costs mentioned above will minimize the calculated benefits (i.e. 70% of LCC reduction) of the SWOC system over the OC system, but a considerable benefit can still be expected. The financial benefits can get significant in countries where both labour costs and energy costs are getting higher and higher. Since the world is focusing on environmental protection and reliability of energy supply, stringent energy policies are being planned/implemented in many countries. The application of RES in the SWOC system meets the demand for more affordable, secure and sustainable energy. If the environmental and social benefits can be considered, the SWOC system can, therefore, help to build a sustainable and carbon-neutral railway transport system, which can maximize the value of the SWOC system.
Conclusions
This work studied the concept of a smart wayside object controller (SWOC) which is powered by a local renewable energy sources (RES) and wirelessly communicates with the CTC centre and other SWOCs. To demonstrate the viability of the SWOC system, a method to calculate system energy demand and investigate a possible solution for a local RES. To further show the benefits of the SWOC system over the existing OC system, this work developed a method to estimate the life cycle costs (LCC) of the SWOC in long-term operations. With the help of the developed methods, this study performed a case study based on a railway test site in Sweden to investigate the implementation of the SWOC system and to compare the SWOC system with the existing OC system. Through this work, the following conclusions can be drawn: • It is possible to use local RES to fully power the SWOC system. However, the RES should be carefully studied because the RES is not stable and sometimes cannot meet the energy demand of the SWOC system. • Compared with the OC system, the SWOC shows a significant cost saving in long-term operation because of removing cabling and installation, reducing maintenance and replacing the power supply with renewable energy. • Geographical locations and weather conditions are decisive factors for the utilization and dimensioning of RES and ESS. To provide a constant and reliable energy supply, these two factors need to be carefully studied in the application of the SWOC system.
In addition, the SWOC system has more benefits than the OC system in technical, environmental and social aspects. The SWOC system is decentralized and not limited by the external electric power supply, which gives more flexibility in the implementation of the SWOC. This feature is quite beneficial for non-electrified railway lines in rural areas, where it is hard and costly to acquire an external electric power supply. The SWOC system also has a simple physical structure in the railway station, so the costs in construction and operation can be much reduced. From environmental and social aspects, a fully renewable energy-driven system fulfils the demands for building a sustainable and climate-neutral transport system, which can promote the eco-friendliness of the railway transport sector and eventually contribute to a carbon-neutral society in the future.