
Abstract
Introduction
Wheat grains typically contain between ca. 2000 and 4000 mg kg−1 phosphorus (P). In wheat, over 50% of this P is found in the organic storage form of myo-inositol-hexakisphosphate (phytic acid). 1 About 90% of this phytic acid is found in protein bodies in the aleurone layer of the grain where it is present as phytate, the Ca, K, and Mg salts of phytic acid. 2 The proportion of the total-P (TP) present in phytate increases to about 85% as the total-P increases and there is a strong positive linear correlation between total-P and phytate-bound-P (PP) with r2 values greater than 0.7 reported for wheat from field studies and up to 0.98 for wheat plants grown in a greenhouse. 3 Strong linear correlations also occur in pig and poultry rations 4 and in mixed feed rations. 5
The cultivation of high yielding cereal genotypes that accumulate a reduced concentration of P into the grain would be desirable. The amount, and cost, of fertilizer P needed to produce food grains would be lowered and the sustainability of the global non-renewable phosphate deposits would be extended. 6
Cultivars with a reduced grain total-P concentration would bring an associated reduction in the concentration of phytate-bound-P and this would improve the bioavailability of minerals, such as calcium, iron, magnesium and zinc, that are required for good health of humans and monogastric animals. 7
Higher grain yields of cereal crops are achieved by applications of fertilizers. This need not lead to an increase in the amount of P exported from farmland in grains because there is considerable diversity in the concentration of P in grain from genotypes that achieve comparable high yields or high grain to shoot dry matter ratios. Based on published data for cereal grains, the export of P per tonne of grain could be reduced by 18 to 25%.8–11
It is also possible to reduce the concentration of phytate-bound-P in cereals, without reducing the total-P concentration by cultivating genotypes that carry one or more genes that lower phytate. 12
Plant breeders who choose to screen genotypes for a lower grain total-P concentration and/or a lower phytate or phytate-bound-P concentration will need to use a rapid, reliable, economical and ‘user-friendly’ analytical technique. Traditional wet chemical analytical procedures used to determine total-P and especially phytate are time consuming and costly and not suited to screening the large number of samples collected from cereal breeding plots at harvest or soon after.
Near infrared (NIR) spectroscopy is the analytical tool of choice as it enables the rapid, reliable and cost-effective screening of large numbers of samples with only minimal preparation. This is evidenced by the widespread adoption of NIR spectroscopy to determine protein in cereals. It is widely believed that elemental minerals do not absorb near infrared electromagnetic radiation. 13 However, studies of pure solutions, reviewed by Workman and Weyer 14 indicated that near infrared radiation is absorbed at 5241 cm−1 (1908 nm) by P-OH bonds, at 5288 cm−1 (1891 nm) by P-H, and at 5076–5002 cm−1 (1970-1999 nm) by P-SH as a weak doublet.
Summary of selected published reports on the determination of total-P and phytate-bound-P in plants, cereals, cereal-based feeds and animal excreta using near infrared spectroscopy.

NR Not reported.
R2c: calibration coefficient of determination; r2cv: cross validation coefficient of determination; r2val.validation coefficient of determination.
RMSEC: root mean square error for the calibration; RMSECV: root mean square error for the cross validation; SEP: standard error of prediction.
aNot apparent in Phytate P correlation.
bNot apparent in Total-P correlation.
In the studies of samples of cereal products listed in Table 1, phytate-bound-P would have been the dominant P pool with a strong linear correlation between total-P and phytate-bound-P. For these reasons, it is probable that the NIR-based analyses for total-P and phytate-bound-P are inter-dependent. De Boever et al. 5 compared correlation plots and noted similar wavelength absorption patterns for total and phytate-bound-P.
The aim of the study reported here was to test the hypothesis that NIR spectroscopy calibration models for total-P and phytate-bound-P utilize similar wavelengths. The set of whole wheat grains samples used to compare calibrations was unique due to the weak correlation between total-P and phytate-bound-P.
The ultimate goal of this research is to assist plant breeders to identify genotypes that utilize phosphorus more efficiently to achieve high yields and assist animal feed formulators to prepare least-cost rations.
Materials and methods
Grain samples
Wheat (
At maturity, grain yield was recorded, and grain protein determined by routine analysis using NIR spectroscopy. Samples were then stored, as is, in paper bags placed in a cool room (ca. 4°C and 23% RH) then allowed to equilibrate in the laboratory at 20°C and 60% RH prior to being assessed for physical traits, analysed for chemical composition and scanned using a visible-near infrared spectrometer.
Whole grain samples obtained from replicate 1 (
Reference data
Macro- and micro-elements in whole wheat grains were determined after digestion in nitric acid:H2O2 following Wheal et al. 23 then mineral analysis using ICP-MS spectroscopy (ICP-MS 7500x; Agilent, Santa Clara, CA, USA; Joukhada et al. 24 ). For control, each digestion batch included a blank and certified reference material (CRM; NIST 1567a wheat flour).
Phytate-bound-phosphorus (PP): Approximately 1–1.2 g of whole wheat seed was weighed and milled in a Brabender SM3 break mill (Brabender/Anton Paar, Duisberg, Germany) set at zero particle size. All of the sample milled, including bran particles that were retained inside the mill, was recovered and accurately weighed into a screw cap tube and then 20.0 mL of 3% trichloroacetic acid (TCA) was added followed by vigorous shaking for 1.5 h.
After centrifugation (27,000 × g for 10 min), the supernatant was filtered using a syringe filter (0.2 µm) and analysed by HPLC isocratic chromatography using a Shimadzu HPLC (Shimadzu Corp., Kyoto, Japan) comprising a LC series pump, SPD detector and CBM controller, and fitted with a Hamilton PRP–X100 column (150 × 4.6 mm; 5 µm particle size; Hamilton, Reno, NV, USA) with a mobile phase of sodium nitrate (0.2 M adjusted to pH 2.5 with nitric acid). Detection of phytate (IP6 isomer) was by post column reaction with Wades reagent (0.031 mg mL−1 Fe3+; 1.5 mg mL−1 sulfosalicylic acid (SS acid)) and the absorbance measured at 500 nm. Lower isomers of inositol-phosphate elute earlier than the IP6 isomer and were only detected at very low concentrations.
The purple colour of Wades reagent is reduced when phytate forms a complex with Fe-SS acid and this reduces the absorbance at 500 nm. Phytate was then calculated using a standard curve constructed using varying quantities of a 2.0 mg mL−1 solution of phytic acid (P1916, Sigma-Aldrich, Bayswater, VIC, Australia).
Near infrared spectroscopy
Whole grain samples were placed into 97 mm diameter low-OH quartz sample cups with a sample depth of at least 20 mm. Spectra were acquired using a Bruker MPA FT-NIR spectrometer (Bruker Optics, Ettlingen, Germany) equipped with integrating sphere (diffuse reflectance) and RT-PbS detector. Spectra were acquired in the spectral range 12,500-3600 cm−1 (ca. 800-2780 nm) at a spectral resolution of 4 cm−1 with 64 co-added scans per spectrum. The sample cup was rotated during measurements to increase the contact area for the heterogenous whole grain samples. OPUS software (v8, Bruker Optics, Ettlingen, Germany) was used to acquire spectra and the data were then processed using The Unscrambler (v11, Camo Software AS, Oslo, Norway).
Prior to developing calibrations for total-P, the 229 available samples were sorted according to their total-P concentration, and, to reduce sampling errors, the mean reference values and spectral data for 3 sequential samples were calculated for modelling. A ‘box car’ set of samples was then selected to reduce the effect of calibration to a mean. 25 Similarly, prior to developing calibrations for phytate-bound-P the 229 available samples were sorted according to their phytate-bound-P concentration, the mean reference values and spectral data for 3 sequential samples were calculated and a ‘box car’ set of samples selected. Prior to testing models the reference values and the spectral data of the validation samples were also sorted and reduced to 3-samples mean values.
Prior to spectral pre-treatment, the spectral range was first reduced to 10,000 to 4000 cm−1 (1000-2500 nm) to eliminate portions of the spectra that did not contribute useful information. Spectra were pre-processed using first or second Savitzky-Golay 26 derivatives using a 19-point window with second order polynomial fit.
Principal component analysis (PCA) was performed using the first and the second derivative spectra of the 229 calibration set samples.
Partial least squares (PLS) regression calibration models were ranked and compared using the calibration R2 and RMSEC, and from cross-validation the r2 and RMSECV. The best models were then validated against samples taken at harvest from replicate 2 of the field experiment.
Results
Grain protein, total-P, phytate-bound-P, yield and minerals
For the 229 samples from replicate 1, the protein ranged from 11.2 to 14.3%, total-P ranged from 2500 to 4700 mg kg−1 and phytate-bound-P from 1100 to 3100 mg kg−1 P (Figure 1). Due to the skewness (−0.46) in phytate-bound-P values, there was a weak relationship (r2 = 0.5) between total-P and phytate-bound-P and 13 % of the samples had a phytate-bound-P:total-P (PP:TP) ratio of less than 50% (Figure 2). Box-whisker plot showing the distribution of total-P (SD 320 mg P kg−1) and phytate-bound-P (SD 360 mg P kg−1) in 229 whole grain samples. Correlation between total-P and phytate-bound-P in 229 whole grain wheat samples.

Summary of the influence of the lpa gene (s) on wheat yield and composition (means of 15-samples).
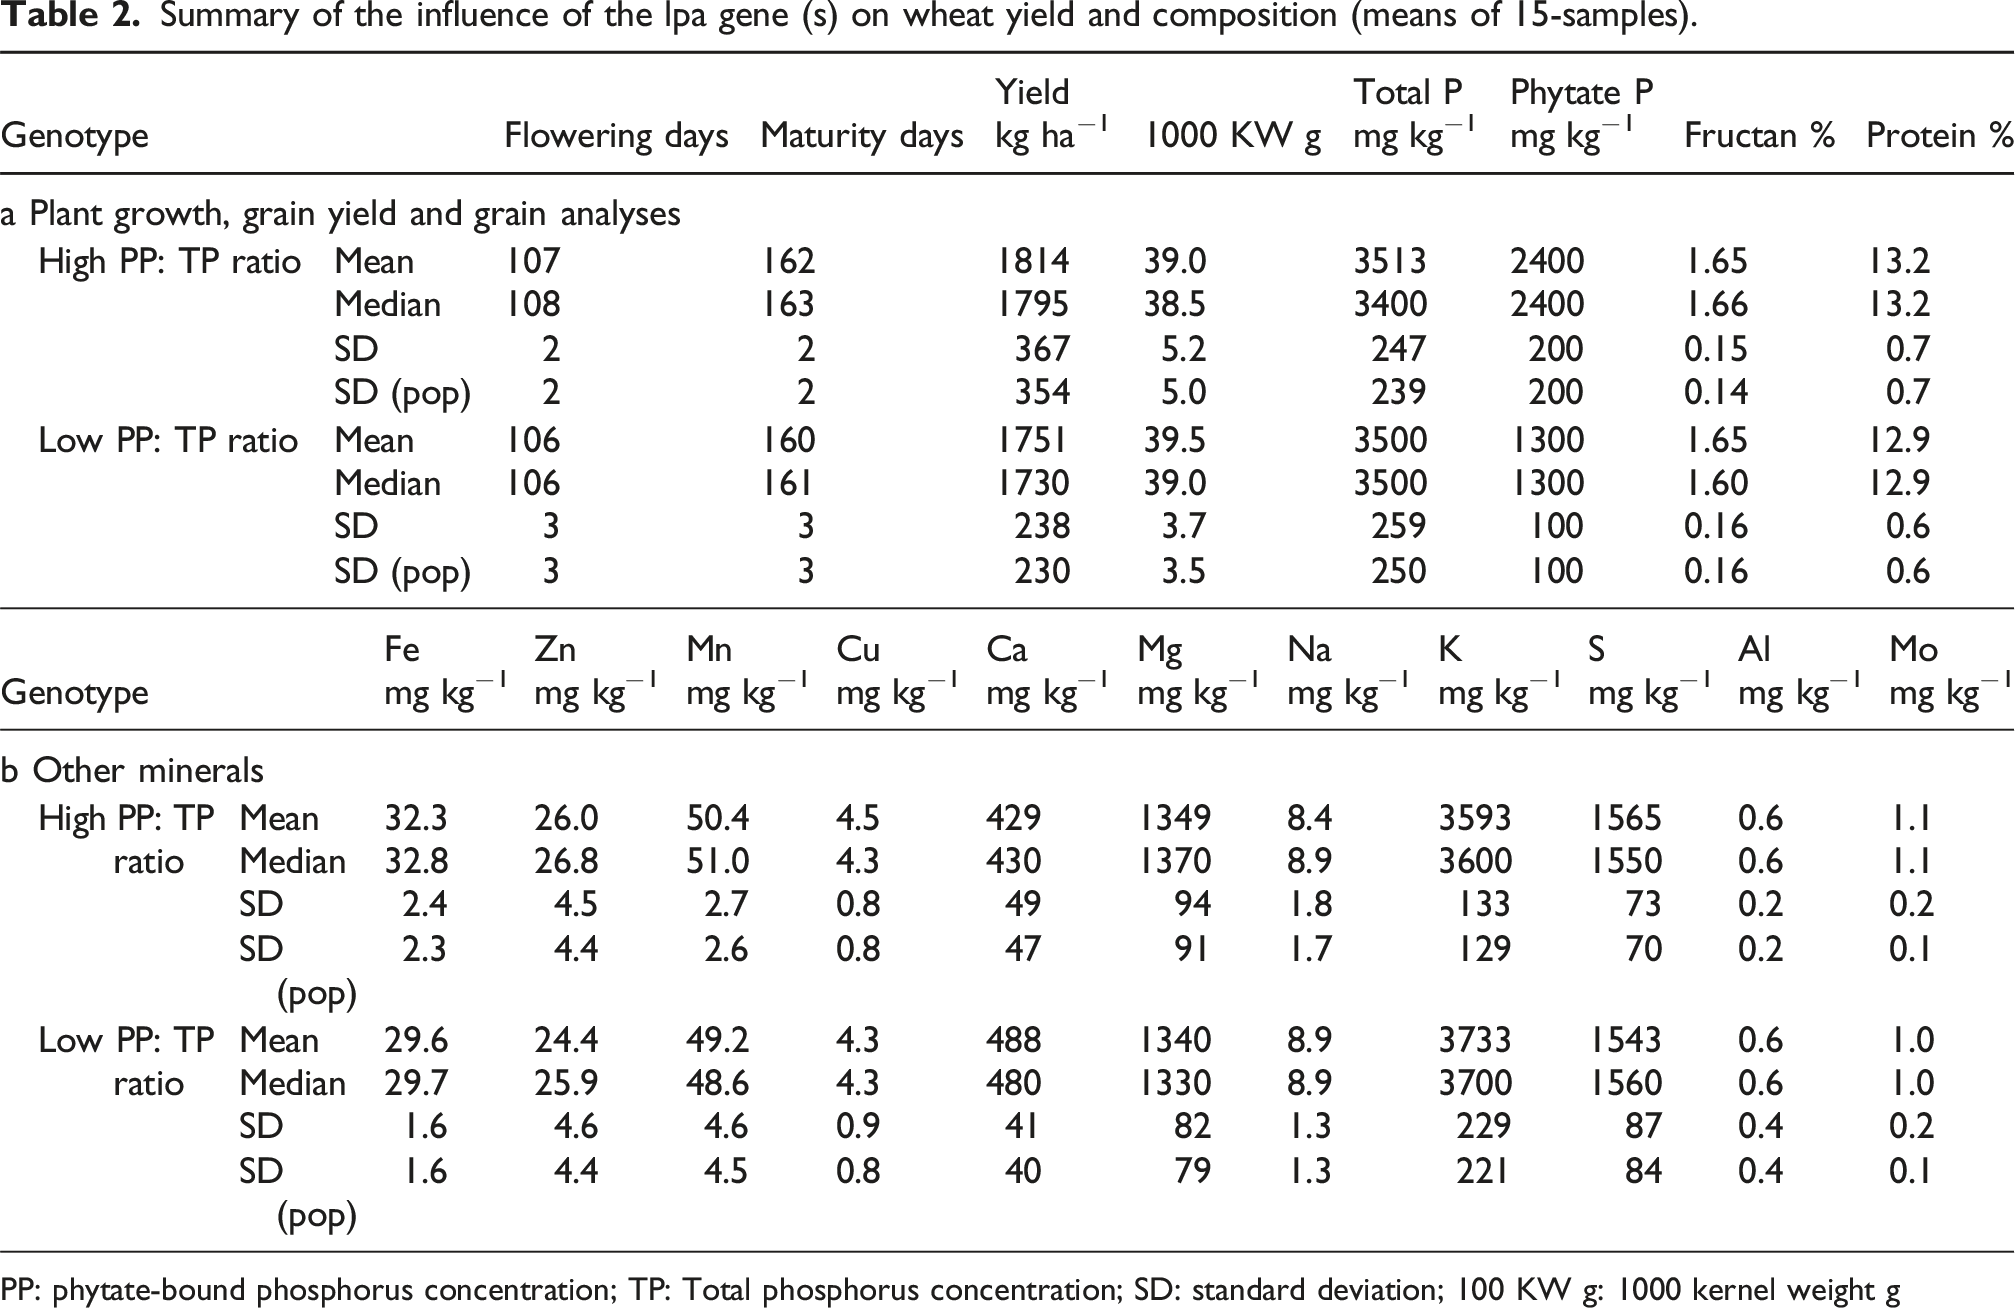
PP: phytate-bound phosphorus concentration; TP: Total phosphorus concentration; SD: standard deviation; 100 KW g: 1000 kernel weight g
Visible-NIR spectra of whole grains
The spectra of the parent lines
The mean log1/R spectra, the first derivative spectra, and the second derivative spectra for the two parent lines are presented in Figure 3(a)–(c). Difference spectra between the two parent lines and between 15 low and 15 high phytate samples derived from the parent lines are shown in Figure 4. These spectra are representative of the spectra of all calibration and validation samples ( Mean of spectra of four low phytate parent samples (IRS 812.9, 1300 mg P kg-1, black line) and of four normal, high phytate parent samples (IDO 637, 2600 mg P kg-1, red line) (a) Log1/R spectra, (b) first derivative spectra (Savitzky-Golay, 19-point window), and (c) second derivative spectra (Savitzky-Golay, 19-point window) with expansion of region from 5500 to 5000 cm−1. Difference spectrum between (a) the mean of the first derivative spectra of 4 low (IRS 812.9) and of 4 high phytate (IDO 637) parent samples from Figure 3(b), and (b) the mean of the second derivative spectra of 15 low and 15 high phytate samples (Figure 3(c)), derived from the parent lines.

The difference spectrum based on the first derivative (Figure 4(a)) was dominated by a major peak at 5276 cm−1 with lesser peaks at 7035, 4902 and 4427 cm−1. The zero-crossing points associated with these peaks at 7105 cm−1 (1407 nm), 5153 cm−1 (1941 nm), 4937 cm−1 (2025 nm) and 4466 cm−1 (2239 nm) may be assigned to absorbances at O-H, O-H, N-H and C-OH respectively. 14
The difference spectrum based on the second derivative spectra of samples with a low PP:TP ratio compared with samples with a normal PP:TP ratio (Figure 4(b)) revealed that grains with a low PP:TP ratio were different primarily at wavenumbers that may be attributed to P-OH at 5245 cm−1 (1907 nm) and O-H at 7124 (1404 nm) and possibly at 5311 cm−1 (1882 nm) bonds; with weaker changes due to C-H at 5944, 5882, 4374, 4103 and 4023 cm−1 (equivalent to 1682, 1700, 2286, 2437 and 2486 nm), C-OH at 4485 cm−1 (2230 nm) and N-H or C-N at 7004, 4972 and 4894 cm−1 (equivalent to 1428, 2011 and 2043 nm) bonds. 14 These changes (other than N-H and C-N) are consistent with the action of lpa genes, at one or more biochemical steps, involved in the conversion of glucose-6-phosphate to phytic acid. 27
Principal component analysis (PCA)
Principal component analysis (PCA) was performed on all 229 samples from replicate 1. Using first derivative spectra the first three principal components explained 64, 32 and 1.5% of the variance respectively (Figure 5). The first PC of the first derivative had significant absorbances at 7043, 5276 and 4420 cm−1. The zero-crossing points associated with these peak absorptions (corresponding to peak maxima in the raw spectra) were assigned to O-H at 6815 and 5138 cm−1 (1467 and 1935 nm), to C-H at 7189 and 4316 cm−1 (1391 and 2317 nm) and to C-OH at 4485 cm−1 (2230 nm). Loadings plot for the first two principal components from PCA of first derivative spectra of whole wheat grains (229 samples, Savitzky-Golay first derivative (19 point, 2nd order polynomial, 10,000–4000 cm−1).
PC2 contained major peaks at 7120 and 5244 cm−1 that relate to absorbances due to O-H at 6817 cm−1 (1467 nm) and 5284 cm−1 (1893 nm) 14 (Figure 5).
Scores plots based on PCA using first derivative spectra (Figure 6) indicated that grains with less than 1500 mg kg−1 of phytate-bound P were mostly separated from grains with greater than 2600 mg kg−1 of phytate-bound P by the second principal component. Score plots based on first derivative spectra with highlighting of 15 samples with low phytate (<1500 mg P kg−1) and 15 samples with high phytate (>2650 mg P kg−1).
Using second derivative spectra, the first three principal components explained 50, 15 and 3% of the variance respectively, where PC1 had a dominant peak at 5245 cm−1 (1907 nm, assigned to P-OH) and PC2 had a dominant peak at 5276 cm−1 (1895 nm) due to O-H and another at 5311 cm−1 (1882 nm) cautiously assigned to O-H bonds. 14
Partial least squares (PLS) regression
Summary of PLS calibrations with spectra reduced to 10,000–4000 cm−1 (1000–2500 nm) using ‘box car’ sets taken from 77 3-sample means.

a1D = First derivative, 2D = Second derivative. Other abbreviations as for Table 1.
The loading weights for the total-P and phytate-bound-P models generated using first derivative spectra are presented in Figure 7. Within each factor the dominant peaks for total-P and phytate-bound-P occurred at exactly the same or essentially the same wavenumbers. Comparison of loading weights for total-phosphorus (black line) and phytate-bound-phosphorus (red line) for first derivative PLS regression models for (a) latent variable 1, (b) latent variable 2, and (c) latent variable 3. Note the change in wavenumber scale between PC1, and PC2 and PC3.
Validation of the best models
Summary of validations using the first derivative models reported in Table 3 and grain samples (

r 2 p = prediction coefficient of determination, SEP = standard error of prediction.
Discussion
Using NIR spectroscopy to determine the total-P and the phytate-bound-P in grains simultaneously has advantages in terms of facilities, technical skills, time and cost over the traditional wet chemical methods. This study addressed the concern that calibration models for total-P and phytate-bound P based on NIR spectra may be compromised because the majority of the total-P is usually present in the organic molecule phytate and therefore there is a strong linear correlation between total-P and phytate-bound-P.
The samples analysed in this study were crosses between a parent with a normal phytate concentration and a parent carrying a gene or several genes for low phytate. These parents produced progeny with phytate-bound-P:total-P ratios in the range 35 to 85% as compared to the usual range of about 60 to 85% that was available for previous studies. In addition, the samples used for this study had a weak linear correlation between total-P and phytate-bound-P (Figure 2). This sample set was chosen to improve the ability to understand the influence of phytate-bound-P on the NIR spectra of wheat grains and to identify the spectral information utilized to model the total-P and phytate-bound-P.
Summary of assignments to absorbance peaks reported in Figures 4 and 5 of this study following Workman and Weyer. 14

a1D = First derivative, 2D = Second derivative, PCA = Principal Component Analysis.
bBased on wavelength assignments by Workman and Weyer 14 and allowing for shifts due to first derivative pre-treatments.
The R2c and RMSEC values for calibration models for total-P and phytate-bound-P presented in Table 3 are encouraging but the RMSEC:RMSECV ratios suggest over fitting of the models. However, when the models were used to predict total-P and phytate-bound-P in the set of validation samples they returned SEP values of less than 300 mg P kg−1 (Table 4). These are lower than SEP values reported previously (Table 1). The ratio of SEP to standard deviation (aka RPD 28 ) of the validation sample set was less than 2, as found for most of the NIR models reported for phosphorus in Table 1. According to Williams et al. 29 these models would be rated as ‘not recommended’ so care is needed if applying these models to screen grain samples or wheat-based feed samples for total-P and/or phytate-bound-P.
The loading weights for the calibration models of both total-P and phytate-bound-P were similar (Figure 7). This is strong evidence that both calibrations were based on the same information in the spectra. Supporting this conclusion, the cross-comparison between models for total-P and phytate-bound-P (Table 4) indicated that phytate plays a dominant role in both calibrations. The models for total-P and phytate-bound-P predicted total-P and phytate-bound-P, with SEP values of less than 300 mg P kg−1, but the total-P model was rated as unreliable for predicting phytate-bound-P (r2 = 0.12; SEP 400 mg P kg−1).
Both models are likely based on absorption by O-H and P-OH bonds with further influence from absorptions by C-H and N-H bonds. These bonds (other than N-H) may be present either as glucose-6-phosphate, as phytate molecules or as intermediary compounds. This is consistent with the action of the lpa genes that affect the conversion of glucose-6-phosphate to phytic acid and act as a modifier that perturbs or alters starch, protein or oil concentrations.12,27 The lpa genes possibly affect nitrogen metabolism via changes in free amino acids, proteins or other nitrogenous compounds. For the samples used in this study phytate-bound-P was reduced from 2400 mg P kg−1 to 1300 mg P kg−1, while the total-P remained unchanged at 3500 mg P kg−1 (Table 2). The samples with the lowest concentrations of phytate still carried ∼35% of the total-P in phytate. This proportion of P as phytate, along with its precursors, appears to be adequate to influence the spectra of whole wheat grain samples used to develop models for both total-P and phytate-bound-P.
The results from this study indicate that caution is warranted when NIR calibrations are used to analyse wheat and wheat products for both total-P and phytate-bound-P. In the near future, calibrations used to analyse phosphorus in wheat and wheat-based feeds should be updated to include samples with a low phytate-bound-P: total-P ratio.
Conclusions
This study examined the basis of calibration models using near infrared spectra from whole wheat grain samples that had a weak correlation between total-P and the major component phytate-bound-P. Difference spectra, PCA loadings and PLS loading weights indicated that NIR calibration models developed to determine total-P and phytate-bound-P both utilized wavenumbers in common and assigned predominantly to P-OH and OH bonds. This is evidence that phytate along with its precursor metabolites are utilized by NIR models to estimate total-P in grains and associated cereal based feed rations.
This inter-correlation may not be critical with current cereal grains that have a strong positive correlation between total-P and phytate-bound-P but as cereal cultivars with a low phytate and a traditional concentration of total-P, have been released for commercial cultivation analysts will need to update their calibration models using low phytate samples.
Near infrared spectroscopy can aid the identification of genotypes with a lower total-P and a lower phytate-bound-P:total-P ratio thereby making a contribution to better food security and to the formulation of more economical and more environmentally-friendly animal feedstuffs.
Footnotes
Acknowledgements
We thank Dr Rebecca Thistlewaite and Annette Tredrea for assistance in the field. Flinders Analytical analysed the macro and micro nutrients concentrations in all samples. Spectra were collected using a Bruker MPA spectrometer kindly loaned by Mr David Marston with guidance from Dr Koman Tan (both of Bruker Australia Pty Ltd). Discussions with Dr Brad Swarbrick led to improved models.
The authors dedicate this publication to the late Phil Williams whose PhD studies led to the publication – Ashton, W. M and Williams, P. C. The phosphorus compounds of oats. 1. The content of phytate phosphorus. J. Sci. Food Agric. 9 August, 1958.
Funding
The authors disclosed receipt of the following financial support for the research, authorship, and/or publication of this article: The study was partially funded by ARC Linkage Project LP150101242 “Developing Zn-dense, high-yielding wheat by molecular marker technology”.
Declaration of conflicting interests
The authors declared no potential conflicts of interest with respect to the research, authorship, and/or publication of this article.