
Abstract
Keywords
Introduction
Haemodynamic instability is usually associated with absolute or relative hypovolemia. Fluid resuscitation remains the key element in resuscitating such patients. Administration of fluid augments the venous return by improving mean systemic filling pressure (MSFP) and thereby improves the cardiac output (CO) and arterial pressure. Preload responsiveness is classically defined as an improvement in CO by ≥10%–15% within 15 minutes of administration of 6 ml/kg of crystalloids.[1,2] It requires both ventricles to function in the linear portion of the Frank-Starling curve.
Traditionally, preload responsiveness was assessed using static parameters including central venous pressure, pulmonary capillary wedge pressure and end diastolic volumes measured by echocardiography. With better understanding of the physiology, the assessment of preload responsiveness has evolved from static parameters to dynamic parameters.[3] Dynamic indices including the systolic pressure variation (SPV), stroke volume variation (SVV), pulse pressure variation (PPV) and pletho variability index (PVI) are based on the heart-lung interactions during the respiratory cycle that cause cyclic changes in the CO. The pre-requisites for using the dynamic indices for preload responsiveness include ventilation with tidal volume (TV) greater than 8 ml/kg, absence of spontaneous breathing, regular cardiac rhythm, heart rate to respiratory ratio of 3.6 and respiratory compliance of more than 30 ml/cm H2O. Mahjoub Y et al. demonstrated that only 2% of intensive care unit (ICU) patients met all the necessary validity criteria for using PPV as a marker of preload responsiveness.[4]
The concept of TV challenge was developed to improve the reliability of PPV in patients receiving low TV ventilation. TV challenge involves assessment of change in the PPV on increasing the TV of the patient transiently from 6 to 8 ml/kg. A change in the absolute value of PPV by >3.5% following TV challenge predicted preload responsiveness with good predictive ability (ROC: 0.99 [0.98–1.00]).[5] However, assessment of PPV with TV challenge is limited by the requirement of invasive arterial line and availability of monitors with modules for PPV measurement.
Point of care ultrasonography has emerged as a key component of haemodynamic assessment and is increasingly available in most of the critical care units.[6,7] Change in carotid peak velocity variation (CPV) measured with bedside ultrasonography was shown to reliably predict preload responsiveness compared to PPV in a recent study.[8] CPV negates the need for the invasive arterial line for immediate assessment of preload responsiveness.
We therefore sought to evaluate the reliability of the changes in the CPV (measured with bedside ultrasonography) following a TV challenge among critically ill patients to predict preload responsiveness.
Methods
This study is a prospective study done in a 24-bedded multi-disciplinary critical care unit from July 2017 to December 2018. As mentioned in the declaration, ethical commitee approval was not sought for this study.
Patients
All adult patients aged >18 years, with haemodynamic instability (defined as systolic blood pressure of less than 90 mm Hg, mean arterial pressure of less than 65 mm Hg and/or requiring vasopressors to maintain blood pressure), having invasive arterial line monitoring, deemed to receive a fluid bolus on controlled mode of ventilation with TV of 6 ml/kg predicted body weight were included in the study.
Patients with tachyarrhythmias, low lung compliance (<30 ml/cm H2O), carotid stenosis (systolic peak velocity >180 cm/s and/or diastolic velocity >30 cm/s by Doppler ultrasound), poor ECHO window and valvular heart diseases were excluded from the study.
Study Protocol [Figure 1]

The study was performed on 42 consecutive patients who met inclusion criteria, admitted to the ICU. All the patients were sedated as per ICU protocol and were on volume targeted control mode of ventilation with 6 ml/kg of TV. A single bolus dose of muscle relaxant was given to abolish spontaneous breathing activities while recording haemodynamic variables. Continuous arterial BP with PPV was measured using PHILIPS IntelliVue MP 20 (Germany). It has a built-in module for PPV measurement based on beat-to-beat analysis of the arterial waveform. CPV was measured using Sonosite, Fuji Edge System (USA), using a 5 MHz-10 MHz linear array transducer. After procuring a longitudinal view of the common carotid artery, pulsed Doppler analysis was performed at 2 cm from the bifurcation with angulation not more than 60° at the centre of the vessel. Maximum and minimum peak systolic velocities were obtained in a single respiratory cycle [Figure 2], and the CPV variation (CPV) was calculated with the following formula: (MaxCPV − MinCPV) / [(MaxCPV + MinCPV) / 2] × 100 expressed as percentage. CO was calculated from the left ventricular outflow tract (LVOT) as described by Mclean et al.[9] using 5 MHz-1 MHz transthoracic echo probe (Fuji Edge, Sonosite, WA, USA). The diameter of the LVOT was taken to be the distance between the bases of the aortic valve cusp during systole, as seen from the parasternal long axis view. The LVOT area was calculated assuming a circular geometry, which was calculated as the product of the radius squared:
LVOT area = 3.14 × [(LVOT diameter)/2]2
Pulsated wave Doppler samples were then obtained in the centre of the LVOT from the apical view, paying close attention to obtain an angle of Doppler signal to aortic blood flow close to 0°. The leading edge of five consecutive Doppler velocity curves was traced and the average velocity time integral (VTI) was calculated. The stroke volume (SV) was calculated as the product of the LVOT area and the VTI of the LVOT blood flow. The CO was then obtained as the product of the SV and the heart rate obtained during measurement of the aortic VTI. All transthoracic measurements were acquired in accordance with the European Association of Cardiovascular Imaging/American Society of Echocardiography task force’s recommendations.[10,11]
After abolishing spontaneous breathing efforts, the patient’s baseline haemodynamic variables including CPV variation, PPV and CO were measured at 6 ml/kg of TV (CPV6, PPV6 and CO-B), respectively. Then the TV was transiently increased to 8 ml/kg for one minute following which CPV variation and PPV and their corresponding changes were measured and designated as CPV8, PPV8 and ∆CPV (6–8) and ∆PPV (6–8), respectively. TV was then dropped back to 6 ml/kg and fluid bolus of 6 ml/kg of Ringer’s Lactate was infused. CO was measured and the change in CO was calculated (CO-FB and ∆CO) following fluid bolus. A change in CO greater than or equal to 15% was considered to be positive for preload responsiveness. Figure 2 represents CPV measurements at 6 and 8 ml/kg, respectively. Using 15% increase in CO following 6 ml/kg fluid bolus as the gold standard, the respective predictive abilities of ∆CPV (6–8) and ∆PPV (6–8) of fluid responsiveness were assessed and compared.
Carotid peak velocity at 6 and 8 ml/kg, respectively

Statistical Analysis
Demographic variables such as age and sex were presented as mean and percentage, respectively. Changes in continuous variables from 6 to 8 ml/kg IBW were compared using paired t-test or Wilcoxon signed rank sum test. Categorical variables were analysed using chi-square test. The ability of dynamic indices (PPV and CPV variation) in detecting preload responders and non-responders was compared by receiver operating curves. Area under the ROC curves of the indices was compared by the Delong method. The statistical analysis was performed using SPSS software version 17 for Windows (IBM, Armonk, NY). Sample size (
Results
Fifty patients were screened and eight patients were excluded (four patients had atrial fibrillation and four patients had poor ECHO window). Among the 42 patients included for study, 34 patients had septic shock and 8 patients had hypovolemic shock. Sixty percent of the study population was male and 40% were female. Mean age of study population is 44.05 ± 11.3 years. Distribution of study population based on diagnosis has been shown in Table 1.
Population diagnoses

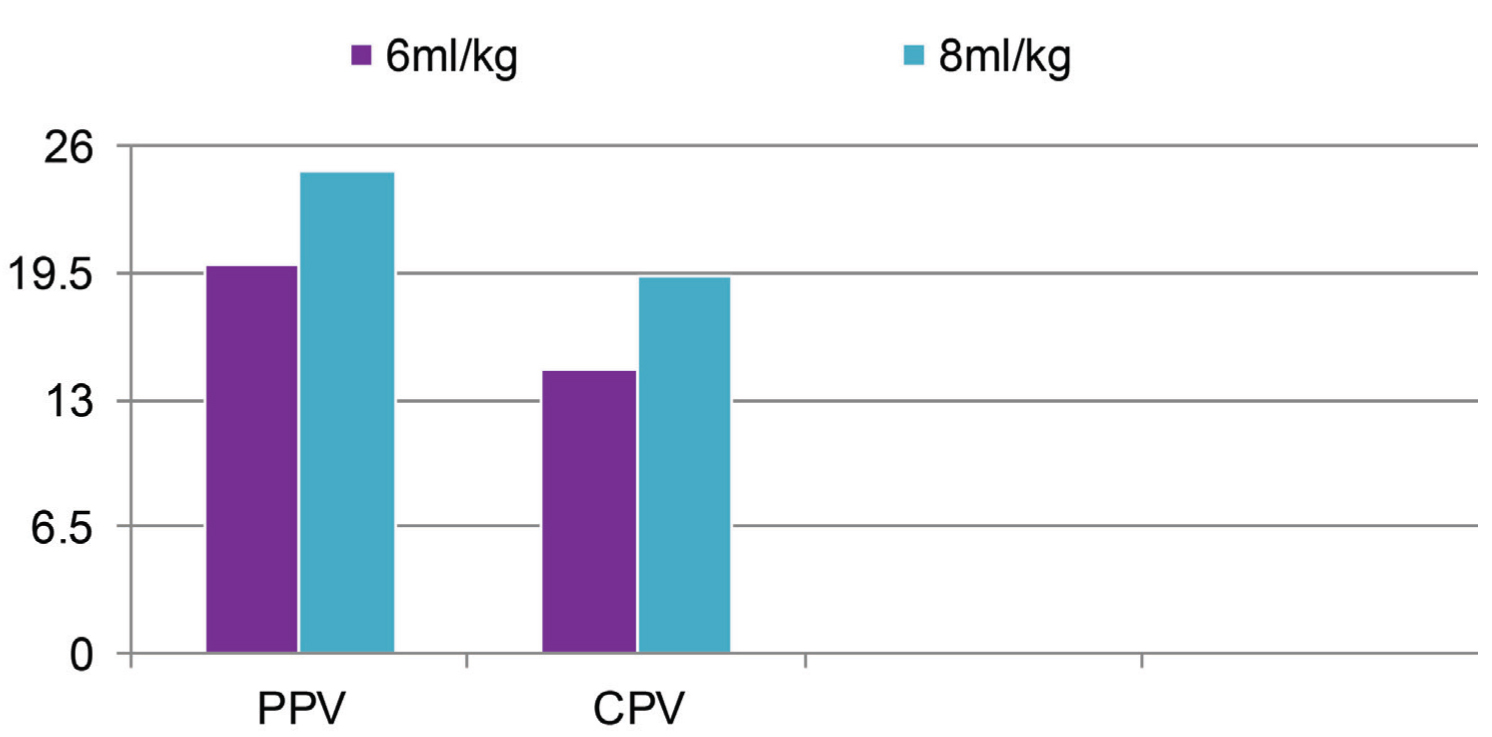
Total 42 pairs of measurements (PPV and CPV variation) were made before and after TV challenge, that is, CPV6: PPV6 and CPV8: PPV8. Mean values of the same were depicted in Table 2 and Figure 3.
Mean SD of PPV6, CPV6, PPV8, CPV8, ∆PPV (6-8) and ∆CPV (6-8)

PPV6, CPV6, PPV8 and CPV8 at 6 and 8 ml/kg, respectively
Thirty-seven of the forty-two patients responded to fluid bolus based on the CO criteria (∆CO ≥ 15% following fluid bolus). The ability of ∆PPV (6–8) and ∆CPV (6–8) to identify responders was compared by Receiver-operating characteristic curves (ROC) [Figure 4], which showed 0.96 (95% CI: 0.91–1.0) for ΔPPV and 0.84 (95% CI: 0.56–1.0) for ΔCPV, respectively.
ROC curve: comparing ∆PPV (6-8) and ∆CPV (6-8)

Best cut off values to predict preload responsiveness following TV challenge were 5.5% absolute change in PPV (sensitivity and specificity: 99% and 100%) and 4.5% absolute change in CPV (sensitivity and specificity: 99% and 100%).
Discussion
Point of care ultrasound (POCUS) has gradually become an indispensable monitoring tool in the ICU due to non-invasive, real-time, repeatability and is playing an important role in etiological screening, diagnosis, treatment and especially in haemodynamic monitoring.[12] Many authors have evaluated the use of carotid artery ultrasound for haemodynamic assessment with several studies looking at a variety of carotid measures like systolic flow time, carotid artery diameter, carotid artery peak velocity, and carotid blood flow (CBF) volume for haemodynamic monitoring.[13]
Our study differs from Ibarra-Estrada et al.[8] where the study was originally powered to predict preload responsiveness between CPV and central venous pressure (static indices) in septic shock patients. The authors demonstrated that the change in CPV (ΔCPV) was more accurate than conventional methods (central venous pressure, respiratory variation in inferior vena cava diameter, PPV) with ΔCPV having an area under the curve (AUC) of 0.88 (95% CI: 0.77–0.95); and superior to SVV (0.72, 95% CI: 0.63–0.88), passive leg raising (0.69, 95% CI: 0.56–0.80), and PPV (0.63, 95% CI: 0.49–0.75). Our study was done principally to evaluate the utility of CPV variation in predicting preload responsiveness with a TV challenge in comparison to PPV derived from an invasive arterial catheter. In our study, ΔCPV had a comparable AUC to that of ΔPPV (AUC of 0.84 [95% CI: 0.56–1.0] compared to an AUC of 0.96 [95% CI: 0.91–1.0], respectively). Although the study by Ibarra-Estrada et al. included only septic shock patients, our results are similar to theirs. Their study differed from ours in that the patients were ventilated with 6 ml/kg TVs. We have improved on their methodology by deploying a TV challenge to address the limiting effect of low TVs on heart-lung interactions.
Malini et al. demonstrated poor predictive ability of the carotid flow VTI with lower sensitivity, specificity and AUROC as compared to PPV and SVV.[14] Similar findings were noted by Ganesh et al. where the prediction of fluid responsiveness was poor with the change in Carotid Artery Flow VTI after a Passive leg raise test. Further, the correlation between the change in carotid flow VTI and LVOT VTI was weak and poor.[15] Our study differs in using change in CPV with TV Challenge rather than Carotid flow VTI as described in these studies.
Several studies have utilised arterial flow velocities from other sites as a marker of preload responsiveness. Feissel et al.[16] reported high accuracy, sensitivity (100%) and specificity (89%) of respiratory variation in aortic blood velocity (cut-off value higher than 12%) for prediction of preload responsiveness in septic patients receiving mechanical ventilation. Monnet et al.[17] showed the respiratory variation in aortic peak velocity (cut-off value higher than 13%) as a predictor of preload responsiveness with an AUROC of 0.82 and sensitivity and specificity of 80% and 72%, respectively. Both of these studies utilised an invasive method of transoesophageal echocardiography, and patients with an inadequate aortic blood flow signal were excluded, but our study involved CPV measurement, which is non-invasive and needs less expertise comparatively.
Mahjoub Y et al. demonstrated that only 2% of ICU patients met all the pre-requisite validity criteria for using PPV as a marker of preload responsiveness,[4] most important limitation being low TV ventilation and also need for continuous CO monitoring. To overcome this, many studies have evaluated TV challenge to improve reliability of dynamic indices in patients with low TV ventilation[18-20] but have not negated the need for invasive monitoring. We have combined two clinically relevant, easily available, non-invasive techniques (i.e., TV challenge and CPV variation) to circumvent the limitations of the previous studies. Considering that many studies have confirmed the concordance between CO estimated by transthoracic echocardiography (TTE) and thermodilution technique,[21-23] we used TTE VTI measurements to calculate CO monitoring while the aforementioned studies utilised invasive thermodilution techniques, which may not be available in resource-limited settings.
Our results agree with the study done by Myatra et al. where they have found that the absolute change in PPV and SVV after increasing TV from 6 to 8 ml/kg predicted fluid responsiveness with areas under the receiver operating characteristic curves (with 95% CIs) being 0.99 (0.98–1.00) and 0.97 (0.92–1.00), respectively.[5] The best cut off values of the absolute change in PPV and SVV after increasing TV from 6 to 8 ml/kg were 3.5% and 2.5%, respectively, and we have observed that ΔPPV and ΔCPV had an ROC of 0.96 (95% CI: 0.91–1.0) and 0.84 (95% CI: 0.56–1.0), respectively, with best cut off values to predict preload responsiveness following TV challenge of 5.5% for ∆PPV (sensitivity and specificity: 99% and 100%) and 4.5% for ∆CPV (sensitivity and specificity: 99% and 100%). The study by Myatra et al. included only septic shock patients and the volume of fluid bolus was not standardised, whereas our study included all patients with shock with a pre-determined standardised quantum of fluid bolus.
Strengths of the Study
The treatment protocol, including the mechanical ventilation strategy, sedation, analgesia and neuromuscular blocking agents, were standardised among the study population. The change in CPV variation was compared with validated tools of haemodynamic monitoring including PPV and CO. Results obtained in this study with respect to the preload responsiveness by change in the PPV to TV challenge were similar to the previous study. All the measurements were performed by a single trained observer to avoid inter-observer variability. The study was conducted in a mixed patient population including septic and non-septic patients admitted in a medical ICU.
Limitations
This study was conducted in a single tertiary care ICU. The sample size was based on previous studies rather than power calculation. Hence, further studies are required to establish an association between CPV and other dynamic indices to predict preload responsiveness following TV challenge. The CO was derived from the VTI with bedside echocardiography rather than the gold standard thermo dilution technique. CPV measurement, although simple and can be done easily with a steep learning curve, is prone to interobserver variability. The TV challenge cannot overcome the other limitations of heart lung interactions like spontaneous breathing, cardiac arrhythmias, open chest, raised intra-abdominal pressure, HR/RR less than or equal to 3.6, and right ventricular dysfunction. Similarly, CPV measurement may not be reliable in the presence of carotid stenosis and thrombus in the carotid artery.
Conclusion
In our single centre study, the change in the CPV following TV challenge (measured non-invasively by simple bedside ultrasonography) reliably predicted preload responsiveness in patients receiving low TV lung protective ventilation.
Footnotes
Declaration of conflicting interests
The authors declared no potential conflicts of interest with respect to the research, authorship and/or publication of this article.
Funding
The authors received no financial support for the research, authorship and/or publication of this article.
Institutional ethical committee approval number
As this was an observational study with no interventions, Institutional Ethical Committee approval was not sought.
Informed consent
Not applicable.
Credit author statement
Koteshwar Rao Madhisetti: Conceptualisation, methodology and writing of the original draft
Senthilkumar Rajagopalan: Investigation and resources
Ramakrishnan Nagarajan: Formal analysis, validation and supervision
Ramesh Venkataraman: Formal analysis and writing—review & editing
Vignesh Chandrasekaran: Methodology, data curation and writing—review & editing.
Data availability
Data available on request.
Use of artificial intelligence
None.