
Abstract
1. Introduction
The More Electric Aircraft aims to improve the efficiency of flight through the reduction of non-propulsive power consumption and aircraft mass. Power-by-wire concepts mainly seek to achieve the latter by replacing all or part of the significant hydraulic distribution network, which might account for 75% of the total actuation system mass (Maré, 2017), with a smaller, electrical network. Beyond the mass saving, an electrical network also provides opportunities for greater levels of system control. Landing gear actuation is used as a motivating example in this paper. Although minimising weight and volume are important considerations for landing gear, along with reduced life cycle cost, the primary concern remains one of safety. The simplicity of lowering landing gear passively in a controlled manner during emergencies, therefore, remains an important feature to be retained from existing hydraulic systems.
In addition to the main retraction-extension function, the landing gear actuation system typically includes door retraction, door up-lock and gear lock-stay actuators, all of which are relatively low power. An electro-hydraulic solution for the actuation system offers an attractive compromise. One potential architecture is local hydraulic power generation via an electric motor driven pump providing hydraulic power to all actuators in one landing gear bay. Conversely, a distributed electrical power system within the bay could offer the aforementioned control and efficiency benefits. This solution would also allow for the use of Electrohydrostatic actuators (EHA’s; Parker Hannafin Corp, 2021). An EHA integrates an electric servomotor, pump and hydraulic cylinder, but existing types only operate efficiently above 500 W. This is greater power than is required by the unlocking actuators and other accessory actuators found within the landing gear system.
Piezoelectric actuation offers a potential technological improvement that could provide a solution for these smaller power consumers and enable a fully distributed system (Vo et al., 2021). The application of an electrical field to a piezoelectric ceramic results in a strain being induced in the material. The magnitude of this strain depends on the specific piezoceramic strain coefficient and also the strength of the applied field. In practical applications the maximum strain is around 0.1%–0.15% (Choi and Han, 2016). Piezoelectric stacks consist of multiple layers of ceramic and electrodes and are commercially available with total lengths up to about 200 mm giving strokes of around
To overcome the stroke limitations of piezo stacks, various means of motion accumulation have been proposed. There are a number of commercially available mechanical accumulation methods including the PI walking drive (up to 125 mm stroke and 0.75 W output; Physik Instrumente LTD, 2022), Noliac Piezo Actuator Drive (up to 5 Nm torque and continuous rotation; Noliac, 2022) and other methods currently being researched (Tian et al., 2018). These methods generally have a maximum output power of less than 5 W, meaning they are not usable for many actuators on a More Electric Aircraft. In their review of Piezoelectric systems for More Electric Aircraft applications Vo et al. (2021) conclude that piezoelectric-hydraulic systems are the only realistic option when forces in the region of 1 kN or more are required.
The piezoelectric pump concept (commonly contracted to ‘piezopump’), uses hydraulic motion accumulation instead of mechanical and has been shown to be capable of delivering larger powers. There are a number of different designs for piezopumps but all have a similar operating principle. A piezoelectric stack is used to drive a piston (or diaphragm) and a pair of valves are used to control the flow into and out of the cylinder. By cycling the piston at high frequency the small displacement can still result in appreciable amounts of flow. Figure 1 shows the operating cycle of a piezopump.
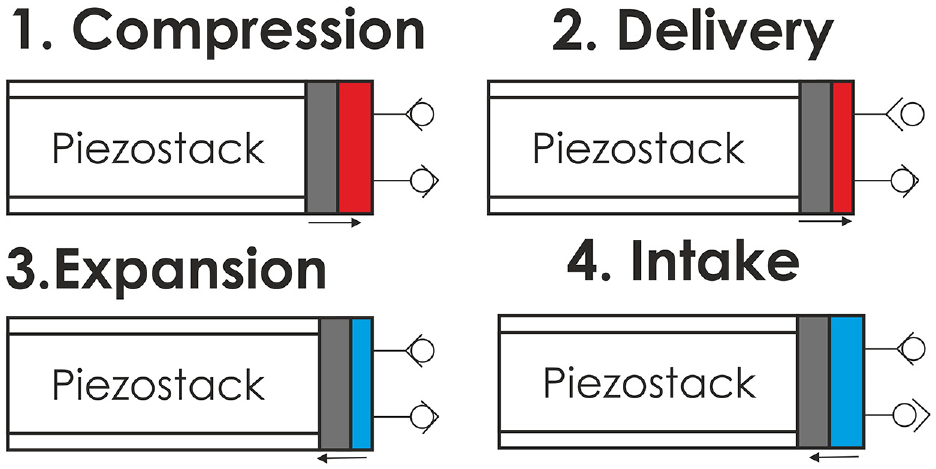
Operating principle of a piezopump.
The operating cycle is made up of four stages. The first of these is the compression stage during which the piezoelectic stack extends, compressing the fluid in the pumping chamber. When the pressure in the chamber is equal to that at the pump outlet the delivery stage begins – the outlet valve opens and any further extension of the piezostack is used to push fluid out of the pumping chamber, providing flow. Once the stack has reached the end of its stroke and begins retracting the expansion stage begins. As the stack retracts the pressure in the chamber drops towards the pressure at the inlet valve. When these pressures are equal the intake stage begins as the inlet valve opens, allowing fluid to flow into the pumping chamber. There is often an accumulator on the pump inlet to both help with volume changes in the closed hydraulic actuation system (e.g. due to heating) and to raise the net pressure of the circuit above atmospheric pressure in order to avoid cavitation at the inlet.
A conference paper from Mauck and Lynch (1999) is one of the earliest papers to report experimental results from a piezopump. It reports on two iterations of the same pump but with little information on the sizing or design of the two pumps. The second iteration, which reduced the amount of air trapped within the pump and included a change of valve, reported a maximum pressure greater than 1000 psi (68.9 bar) and flow rate of 0.045 L/min. Maximum pressure was found at 5 Hz and 1000 V and maximum flow at 15 Hz and 1000 V. The maximum recorded power output was 5 W at 7 Hz.
This operating frequency is significantly below what the piezostack can achieve and the limiting factor in this case was found to be the power electronics which could not drive the stack beyond 15 Hz at full voltage. Improvements were made to the electronics in a later paper (Mauck and Lynch, 2000) allowing the pump to operate up to 60 Hz, but there was a noticeable decrease in maximum pressure at high frequencies. There is no provided explanation for this but a further paper (Oates and Lynch, 2001) identifies the resistance of the purchased check valves and fluid compliance as the likely cause. This limitation of off-the-shelf valve performance is a theme of the research with a number of the different approaches taken to increasing bandwidth.
One stream of research looked to replace the simple passive valves with valves that could be actively controlled, often by smaller piezo elements. Using this approach Tan et al. (2004) was able to achieve a bandwidth of 140 Hz before other losses dominated the system. Lee et al. (2004) were able to operate up to 1 kHz using active valves but a maximum flow of only 0.2 L/min was achieved due to the pump’s sizing. There has been very little work on active valves recently as the increase in cost and complexity was not met with a corresponding increase in performance. Instead the focus has been on increasing the bandwidth of passive valves.
The most common way of doing this has been to move away from the ball type check valves, used by Mauck, to reed valves. Instead of having a spring element and sealing element, reed valves use a flexible material to perform both roles and, so, reduce the moving mass and, thus, increase bandwidth. There is no consensus on the optimal type or design of these valves with cantilever designs (Woo et al., 2019, 2020), sheet-spring type (Hwang et al., 2018), string designs (Ren et al., 2016), flapper designs (Hwang et al., 2018), finger types (Bao et al., 2019), cymbal designs (Huang et al., 2018) and umbrella designs (Peng et al., 2019) all being used. The variety of designs is indicative of the lack of proven technology in this field. None of these papers report a output power but based on the maximum flows and pressures they are all below the 20 W minimum target. They have however been successful in achieving frequencies of operation in the region of 1 kHz as is expected to be required for higher power levels.
In a number of these studies the authors concluded that the power electronics were a limiting factor on the pump’s performance suggesting that an integrated approach to the design of the pump and electronics is necessary. This paper proposes a ‘high power’ piezo pump which is defined to be one with a maximum power output above 20 W. Experimental pumps with an output exceeding 20 W are rare with (O’Neill and Burchfield, 2007) being the only known example with a stated power output of 165 W at 1358 V, many times greater than the numbers seen elsewhere. A pump capable of producing 20–100 W fills a gap in current electrohydrostatic actuator capability. The design of this pump is first detailed before the design is then simulated and empirically tested.
2. Design of high power piezo pump
The design power of the actuator is seen as more important than a specific flow rate or pressure as these will be dependent on specific manufactures designs of the accessory actuators and can be tuned by changing actuator areas if needed. Therefore while a target of 1 L/min of fluid at 60 bar (equal to 100 W) is used initially to help progress the design of the pump this is not based on one particular aircraft or actuator. In order to allow empirical testing an off-the-shelf ring stack was used, of which the largest available is the PI Ceramic PICA P025.50H. The key specifications of this actuator are given in Table 1.
PICA P025.50H ring stack parameters.

One of the important characteristics of a piezoactuator is that the blocking force can only be achieved at zero displacement, and maximum displacement can only be achieved at zero external force. Therefore, an operating point between the two must be selected the most common of which is half way between the two (Figure 2) as this provides the maximum power capability.

Operating envelope of the PICA P025.
Based on the stacks operating force of 4.8 kN the piston area required to produce 60 bar can be estimated:

where

where
One reason a ring stack was chosen is that it allows for the inlet valve to be located within the piston face which results in a smaller pumping chamber than would be required if both inlet and outlet valves are located in the chamber wall. It also allows the piston rod to pass through the middle and then be tensioned to the rear of the cylinder using Belville washers, as shown in Figure 3. Piezostacks require pre-loads of around 15 MPa for dynamic operation (Physik Instrumente LTD, 2022). Belville washers can provide this high pre-load force in a significantly more compact package than coil springs therefore also helping to lower the internal volume. It is also possible by careful design to simultaneously have a high pre-load and very low stiffness by utilising the non-linear behaviour of a Belville washers. Due to global supply problems however a stack of three off-the-shelf DIN 2093 D315163125 Belville washers were used to preload the stack. These have an outer diameter of 31.5 mm, inner diameter of 16.3 mm and thickness of 1.25 mm. To achieve the required preload on the piezostack a deformation of 0.55 mm is used. This results in a spring stiffness of 6.6 MN/m (around 5% of the stack stiffness) which acts to reduce the maximum force and displacement of the piston, and hence limits the maximum pressure and flow of the pump. A spacer is required in order to locate the springs on the piston shaft due to their large inner diameter which results in extra moving mass. In a similar manner the piston and cylinder were not hardened or lapped in this prototype but this would be desirable in a production model.

Cross-section of the piezostack and piston assembly.

Another advantage of a ring stack is that, for the same volume of piezo ceramic material, there is significantly more surface area for heat transfer compared to a stack without a centre hole. It is important to consider the cooling of the piezo stack as, at the Curie temperature, the piezo ceramic material de-poles and, in doing so, loses its ability to generate force (Liao et al., 2016). At temperatures below this there can still be performance degradation and the recommended maximum temperature for operation of the chosen stack is


where
As discussed in the Introduction, passive reed valves are a promising choice for rectifying the flow. A number of different types of reed valves have been trialed including MEMS valves, cantilever and arm valves (Larson and Dapino, 2012; Woo et al., 2019, 2020; Xuan et al., 2014). There is also a patent by O’Neill (2009) which appears to show the use of a disc reed valve as would be commonly used in hydraulic dampers or shock-absorbers. These are clamped at their centre and allow flow by deforming at upwards as pressure acts on the face of them.
It is this last type of valve which makes sense for this pump, as it is the simplest to mount on the face of the piston and can also be prototype manufactured easily using chemical etching. The challenge with utilising this style of valve arises from the lack of published modelling and design guidance. To overcome this, a simple model for the valves, based on standard poppet valve model, was developed and published (Sell et al., 2021). This model was used along with the stack properties and a chamber height of 1 mm to size the disc valves. The 1 mm chamber height was selected based on the work of Nguyen et al. (2018) which found overly small chamber heights increased the added mass and viscous damping forces on the reed valve. Little improvement in added mass and viscous damping was found beyond 0.5 mm but further increase would result in a lower fluid stiffness. The choice to increase to 1 mm was made to allow for the maximum possible displacement of the disc valve. This chamber can be seen between the piston and outlet valve plate in Figure 4, which also shows the full structure of the pump unit and its flow paths. It can be seen that the outside of the stack is surrounded by fluid along with the centre. This does not flow through the pump as the fluid in the centre does but as the piezostack extends and retracts radially it should be free to move to stop unnecessary resistance. This flow path is also shown in Figure 4.

Cross section of full pump.
The disc valves will be chemically etched from sheet HR302 stainless steel, this means the inner and outer diameters are only constrained by the mounting of the valves within the pump but the thickness should align with readily available sheet stock. Given the flow requirement for both inlet and outlet is identical it was determined to make the valves and their mountings identical. This gave a set of constraints for the optimisation of the reed valves based on the modelling in the next section.
3. Simulation of piezopump
The basic sizing equations do not allow for compressiblity or other losses and so a full system simulation was developed in line with the methods developed in Sell et al. (2021). The output of the pump is treated as a small volume (0.3 L), feeding a 10 mm diameter hydraulic line with a variable orifice at its end. The inlet to the pump is modelled as a constant pressure source feeding an orifice whose area is equal to flow path between the piston rod and piston clamp.
3.1. Piezostack modelling
Hysteresis in the piezo actuator was modelled using the standard Bouc-Wen equation (Wen, 1976) shown below:

and the tuneable parameters

Piston and piezostack force diagram.

and the Belville washer stiffness of 6.6 MN/m connected in parallel. The system is treated as critically damped when fluid and seal damping are taken into account giving a value of

where

where
3.2. Pump chamber modelling
Multiplying the displacement of the stack and piston assembly by the area of the piston gives a volume change in the pumping chamber. This is combined with the volume change due to flow through the inlet


Equation (10) described the pressure change required in the pumping chamber to accommodate the net change in oil volume entering the chamber, given the pump stiffness. The pump stiffness is a combination of the fluid stiffness


where
3.3. Reed valve modelling
There is no well-established parametised model of disc reed valves in incompressible flow. Therefore, the valve is treated as a single-degree of freedom lumped mass-spring, similar to a poppet. Figure 6 shows the diagram of the passive poppet type valve model from (Johnston, 1991) which the disc valve model is based on and Figure 7 shows one of the discs.

Check valve model (Johnston, 1991).

Drawing and photo of disc valves.
The valve opening area

where

where
It is assumed that the deformation of the disc results in a triangular cross section and so the effective mass of the valve is assumed to be a third of the valve’s mass, plus the mass of fluid displaced by the valve’s motion:

The dimensions of the valve were found using an optimisation process as explained in Sell et al. (2021). This resulted in an inner diameter of 6 mm, outer diameter of 16 mm and thickness of 0.2 mm for both the inlet and the outlet valve. The inner diameter is taken as the edge of the clamp rather than the hole in the centre of the valve through which the clamp mounts to piston or plate behind the valve. One of the shortcomings of the modelling approach given above is that it fails to capture the effect of ‘oil stiction’ (Leati et al., 2016). To mitigates its effect, a series of holes were located around the valve to allow some of the oil to pass through the valve while it is in motion. Once the valve is closed there is no flow path as these holes do not align with the those which provide flow to the back face of the valve. Figure 7 shows the cross section of a disc valve.
3.4. Loading system
Due to the high frequency operating point of the pump the output impedance is an important consideration. In order to simulate the pump’s output across a range of conditions a simple load system model consisting of a small hydraulic volume equal to the output chamber of the pump (0.01 L) was connected to a transmission line model as per Johnston et al. (2014a). The transmission line is included as the high operating frequency of the pump means that wave effects are expected to be important. The transmission line was assumed to be 3 m long with a diameter of 6 mm, an estimate of what will be seen in the test rig. The output of this transmission line is connected to a variable area orifice representing a loading valve. By varying the area of the orifice a range of pressures could be achieved. The inlet to the pump was assumed to be a constant 20 bar to both avoid cavitation at the inlet and maintain the stiffness of the fluid.
3.5. Simulation results
The model given by equations (6)–(18) was used to simulate the performance of the pump with a range of driving frequencies and loading system orifices. A summary of the key parameters for this simulation can be found in Table 2.
Summary of key simulation parameters.

Figure 8 shows the pressure, flow and power outputs from these tests with a range of driving frequencies:

Pump simulation results with varying load orifice restriction: (a) simulated pressure difference and flow output and (b) simulated power output.
There is a continuing increase in power up to 1500 Hz suggesting that the pump is capable of achieving higher power outputs at higher frequencies. The peak flow is 1.9 L/min in the no load condition. The maximum pressure difference is 104 bar and occurs in the no flow condition, as expected. The desired output of 60 bar at 1 L/min is at 1500 Hz significantly higher than 900 Hz predicted when compressibility was neglected. An output power of 100 W is produced at the lower frequency of 1200 Hz but it occurs at 48.5 bar and 1.2 L/min.
4. Experimental testing
In order to validate the model of the piezopump and quantify its performance, the prototype was built and tested. The test circuit is shown schematically in Figure 9 with components listed in Table 3, a photo of the test rig is given in Figure 10, the pump components are shown in Figure 11 and the assembled pump in Figure 12.

Schematic of the piezopump test rig.
Test rig components.


Photo of the piezopump test rig, annotated in line with Figure 9.

Pump components.

Assembled University of Bath piezopump, annotated in line with Figure 9.
Both the mean and instantaneous flow are measured to allow the high frequency behaviour of the pump to be investigated. The mean flow measurement was provided by a Max Machinery P214 Piston flow metre. This has a bandwidth of 100 Hz, significantly less than the intended operating frequency of the pump. In order to provide flow measurement at a higher frequency the three transducer method (Johnston et al., 2014b) was used with piezoeletric dynamic pressure sensors. These two measurements can be combined using a pair of complementary filters which cross over at 100 Hz where both measurements are accurate. The filters were designed using the method discussed in Plummer (2006).
The pressure and temperature in the pump chamber is measured using an EFE PCM127 sensor which combines a PT1000 temperature probe with a thin film pressure transducer. This is connected to the pumping chamber via a small drilling so that the volume of the chamber is not increased unduly. The pressure difference across the load valve is measured by using the Parker PTDVB250 sensors on either side of this valve.
Given the large voltage (1 kV peak-peak) and high frequencies (up to 1.4 kHz) required to test the pump it was necessary to develop a custom power electronic converter as a suitable off-the-shelf amplifier was unavailable. In part, this is because conventional piezo amplifiers of this type would generally have used Silicon IGBTs or MOSFETs. However, in most cases these would have relatively high on-state resistance and switching losses, and not be able to deliver the high voltage performance required in this application. To achieve the combination of reduced on-state resistance and lower switching losses, while still achieving a high modulation factor at the target frequency range, and be capable of providing the maximum voltage range of 1 kV, Silicon Carbide (SiC) MOSFETs were used in the design. The power electronics was split into two modules. The first, to boost the 540 V high voltage DC (HVDC) supply conventionally found on an aircraft up to the 1000 V required in this application (called the boost stage), and the second, to then modulate this voltage to create the waveforms to drive the piezopump (called the wave generator). These modules were then housed together inside a single enclosure (Figure 13).

Test rig power electronics.
A particular challenge for the design was the interoperability between the boost stage, the wave generator and the largely capacitive load with its very large reactive power component. The high frequency operation of the stack presented challenges in the increased load on the wave generator in order to supply the reactive power. To reduce the interactions between the boost stage and the wave generator, a 7 uH, 30 uF, link filter decoupled the two power electronic stages, with the boost stage providing mainly the real component at a significantly lower level (0.2 kW). The wave generator output filter was designed to utilise the stack capacitance to produce a combined LCR filter with a 5 kHz cutoff frequency, and the single stage LC filter on the boost stage input had a designed cutoff frequency of 2 kHz.
4.1. Experimental results
The pump was tested using the same method as the simulation model, with the loading orifice and hence pressure at the outlet of pump being controlled by a Moog D633-303B modulating valve. A range of pressure and flow combinations were measured at frequencies from 1000 to 1400 Hz with a driving voltage of 950 V. These are shown in Figure 14.

Measured pressure flow characteristic of piezo pump.
Both the maximum flow and pressure are lower than the simulated results. This is partly due to the drop in performance above 1250 Hz, whereas in simulation performance continued to improve. It is believed this is a limitation of the reed valves.
Another contributing factor is that the power electronics was only able to supply 950 V across the whole range of frequencies and loads resulting in lower power transfer to the piezostack. In the unloaded and high frequency cases the reactive power requirement was deemed too high to safely operate at 1000 V. The power electronic driver was designed for evaluation of the piezopump over a wide range of voltage and frequency. To ensure stable operation over such a broad window a robust power circuit was designed, this facilitated stable open loop control. A closed loop controller, optimised for a narrow voltage and frequency point, is expected to deliver improvement in performance from the power electronic driver and therefore the piezopump.
The significantly lower maximum pressure suggests that the pump stiffness is over-estimated in the model. One potential explanation for this could be the inclusion of a pressure sensor into the pumping chamber. This results in a small increase in volume which isn’t modelled but also the sensor face itself will not be infinitely stiff.
The comparison of mean performance between the modelled and measured results gives insight at a high level into possible source of inaccuracy but more information can be had by also looking at the wave forms for pressure and flow. These are shown in Figures 15 and 16 for 1250 Hz and a load pressure difference of 15 bar. In order to align the results the voltage wave form of the simulation was delayed to aligned with the measured one and the loading orifice area set to give the same mean pressure difference as in the measured results.

Instantaneous chamber pressure at 1250 Hz driving frequency and mean load pressure difference of 15 bar.

Instantaneous flow leaving chamber at 1250 Hz driving frequency and mean load pressure difference of 15 bar.
While some of the high frequency content seen in the modelled pressure is missing in the measured results there is otherwise good agreement. This discrepancy is believed to be down the frequency response of the pressure sensor.
Due to the three transducer method used to obtain high bandwidth flow measurements the flow rate shown in Figure 16 is not that leaving the pump but the flow passing the transducer which is about 0.5 m downstream. Therefore, the modelled flow leaving the pump was delayed 0.52 ms for plotting.
There is a more noticeable difference in the flow response of the measured and modelled results. The modelled response seem to have a much sharper response with the valve opening later but then passing significantly more flow. This difference may be in part due to the flow actually being measured downstream meaning some smoothing will have happened but the significantly larger back-flow suggests there maybe another fundamental difference. The model used to represent the disc valves was based on ball type check valves, these have a very small contact area between the valve and seat. However, as discussed in Leati et al. (2016) at high frequency there is a need to squeeze oil out of the seat in order for the valve to close and to fill the area under the opening valve with fluid as it opens. This gives rise to a force, sometimes called ‘oil stiction’, which can be of the same order of magnitude as the other forces acting on the valve. This could be responsible for the valve not closing or opening as quickly as simulation currently predicts. It would also serve to limit the maximum pressure as when the piezo stacks stroke reduces, due to higher chamber pressures, it would be unable to compress the fluid in the chamber sufficiently to open the valve and push fluid into the system. Future modelling of the reed valve will include this effect.
It is also possible that the characterisation of the load as a single volume, transmission line and orifice contributed to the error. As mentioned previously the load impedance effects performance and so more accurately recreating the experimental load with its multiple volumes and transmission lines may also resolve some of this discrepancy.
At this operating condition (1250 Hz with mean load pressure difference of 15 bar) there is clearly significantly more positive flow than negative with a positive peak of 4.3 L/min for a mean of 1.05 L/min. The maximum chamber pressure of 70 bar is significantly higher than the average outlet pressure of 35 bar (15 bar pressure increase plus 20 bar inlet) and this suggests a sizeable pressure drop across the reed valve. This is corroborated by the minimum pressure of 0 bar significantly lower than the inlet pressure and an indication that cavitation may occur even with 20 bar pressurisation. The already observed decrease in bandwidth and this increased resistance in the reed valves is the most likely explanation for the difference in performance between the simulation and experimental results.
The power delivered by the pump can be found by multiplying the differential pressure across the pump, by the measured flow. The mean output at a range of frequencies and output loads is shown in Figure 17.

Real output power of the piezo pump.
Orifice size cannot be given for direct comparison to the simulation results as this is not provided by the valve manufacturer, instead the measured load pressure is used as this is indicative of the orifice opening. However, it is clear that the power is lower than the simulated results as expected from the pressure and flow data.
The pump’s measured efficiency is below 20% in all operating conditions (electrical power to power at the load). The majority of the system losses occur within the piezostack, with resistance from the valves and compressibility losses being the other contributors. Given the unknown bandwidth of the disc valves it was not possible to specify an operating frequency and therefore optimise the load impedance to maximum power transfer from the piezo.
5. Conclusion
The aim of this study is to achieve a breakthrough in the output power of piezopumps, with a goal of surpassing 20 W. This goal was successfully achieved through experimental demonstration, where the pump was shown to have a maximum output power of over 30 W. This represents a significant step forward in the advancement of hydraulic actuation within the framework of More Electric Aircrafts.
The study also highlights two key innovations that have been demonstrated and hold great promise for future improvements.
The first key innovation is the adoption of passive reed valves, which were capable of operating at frequencies significantly higher than conventional ball-type check valves. The second is the development of custom power electronics, which allowed the pump to operate at near its voltage limit and beyond the bandwidth of the reed valves, while maintaining a compact and lightweight design.
The simulation results, although overestimating the pump’s output, provide a solid foundation for future improvement. The modelling of the valves and the output load impedance are areas that hold significant potential for optimisation. The addition of ‘oil stiction’ to the valve models and changes to the waveform or fluid volume on the output could further enhance the performance of the pump. The development of multi-cylinder pumps is also believed to play a crucial role in increasing the output power of the pump in the future.
In conclusion, this study represents a major milestone in the advancement of piezopumps and holds great promise for the future of hydraulic actuation.