
Abstract
Keywords
Introduction
An estimated 16.9 million previously uninsured Americans gained health insurance coverage as a result of the Affordable Care Act (ACA) between mid-2013 and early 2016, 6.5 million of which enrolled in Medicaid (Carman, Eibner, & Paddock, 2015). This health insurance expansion increased access to health care for the newly insured (Wherry & Miller, 2016) and may have simultaneously improved the finances of those directly, or even indirectly, affected. This is because one of the fundamental functions of insurance is to protect against unexpected and potentially costly events, or in this context decrease the risk of medical out-of-pocket spending. This risk, or changes therein, may even “spill over” to family members whose health and/or health insurance status does not change, but who share finances with those gaining coverage. However, the way in which medical out-of-pocket spending risk changes with health insurance largely depends on the type of coverage.
Medicaid is unique compared with other types of health insurance. With few exceptions, Medicaid beneficiaries pay no premiums for their coverage and pay no copayments or coinsurance for covered services. As a result, Medicaid decreases the risk of
Indeed, recent research from the Oregon Health Insurance Experiment suggests that some of the most immediate and measurable impacts of the ACA’s Medicaid expansions could be reduced risk of medical expenditures and medical debt accumulation (Finkelstein et al., 2012). Likewise, there is evidence that previous Medicaid expansions decreased the rate of personal bankruptcy (Gross & Notowidigdo, 2011). Furthermore, the Massachusetts insurance expansions, which targeted a broader population, have been shown to reduce several indicators of financial stress (Mazumder & Miller, 2016). And a very recent paper that studied the ACA Medicaid expansions found that the expansions significantly decreased the amount owed for
Using a novel data set from one of the three major credit bureaus, this work aims to study the effect of the ACA Medicaid expansions on personal finance. To test whether the expansions improved beneficiaries’ financial position, we study multiple outcomes directly related to medical out-of-pocket spending such as unpaid medical bills sent to third-party collectors as well as more general indicators such as credit scores. We estimate models that simultaneously compare these outcomes in two ways. First, we compare individuals in counties that expanded Medicaid under the ACA with similar individuals in counties that did not, before and after the expansions. Second, we compare individuals in Medicaid-expansion counties that had larger uninsured populations to counties with small uninsured populations. This work is important for policy makers considering additional state expansions, limited future expansions, or even possible roll back of existing expansions. It illuminates a broader range of costs and benefits related to the expansion—beyond health outcomes and access to health care.
Overall our findings suggest that the ACA Medicaid expansions provide meaningful financial protection to the low-income uninsured. Across all individuals age 18 to 64 in states that expanded Medicaid, results show that the expansions improved credit scores (0.1%), reduced balances past due as a percent of total debt (2.9%), reduced probability of a medical collection balance of $1,000 or more (1.3%), reduced probability of having one or more recent medical bills go to collections (3.3%), reduced the probability of experiencing a new derogatory balance of any type (1.4%), reduced probability of incurring a new derogatory balance equal to $1,000 or more (2.6%), and reduction in the probability of a new bankruptcy filing (2.8%). Given that those affected by the Medicaid expansions comprise a much smaller group than those ages 18 to 64, these estimates suggest much larger effects for those who newly enrolled in Medicaid as a result of the expansions.
Previous Research
The existing literature on the effect of health insurance on personal finance is much less developed than the corresponding literature on access to care and health outcomes. Nonetheless, as the burden of health care costs has grown, more attention has focused on the burden that those costs place on families’ income (e.g., Blumberg, Waidmann, Blavin, & Roth, 2014; Caswell, Waidmann, & Blumberg, 2012) and whether that burden may change with the ACA’s Medicaid expansion (e.g., Caswell, Waidmann, & Blumberg, 2014; Hill, 2015). The number of empirical papers that specifically study the causal effect of health insurance expansions on financial outcomes related to personal credit, debt, and bankruptcy, however, is much more limited.
Gross and Notowidigdo (2011) estimate the effect of previous Medicaid expansions (1992-2004), mostly covering children and parents, on personal bankruptcy filings. The authors use aggregated state-level data on personal bankruptcy filings provided by the Administrative Office of the U.S. Courts, combined with other sources, and estimated a simulated-instrumental-variables model commonly used to study previous Medicaid expansions (Currie & Gruber, 1996). In essence, this approach exploits within-state variation across eligible groups over time to identify the effect of expansions on bankruptcy filings. The authors find that a 10-percentage-point increase in Medicaid eligibility resulted in an 8% reduction in personal bankruptcies.
Finkelstein et al. (2012) use the Oregon Health Insurance Experiment to study the effect of access to Medicaid on medical debt and medical out-of-pocket expenditures, in addition to health care utilization and health. This was a random experiment where, through a lottery, uninsured adults in Oregon with family income up to 100% of the federal poverty level (FPL)—slightly below the ACA’s Medicaid income-eligibility threshold—randomly acquired the ability to enroll in Medicaid. About
More recent work by Mazumder and Miller (2016) studied the effect of the Massachusetts health insurance expansion that began in April 2006, which was the template for the ACA, on multiple financial outcomes related to personal credit and debt. In addition to bankruptcy filings, this work investigated the effect on the total balance among all credit accounts, debt past due on all accounts, debt past due as a percentage of total debt, and the amount of third-party collections. The authors used the Federal Reserve Bank of New York Consumer Credit Panel covering years 1999 to 2012. This is a unique and nonpublicly available data source, produced by the credit agency Equifax, of consumer-level data available to researchers employed with the U.S. Federal Reserve Bank system. Their identification strategy—used previously by Miller (2012) as well as the present article—uses variation in exposure to the reform immediately prior to implementation in order to identify the effect of the reform. Specifically, they use the prereform rate of uninsured among nonelderly adults across counties in Massachusetts as their measure of exposure. The authors estimate that, across all individuals age 18 to 64, the reform decreased the total amount of debt past due ($182; 22%) and the fraction of past-due debt to total debt (0.6 percentage points; 10%), decreased total collections balances ($12; 20%), improved creditworthiness as measured by risk scores (2.4 points; 0.5%), and reduced the likelihood of personal bankruptcy (0.2 percentage points; 19%).
Finally, a recent working paper by Hu et al. (2016) studied the effect of the ACA Medicaid expansions on financial well-being. These researchers use quarterly data from the Federal Reserve Bank of New York Consumer Credit Panel, covering calendar years 2010 through 2015, and implement a differences-in-differences analysis using a synthetic control group of states that did not expand Medicaid. Specifically, these authors study total debt, debt past due, credit card debt, number of nonmedical bills in collections, and balance on nonmedical collections. They estimate that the balance on nonmedical collections decreased by approximately $600 to $1,000 per newly enrolled Medicaid beneficiary as a result of the expansions.
New Contribution
The present article contributes the growing literature in several ways. First, it extends the work of Gross and Notowidigdo (2011) by studying a much broader expansion of Medicaid. That is, their study covered previous Medicaid expansions focused on low-income children and parents, whereas the ACA Medicaid expansions also cover low-income childless adults. It builds on the work by Finkelstein et al. (2012) and Mazumder and Miller (2016) as the ACA Medicaid expansions cover a much broader geographic area (28 states and DC), compared with two states (Oregon or Massachusetts). This article also focuses on the low-income Medicaid population, like Finkelstein et al. (2012), but unlike Mazumder and Miller (2016), which includes all nonelderly adults in Massachusetts.
Importantly, this work goes beyond the recent paper by Hu et al. (2016) insofar as it studies both nonmedical and medical collection balances, in turn, compared with only nonmedical collections, as well as the flow of new medical collections and derogatory debt. This is a significant contribution for several reasons. Most important, medical collections are directly related with medical out-of-pocket spending risk, which is the direct mechanism through which the expansions might influence consumers’ personal finances. While nonmedical collections may also be influenced by the expansions, the mechanism is seemingly less direct. Furthermore, studying the incidence of new medical collections more closely addresses whether medical spending risk changed as a results of the expansions, compared with total balances on medical collections that may take time to adjust. Finally, the addition of new derogatory balances, which include new medical collections in addition to other unpaid debt, sheds some light on the magnitude of any decreased flow of unpaid bills. In short, this work contributes to a growing body of literature that is important for policy makers to consider when debating the costs and benefits of expanding their Medicaid programs.
The Affordable Care Act Medicaid Expansions
Medicaid expansions were the intended mechanism through which most uninsured low-income Americans in all states were to obtain health insurance coverage via the ACA. Those with income up to 138% of the FPL would be income eligible, unlike “categorical” eligibility requirements such as being disabled or a single parent, in large part expanding eligibility of existing Medicaid programs to low-income childless adults. States also had the option to expand their programs as early as 2010, prior to the intended country-wide expansion on January 1, 2014 (summarized below).
1
The 2012 Supreme Court ruling
Table 1 summarizes the timing of the ACA Medicaid expansions as they relate with the timing of the data used in this analysis, discussed in more detail below, covering years 2010 through 2015. Connecticut, the District of Columbia, Minnesota, and 48 California counties expanded prior to 2014. 3 Twenty-one states expanded January 1, 2014; Michigan and New Hampshire expanded mid-2014; and Pennsylvania and Indiana expanded early 2015. Finally, Alaska and Montana both expanded after August 2015. 4
Timing of the Affordable Care Act Medicaid Expansions, 2010 to 2015.

CA counties (10): Alameda, Contra Costa, Kern, Los Angeles, Orange, San Diego, San Francisco, San Mateo, Santa Clara, Ventura. bCA counties (38): Riverside, San Bernardino, Santa Cruz, Alpine, Amador, Butte, Calaveras, Colusa, Del Norte, El Dorado, Glenn, Humboldt, Imperial, Inyo, Kings, Lake, Lassen, Madera, Marin, Mariposa, Mendocino, Modoc, Mono, Napa, Nevada, Plumas, San Benito, Shasta, Sierra, Siskiyou, Solano, Sonoma, Sutter, Tehama, Trinity, Tuolumne, Yolo, Yuba. cExpanded January 1, 2014: AZ,
The fraction of individuals who were uninsured, among those with incomes up to 138% of the FPL, decreased more rapidly in states that expanded their Medicaid programs. Figure 1 reports statistics from the American Community Survey on the population targeted for Medicaid eligibility. It excludes states that expanded Medicaid before and after January 1, 2014, in order to make clear comparisons. The left panel of Figure 1 reports the percentage point change in the fraction who was uninsured among the population age 18 to 64 with incomes up to 138% of the FPL in expansion and nonexpansion states. Between 2013 and 2015, this fraction decreased by 15.5 percentage points in expansion states compared with 9.6 percentage points in nonexpansion states. The right panel reports the percentage point change in the key measure of exposure to expansion we use in this analysis: the fraction of the population that was

Percentage point change in the rate of uninsured among the targeted Medicaid eligible population, 2015 to 2013 and 2014 to 2013.
Data
Credit Bureau Data
The unique and primary data of interest on financial outcomes is from one of the three major credit bureaus. 5 It is a nationally representative 2% sample of consumers from a universe of more than 250 million consumer records. This work uses six annual data archives covering years 2010 through 2015. Each archive represents the characteristics of consumers at the end of August for a given year. It is designed such that the same consumers appear in each year for which they have a record in the master file, while consumers newly entering the credit market enter in proportion to their representation relative to the consumer population for a given year. As a result, the sample is appropriate to use as a single-year cross-section, repeated cross-sections, as well as a longitudinal panel. The final subsample of consumers aged 18 to 64 in a given year consist of 23.5 million consumer-year observations, covering years 2010 through 2015, or approximately 3.9 million consumers per year.
Note that the population represented in data from the three nationwide credit reporting agencies differs from the civilian noninstitutionalized population typically analyzed using federal household surveys. In particular, to be included in these data, at a minimum it is necessary for an individual to interact with the formal credit market and/or have some public record information, for example, the former could include an application for credit (approved or disapproved), having an account with a utility company, or a visit to the hospital and subsequent nonpayment for medical services received, and the latter may include a civil judgement, tax lien, or bankruptcy. Recent research by the Consumer Financial Protection Bureau carefully documents how the population in credit bureau data differ with respect to the general population (Brevoort, Grimm, & Kambara, 2015; Consumer Financial Protection Bureau, 2014). In short, these authors report that approximately 11% of U.S. adults are not represented in the credit bureau data and that such individuals are more likely to reside in lower income areas, which is a limitation of this study. 6
Outcomes
Using the credit bureau data we study several outcomes that reflect various degrees of financial stress, and a direct relationship with medical spending risk, that may be influenced by the Medicaid expansions, which we categorize into “stocks” and “flows.” This distinction is important insofar as any effect of the Medicaid expansions may be more apparent on recent events (flows) compared with the cumulative summary of past events both recent and distant (stocks), especially during the early phase of the expansions.
In terms of stocks, we study Vantage credit score, which is a credit risk score with a range of 350 to 850 that has become an increasingly popular metric used to summarize consumers’ overall creditworthiness. A higher score represents a lower predicted risk of delinquency. Credit scores are categorized here as a stock as they incorporate past and current information from consumers’ credit history. We also study total balance on all credit accounts, which includes all accounts in good standing, as well as those that are not and could be on a consumer’s record for many years. In addition, we study balances past due (90 to 180 days), and past due balance as a percentage of total balances. Overall, these are very general financial outcomes insofar as they reflect many types of debt combined (e.g., mortgages, auto loans, third-party collections, etc.), which may be influenced by the Medicaid expansions.
In addition to the general outcomes above we study medical and nonmedical collections balances, in turn. This addition is important as medical collections are directly related to medical out-of-pocket spending risk—the direct mechanism through which we hypothesize Medicaid coverage may improve personal finances. Nonmedical collections may be influenced by the expansions insofar as there is an income effect of Medicaid coverage, whereby the previously uninsured have more disposable income as their out-of-pocket spending for medical care decreases with Medicaid coverage. Furthermore, note that medical collections are defined here as only those that originated with a medical provider. They do not include balances initially paid via credit obtained from a source other than the provider, such as a credit card. Such debt will be included in “nonmedical” collections.
We also study a number of flow outcomes that occurred within the previous 6 months with respect to the date a given data archive was culled. Importantly, we study incidence of new medical collections that occurred in the last 6 months, a flow outcome directly relevant to medical spending risk. Relatedly, we study new derogatory debt balances, excluding mortgages, which occurred in the last 6 months. Derogatory is a term used by credit agencies for debt that is not in good standing where the creditor took significant action to retrieve any unpaid balance and includes categories such as collections, repossessions, and bankruptcy. New medical collection balances are included in new derogatory balances; however, we are not able to identify them separately in our data. We are only able to identify new derogatory mortgage balances, which we exclude as we consider them much less directly relevant to the Medicaid expansions. Finally, we study bankruptcy filings that occurred within the past 6 months, which are severe and low-probability events. 7
Control Variables
In terms of more general information related to individuals, the credit bureau data include information on the age of each consumer as well as their zip code and county for each year. 8 It does not include other demographic information such as race and ethnicity or sex, nor does it include data on income, wealth, or health insurance status. Therefore, we rely on external information related to each consumer’s county of residence.
Key to the estimation strategy, discussed in the following section, are data on the relative size of the potentially affected Medicaid expansion population in the calendar year immediately prior to expansion. Specifically, we use estimates on the percent of each county’s population, aged 18 to 39 and 40 to 64, that was uninsured with family income up to 138% of the FPL—the income eligibility threshold in expansion states. These age categories were chosen because they are the most refined categories available. These data are produced by the Small Area Health Insurance Estimates (SAHIE) group at the U.S. Census Bureau. They are model-based estimates based on information from the American Community Survey, IRS federal tax returns, the 2010 decennial Census, population estimates from the Census Bureau’s Population Estimates Program, County Business Patterns data from the Business Register, and administrative data on participation in Medicaid, CHIP, and the Supplemental Nutrition Assistance Program (Bauder, Luery, & Szelepka, 2015; U.S. Census Bureau, 2016).
For each Medicaid expansion state we merge the SAHIE statistics with the consumer data by age-groups (18-39 and 40-64) and county for each year of the consumer data. The SAHIE estimates correspond to the calendar year prior to a given state’s Medicaid expansion, or county in the case of California. For nonexpansion states we merge the SAHIE statistics to consumers in the same way but use data corresponding to 2013, the year for most Medicaid expansion states.
We also incorporate data on the rate of unemployment from the Bureau of Labor Statistics, Local Area Unemployment Statistics program (Bureau of Labor Statistics, 2016b). County-level unemployment rates, corresponding to August of a given year, are merged with the consumer data by county and year.
Empirical Method
The empirical approach is similar to that used by Miller (2012) and Mazumder and Miller (2016), who studied the effects of the Massachusetts health insurance expansion. Like these authors’ work, we exploit two sources of variation to estimate the effect of the ACA Medicaid expansions on outcomes observed in the credit-bureau data. The first source of variation is that across individuals, similarly exposed to the Medicaid expansions, who resided in states that expanded their Medicaid program compared with those in states that did not. The second source of variation is, within states that expanded Medicaid and those that did not, variation in the pre-expansion rate of exposure across county age-category groups. Exposure is measured as the percent of the county population that is both uninsured and with income up to 138% FPL for each age category, 18 to 39 and 40 to 64. 9
Unlike the Massachusetts expansion, however, not all states or counties within states (i.e., California) expanded Medicaid via the ACA simultaneously. The timing of the expansions with respect to the timing of the six credit bureau data files (2010 to 2015) is summarized in Table 1. Each row includes states that expanded Medicaid during the same calendar year (e.g., the first row includes both CT and DC, which expanded in 2010). Effectively, three states and 48 California counties (of 58) expanded prior to January 1, 2014; 23 states and 10 California counties expanded on January 1, 2014; two states expanded mid-2014; and two states expanded in 2015.
10
Our preferred specification incorporates information from all 50 states and the District of Columbia from 2010 through 2015, where “event time” (indexed by subscript
This empirical approach assumes that, in the absence of Medicaid expansion, trends in outcomes among individuals in similarly exposed county-age categories would have evolved similarly across expansion and nonexpansion geographies. As these assumptions are not directly testable, we examine differences in outcomes in Medicaid geographies relative to nonexpansion geographies before and after the reform, taking into account higher or lower rates of exposure to the expansions. Should the outcomes studied not exhibit a trend before the reform, yet exhibit a different trend after implementation, we have more confidence that the expansions caused any changes in the outcomes.
To test for differences in the pre- and post-expansion period trends, we estimate models that take the following form, which we refer to the “event-study approach”:

where
Coefficient estimates from the three-way interaction terms,
Should trends in outcomes be similar prior to the expansions the corresponding three-way interaction coefficient estimates should equal zero (
To estimate the effects of the Medicaid expansions on a given outcome we estimate models that take the following form, which we refer to as the “triple-difference design”:

where
This model is similar in structure to that of Equation (1), where the three- and two-way interactions for all pre-expansion years are omitted. The estimate of interest is
Limitations
A limitation of this study is that the postimplementation period observed in the data is most likely too short to reflect full implementation of the Medicaid expansions. The channel through which we postulate the Medicaid expansions affect financial outcomes is via decreased risk of out-of-pocket medical expenditures and debt for those who are newly eligible and take up Medicaid. This chain of events and the full-implementation effects will not be immediate. And given the credit bureau data reflects a maximum of 1.5 years after expansion for most states, results presented here are best interpreted as early impacts of the Medicaid expansions.
A second limitation to this study regarding the proxy used for pre-expansion exposure is that we are unable to distinguish rates above the poverty threshold and up to 138% of the FPL. This may be important insofar as individuals in nonexpansion states with income in this range have access to marketplace health insurance and tax subsidies to purchase insurance.
A third potential limitation is that the estimates will be reduced form and will consequently incorporate additional dimensions of the reform related with Medicaid expansion and take-up of coverage. For example, the reduced-form estimate may include any potential effects resulting from the additional provisions of the law such as Medicaid take-up as a result of the individual mandate, or substitution from less comprehensive private insurance to Medicaid (i.e., crowd out). While it would be desirable to obtain structural estimates, it is beyond what our data and methods can produce. Nonetheless, we believe that the reduced-form estimates are informative to policy makers considering whether to expand their Medicaid programs as the expansion decision is within the context of the additional ACA provisions.
Results
Summary Statistics
Figure 2 demonstrates variation in estimates of the county-level rate of potential exposure to the Medicaid expansions by age category. All county-age categories are weighted equally. For each age-group exposure is defined as the percentage of the county population that was both uninsured and had family income up to 138% of the FPL in the calendar year prior to the expansions. 13 For nonexpansion states we report the rate corresponding to 2013. It is apparent that there is more variation in the rate of exposure among the 18 to 39 age-group compared with the 40 to 64 group, where the older population has less potential exposure to the expansions reflecting the fact that they are more likely to have higher income and less likely to be uninsured. The overall average pre-expansion rate of exposure for those 18 to 64 was 7.2% in expansion states and 10.2% in nonexpansion states.
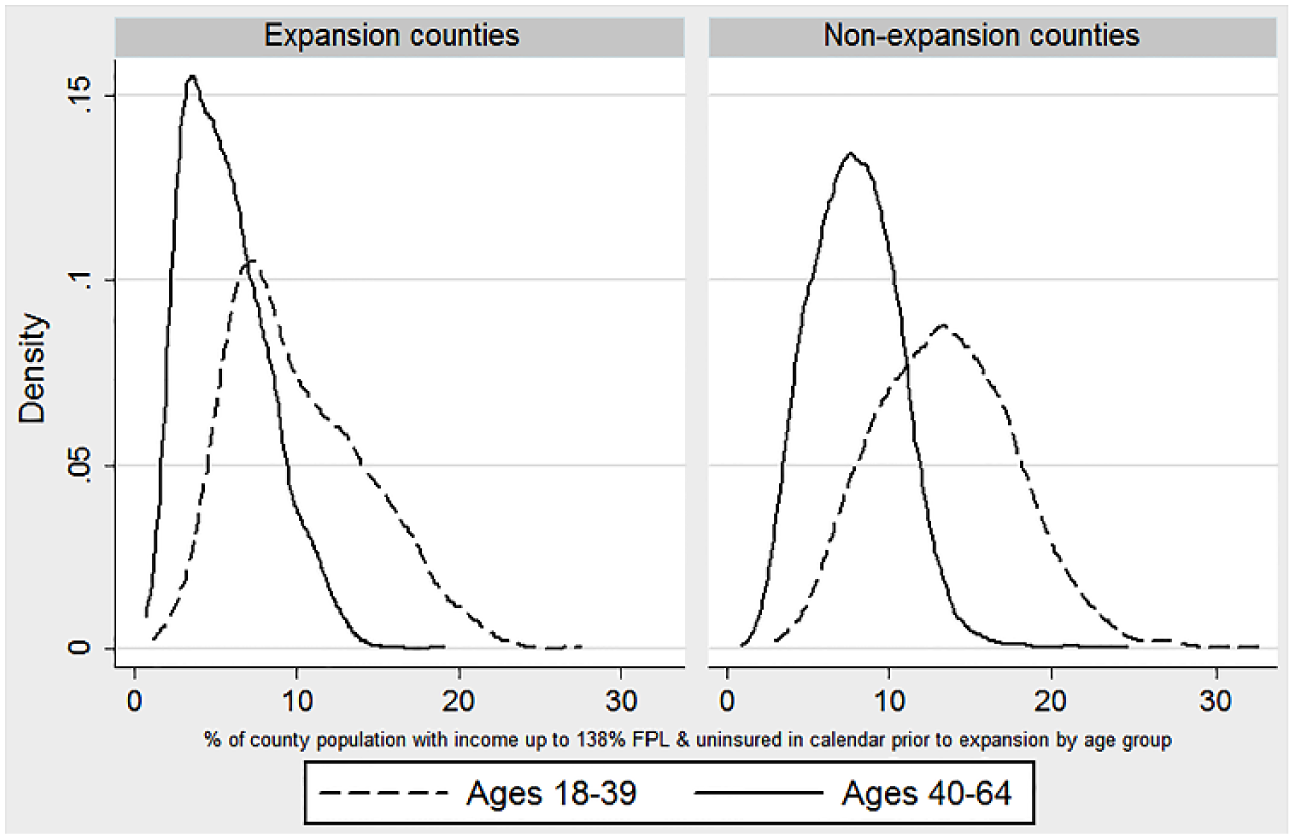
Distribution of county-level rate of exposure to Medicaid expansions by age-group and expansion status.
Table 2 reports summary statistics from the credit-bureau data for the period prior to the Medicaid expansions by age-group (18-64, 18-39, 40-64). Note that all outcomes measured in dollars are top coded at the 99.9th percentile throughout this analysis, by year, due to extreme and influential outliers (see the appendix for more details). Among the Medicaid expansion states, the pre-expansion period varies by county (see Table 1), whereas the pre-expansion period for nonexpansion states span 2010 through 2013. 14 For those aged 18 to 64 there are approximately 8.2 million individual-year observations in the pre-expansion period within expansion states, and 6.2 million individual-year observations for nonexpansion states. All monetary values are expressed in constant 2015 dollars (Bureau of Labor Statistics, 2016a).
Summary Statistics on Financial Outcomes by Age and Medicaid Expansion Status Prior to the Medicaid Expansions a .

The pre-expansion period varies by expansion state (or county for California) and equals 2010-2013 for nonexpansion states. See Table 1 for details on the timing of the expansions. b2010 data are unavailable for outcomes related to medical collections.
On average, compared with nonexpansion states, Table 2 shows that those age 18 to 64 in expansion states had slightly higher credit scores (665 and 651), held significantly higher total credit balances ($83,000 and $68,000) yet only slightly higher past due balances ($305 and $273). Table 2 also reports statistics on collection balances disaggregated by medical and nonmedical. Medical collections in this context are limited to unpaid balances providers (e.g., hospitals and individual medical practices) send to collections. Medical collections do not include balances initially paid via credit from a source other than the provider (e.g., credit card) ultimately sent to collections. This is an important distinction as some providers require (at least partial) payment at the time of service. Therefore, medical collection balances as defined here are a lower bound for all medical-related collection balances. Average medical and nonmedical collection balances are lower for those in Medicaid expansion states. For those 18 to 64 years old in expansion states the average medical collection balance was $414 per person, compared with $641 per person in nonexpansion states.
Given the importance of collections balances we also study whether consumers had any collections balance (greater than zero), or a “high” balance that we define as $1,000 or more. While the latter is somewhat arbitrary—in a given year, $1,000 is approximately the 91st percentile of the nonelderly adult medical collections distribution, and the 87th percentile of the nonmedical collections distribution—our main results are not sensitive to this definition. It is not uncommon that individuals had a collections balance at a given point in time. And adults age 18 to 64 in nonexpansion states were more likely to have a medical collection balance (25.9% compared with 18.4%), or a nonmedical collection balance (28.9% and 24.6%, respectively). Likewise, adults in nonexpansion states were more likely to have a medical collections balance of $1,000 or more (11.7% compared with 7.4%), or a high nonmedical collection balance (15.0% compared with 13.0%). 15
The bottom of Table 2 reports statistics on the flow of new financial events that may be the most likely outcomes influenced by the early phase of the Medicaid expansions. In expansion states 4.6% of consumers aged 18 to 64 had one or more medical collections trades within the previous 6 months, compared with 7.7% in nonexpansion states. Similarly, consumers in nonexpansion states were more likely to experience a new derogatory balance, which is a broader metric including medical collections as one component (18.2% compared with 13.8%). And those in nonexpansion states were more likely to experience a new “high” derogatory balance equal to $1,000 or more (7.9% compared with 6.0%). Finally, consumers in expansion states were slightly more likely to have filed for bankruptcy in the past 6 months compared with nonexpansion states (0.5% and 0.4%, respectively).
There are a few notable contrasts in these outcomes by age-group. Older individuals aged 40 to 64 had higher credit scores, higher total credit balances, and balances past due, yet lower past due balances as a fraction of total balances. Nonmedical collections balances were higher for younger individuals in expansion states, yet very similar across age-groups in nonexpansion states. However, average medical collection balances, the flow of medical collections and new derogatory balances, were higher for the younger age-group in both expansion and nonexpansion states, which may reflect higher rates of uninsured among younger individuals.
Event-Study Approach
Figure 3 presents results from the event-study approach for “stock” outcomes. It plots coefficient estimates, and 90% confidence intervals, corresponding to the triple-interaction terms from Equation (1) for a given outcome. Coefficient estimates measure the average change in a given outcome in expansion states relative to nonexpansion states, per percentage point in exposure relative to the year immediately prior to the expansions (marked with a gray dot at −1).

Event-study figures of financial outcomes and time until Medicaid expansion.
Using this methodology, outcomes consistent with a causal interpretation are those that do not exhibit a differential pre-expansion period trend and a break in the relative trend during the post-expansion period. Immediately clear from Figure 3 is that results for several outcomes are seemingly inconsistent with a causal interpretation. Indeed,
Figure 4 takes a closer look at medical and nonmedical collection balances. Specifically, it reports event study results for any balance greater than zero, and a balance of $1,000 or more for each type of collection balance. Results from

Event-study figures of medical and nonmedical collections and time until Medicaid expansion.
Figure 5 reports results for the flow outcomes. We cannot reject the null hypothesis from

Event-study figures of recent financial outcomes and time until Medicaid expansion.
While not all outcomes presented in Figures 3 through 5 are consistent with a causal interpretation due to differential preperiod trends, it is reassuring that some results relevant to collections, especially the flow of new medical collections, are generally consistent. Should the Medicaid expansions affect the financial outcomes of individuals, it is anticipated that the most direct and immediate means through which that process occurs is via decreased probability of unpaid medical bills and, as observed here, decreased flow of new medical collections. It is also known that the most common type of collections are medical collections (Consumer Financial Protection Bureau, 2014), thus lending credibility to the focus on collections. Also, while credit score incorporates historical information from consumers’ credit history, it should be, to some degree, responsive to recent changes in consumers’ creditworthiness.
That the remaining outcomes exhibit different trends in the pre-expansion period may reflect different experiences across expansion and nonexpansion states in the recovery to the great recession, unrelated to the ACA. For example, total balances include balances on mortgages or even derogatory unpaid balances related with foreclosures and bankruptcies that are maintained on consumers’ records for up to 7 to 10 years. In short, while the Medicaid expansions may have influenced these outcomes, and the post-expansion period trends are consistent with our hypothesis, the differences in the pre-expansion period trends suggest that any changes in these outcomes due to the Medicaid expansions are overshadowed by factors unrelated with the expansions. This suggests that changes in measures that exhibit differential preperiod trends, including total balance, balance past due, and balance on medical collections, are best not interpreted as a result of the expansions.
Main Results: Triple-Difference Design
Table 3 reports results from the triple-difference design. It includes results for all 14 outcomes; however, we focus the discussion on results identified in the event study figures as consistent with a causal interpretation (i.e., those with no differential preperiod trends). Results presented in bold are the main results and are coefficient estimates corresponding to the triple-interaction term in Equation (2). These estimates represent the average change in a given outcome per percentage point in the pre-expansion rate of exposure among all individuals age 18 to 64.
Regression Results of the Impact of the Medicaid Expansions on Financial Outcomes per Percentage Point Change in Exposure.

Table 3 shows that credit scores increased by 0.61 points per percentage point in the pre-expansion rate of exposure (column 1). And balance past due as a percent of total decreased by 0.01 percentage points per percentage point in the exposure rate (column 4). Subsequent results reported in columns 5 and 7 through 9 take the expected sign yet are statistically insignificant: namely, balance on nonmedical collections (−$9.40;
The remaining results presented in columns 10 through 14 are statistically significant at conventional levels and take the hypothesized sign. The probability of having a medical collections balance of $1,000 or more decreased by 0.10 percentage points per percentage point in the exposure rate (column 10); the probability of experiencing one or more new medical collections decreased by 0.15 percentage points (column 11); the probability of having any new derogatory balance decreased by 0.19 percentage points (column 12); the likelihood of experiencing a new derogatory balance greater than $1,000 increased by 0.16 percentage points (column 13); and the probability of a new bankruptcy filing decreased by 0.01 percentage points (column 14).
Finally, the remaining outcomes are those where the event-study results exhibit differential preperiod trends, where we have less confidence that the reported changes are (solely) a result of the expansions: total balance (column 2), balance past due (column 3), and balance on medical collections (column 6).
To interpret results from Table 3 in terms of the average effect of the Medicaid expansions per person age 18 to 64, we assume that a percentage point change in the pre-expansion period exposure rate corresponds to a commensurate change in the share of the low-income, uninsured population as a result of the expansions. The estimates based on ACS data presented in Figure 1 suggest that the decrease in the share of uninsured, low-income adults between 2013 and 2015 equals −1.0 percentage points (or 13.9%) in expansion states relative to nonexpansion states; that is, −3.4 percentage points in expansion states compared with −2.4 percentage points nonexpansion states. In Table 4, we interpret our coefficient estimates as corresponding to this one-percentage point change in the fraction of uninsured, low-income adults to arrive at the average effect of the Medicaid expansions per person age 18 to 64. Results presented here are limited to those that did not exhibit differential preperiod trends and are statistically significant as reported in Table 3.
Estimated Effects of the Medicaid Expansions on Financial Outcomes.

Results reported in Table 4 imply that, per person age 18 to 64: credit scores increased by 0.61 points (0.1%); debt past due as a percent of total decreased by 0.01 percentage points (2.9%); the probability of having a medical collections balance of $1,000 or more decreased by 0.10 percentage points (1.3%); the probability of having one or more medical bills sent to collections over a 6-month period decreased by 0.15 percentage points (3.3%); the probability of any new derogatory balance decreased by 0.19 percentage points (1.4%); the probability of a new derogatory balance greater than $1,000 decreased by 0.16 percentage points (2.6%); and the probability of a new bankruptcy filing decreased by 0.01 percentage points (2.8%).
Given that the reduced-form estimates above correspond to
It is important to keep in mind that the price Medicaid pays providers for services is likely much lower than the prices the uninsured are charged for the same services. Consequently, any decrease in the amount of medical collections or new derogatory debt balances due to the expansions is likely larger than what Medicaid would have paid and would not translate into a dollar-for-dollar shift from collections to Medicaid spending. That said, some portion of the related dollar amount contributes to the large estimated transfer of $0.6 per dollar of public spending on Medicaid to providers for implicit insurance for the low-income uninsured (Finkelstein, Hendren, & Lutttmer, 2015). These effects also reflect inefficiencies relative to providing insurance to the low-income uninsured when taking into consideration resources employed to (partially) recover unpaid bills.
Robustness of Results
In the appendix, we present and discuss results from multiple alternative model specifications to assess the robustness and validity of the main results. These models generally support the main findings discussed above and presented in Table 4, with a few caveats. To summarize, we find that results regarding new medical collections and derogatory debt (any balance and balance $1,000 or more) that occurred in the previous 6 months are the most unaffected by choice of model specification in terms of statistical significance and magnitude of results. This is an important finding as the flow of new medical collections, and derogatory balances more generally, should arguably be the first and most likely outcome studied here, if any, influenced by the expansions.
Results for recent bankruptcy filings and balance past due as a percent of total were less sensitive to different model specifications, although these were the only outcomes that that failed placebo tests estimated among adults age 65 and older. The latter finding suggests that factors other than the expansions may be responsible for the observed changes in these outcomes. Results for credit score and medical collection balances $1,000 or more were more sensitive to alternative specifications, which may reflect the fact that they change more slowly over time and the relatively short post-expansion period observed in the data. However, results that include state- or county-level time trends are generally consistent with those reported in Table 4.
Summary and Discussion
Using data from one of the major credit bureaus, combined with information on the likelihood of exposure to the ACA Medicaid expansions, we estimate triple-difference models to evaluate the early effects of the expansions on multiple dimensions of personal finance. Overall, results demonstrate financial improvements in states that expanded their Medicaid programs.
In summary, our estimates of the effect of the Medicaid expansions per individual age 18 to 64 include improved credit scores (0.1%), reduced balances past due as a percent of total debt (2.9%), reduced probability of a medical collection balance of $1,000 or more (1.3%), a 3.3% reduction in the probability of having one or more medical bills go to collections in the previous 6 months, a 1.4% reduction in the probability of experiencing a new derogatory balance of any type, a 2.6% reduction in the probability of incurring a new derogatory balance equal to $1,000 or more, and a 2.8% reduction in the probability of a new bankruptcy filing. Given that the proportion of individuals affected by the Medicaid expansions is much smaller than the population adults age 18 to 64, these estimates reflect much larger effects per newly enrolled Medicaid beneficiary.
These results are broadly consistent with recent work by Hu et al. (2016), using data on
These results are important for policy decisions. This work demonstrates how the ACA Medicaid expansions have improved economic well-being of low-income Americans, which at the same time has implications for providers and payers of medical services. From the consumer perspective our results show that increased access to Medicaid substantively decreases the risk of bills that go unpaid, which are at times nontrivial in magnitude especially for low-income families. Overall this suggests that the ACA Medicaid expansions provide meaningful financial protection to the low-income uninsured. From the provider perspective our results indirectly suggest that the Medicaid expansions have decreased reliance on third-party bill collectors, likely a very inefficient means of obtaining payment for services. Finally, from the payer prospective the results may suggest decreased need for funding of uncompensated care, such as disproportionate share hospital payments and upper payment limit supplemental payments, much of which is funded by Medicaid.