
Abstract

Introduction
Analysing gene expression provides valuable insights into cellular pathways, disease mechanisms, and potential therapeutic targets, thereby advancing precision medicine, biomarker discovery, and drug development.1,2 Over time, the techniques for detecting and quantifying gene expression have evolved from low-throughput methods to high-throughput approaches, such as next-generation sequencing, which can efficiently sequence hundreds or even thousands of genes or entire genomes.1,3,4 RNA-Seq is one of the most transformative methods in this field, allowing researchers to examine a cell or tissue’s transcriptome with exceptional detail and accuracy.4-7 A primary application of RNA-Seq data analysis is differential gene expression (DGE), which aims to identify genes whose expression levels differ significantly across samples. 8 For instance, by performing comparative analyses of gene expression levels in both healthy and diseased tissues, researchers can identify genes that are either upregulated or downregulated in pathological conditions. This insight is crucial for developing pharmacological interventions targeting these differentially expressed genes.8,9 The workflow for DGE analysis generally entails several steps, including data quality control, data filtering and trimming, read mapping, read counting, performing differential analysis and finally visualising and interpreting the results. 10 This analysis can be challenging, requiring careful planning, meticulous execution and advanced bioinformatics tools.7,11 In addition, integrating various tools throughout the process increases complexity. In computational biology, the R language, with its specialised Bioconductor packages, has become an essential resource for researchers engaged in such data processing. 12 R facilitates the management of large datasets, the execution of complex statistical analyses and, significantly, the clear visualisation and interpretation of results, all of which support informed decision-making in computational biology. 13 However, existing technologies often lack comprehensiveness and user-friendliness, necessitating expertise across different analytical procedures. To address this gap, this work aims to develop a comprehensive, user-friendly tool built in R using the Shiny framework. The SeqExpressionAnalyser tool provides an accessible solution for conducting interactive, thorough DGE analysis of RNA-Seq data.
Materials and Methods
The development of SeqExpressionAnalyser aims to provide a user-friendly solution for automated End-to-End DGE analysis of RNA-Seq data. This tool will streamline analysis by integrating widely used Bioconductor packages within a single web-based interface. It is implemented in R using the Shiny framework, which enables dynamic user interactions through reactive programming. The web application and all its features are activated by the
The overall workflow adopted by the tool is illustrated in Figure 1. The user interface is constructed using the
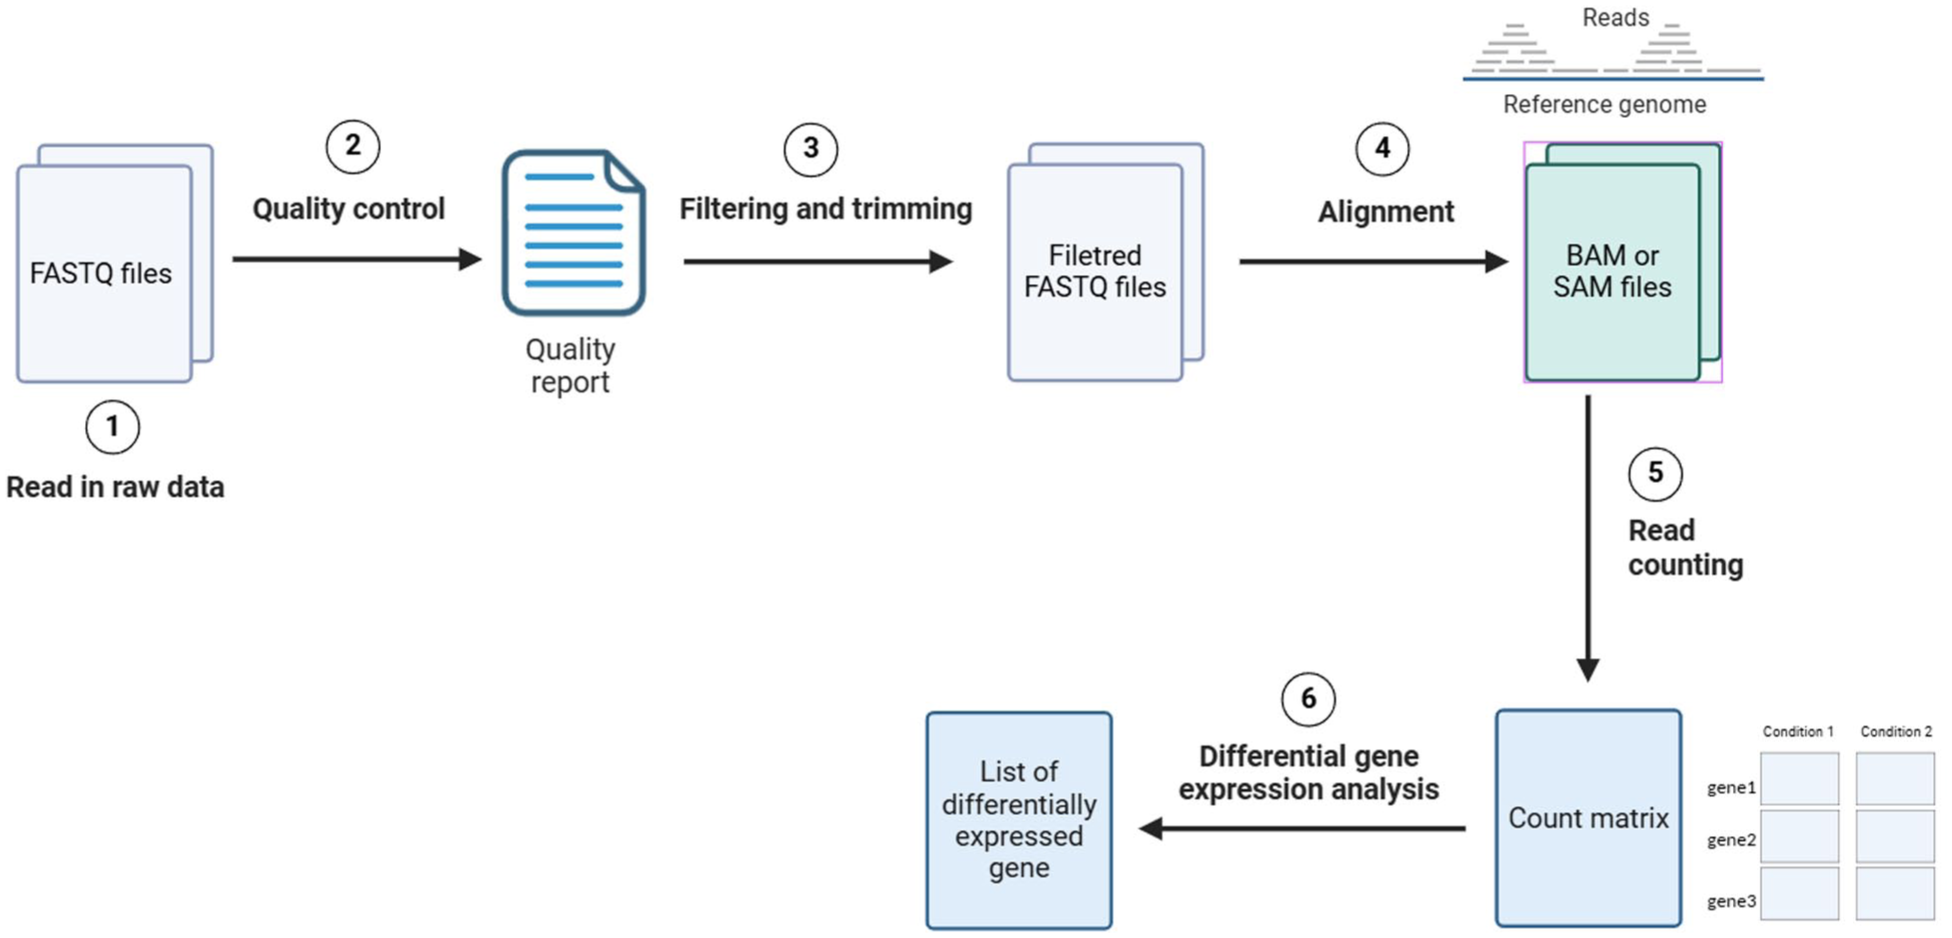
Overview of the SeqExpressionAnalyser workflow.
Our current pipeline provides partial support for long-read sequencing data through the integrated tools Rsubread and featureCounts, both of which support long-read alignments and read counting. Other components, including Rqc for quality control and QuasR for filtering and trimming, were initially developed to analyse short-read data. Furthermore, the SeqExpressionAnalyser software is compatible with any operating system that supports R, ensuring consistent results and making it a versatile and reliable tool for bioinformatics research. As the eqExpressionAnalyser is typically installed on local systems, its performance may vary based on hardware specifications. Based on our experience, a typical modern laptop or workstation with at least 8 to 16 GB of RAM is sufficient to run the tool on various datasets. The resource requirements are expected to scale approximately linearly with an increase in the number of samples.
Results
We developed the SeqExpressionAnalyser, a web-based software package for interactive DGE analysis of RNA-Seq data. To thoroughly evaluate the functionality of the SeqExpressionAnalyser, we conducted tests using data from a study that examined the impact of L-cysteine (Cys) on antimicrobial resistance (AR) in the bacterium
Data setup
The Data Setup tab in the SeqExpressionAnalyser tool is designed specifically for uploading RNA-Seq data. Users are required to provide a directory path containing only the relevant FASTQ files, in formats such as. fq, .fastq, .fq.gz, or .fastq.gz. In addition, it is essential to upload a study metadata file in CSV format. This file should include critical information on the study design and experimental details, including growth conditions (e.g., whether the bacteria were cultured in M9 medium with or without L-cysteine). The column names from the metadata will be displayed in a selection list, allowing users to select the appropriate grouping column to organise the uploaded data according to the study design. Users must also specify whether the uploaded data is paired-end or single-end, and indicate the number of parallel workers for sequence read processing. Once all parameters have been set, users can click the ‘

Data setup tab in the SeqExpressionAnalyser tool.
For demonstration purposes, we provide a dataset comparing gene expression in luminal and basal cells collected from the mammary glands of virgin mice, 18.5-day pregnant mice and 2-day lactating mice. This dataset is identified by accession number GSE60450 in the GEO data (https://www.ncbi.nlm.nih.gov/geo/query/acc.cgi?acc=GSE60450.2). 23 This feature aims to help users become familiar with the data processing pipeline and understand the required input formats.
Quality control
Upon completing the data setup, the user can assess the quality of the uploaded data using various quality-control plots to evaluate the reliability of the sequencing results (Figure 3). 14 The Average Quality plot evaluates overall data quality by displaying the proportion of reads that surpass the PHRED threshold. Typically, high-quality data should have most reads scoring above 30. Conversely, if a significant proportion of reads has a PHRED score below 20, this indicates poor quality. Cycle-specific plots, including the Cycle-specific Average Quality and Cycle-specific Quality Distribution, highlight variations in quality across different base positions. High-quality data tend to show stable scores, whereas sharp declines observed toward the end or at specific cycles indicate areas of poor sequencing quality that may require trimming. In addition, the Cycle-specific Base Call Proportion and GC Content plots assess the nucleotide composition (Figure 3). High-quality data generally displays balanced base calls, with a GC content that aligns with expected ranges. Significant biases or unusual distributions may suggest the presence of artefacts or contamination. The Per Read Mean Quality Distribution illustrates the consistency of the data. In high-quality datasets, most reads have mean scores above 30, whereas in poor-quality datasets, the frequency of low-scoring reads is higher. Finally, the Read Length Distribution helps identify potential sequencing issues by presenting consistent read lengths in high-quality data. A skewed or wide distribution of read lengths may indicate problems such as incomplete sequencing or improper trimming. Collectively, these plots provide a thorough assessment, enabling us to pinpoint poor-quality data that may require further processing or re-sequencing. 14

Quality control assessment tab in the SeqExpressionAnalyser (eg, Cycle-specific GC content plot). 14
Filtering and trimming
To ensure the integrity of data for downstream analyses, the SeqExpressionAnalyser employs the QuasR package from Bioconductor, allowing for customisable filtering and trimming of input RNA-Seq data. 15 The preprocessReads function allows users to remove low-quality reads and trim adapter sequences from both the 5′ and 3′ ends of each read. The tool offers options for truncating reads and filtering out those that contain an excessive number of ambiguous ‘N’ bases and those that are shorter than a specified length. In addition, low-complexity reads, identified by dinucleotide entropy, can be excluded to prevent keeping uninformative sequences. In paired-end experiments, if either read in a pair does not meet the filtering criteria, both reads will be discarded. This approach ensures consistent data quality throughout the process. Although adapter trimming is supported only for single-read experiments, these preprocessing steps ensure that only high-quality, informative reads are retained for alignment, thereby enhancing the accuracy and reliability of the analysis. The filtering process generates a summary statistics matrix that provides an overview of the preprocessing results. This matrix includes 1 column for each input sequence file (or pair of files) and displays metrics such as the total number of reads (totalSequences), the number of reads matching the 5′ or 3′ adapters (matchTo5pAdapter and matchTo3pAdapter), as well as counts for reads that were too short (tooShort), contained an excessive number of nonbase characters (tooManyN), or were classified as low complexity (lowComplexity). Finally, the matrix concludes with the total number of reads that successfully passed the filtering steps (totalPassed) (Figure 4).

Filtering and trimming reads using the SeqExpressionAnalyser tool.
Alignment to the reference genome
The SeqExpressionAnalyser uses the RsubRead package to align sequencing reads to a user-provided reference genome. 16 To perform this alignment, the user must provide key input parameters, including the input readfile1 (for single-end reads, this is the FASTQ file; for paired-end data, it refers to the forward file). If applicable, users should also specify readfile2 for mate reads. In addition, users must specify the desired output format for the aligned data, choosing between SAM and BAM, depending on how they intend to store the alignment results and the type of sequencing data being analysed. Once the alignment process is complete, the tool generates output files containing the aligned reads and saves them in the same directory as the input data. Along with these files, a results table is generated that summarises key mapping statistics for each sequencing library (Figure 5). This table presents essential information, including the total number of reads, the number of successfully mapped reads, the count of uniquely mapped reads, the number of multi-mapped reads, and the number of detected insertions and deletions (Figure 5). These metrics provide valuable insights into the quality of alignment and help evaluate the efficiency of the sequencing and mapping processes. A well-executed alignment typically yields a high percentage of uniquely mapped reads, ideally 70%-80% or higher. It should have a low proportion of multi-mapped reads, preferably under 10%, along with an acceptable number of insertions and deletions. In addition, the total number of mapped reads should be substantial, ideally constituting at least 80% of the total reads. A lower mapping rate may indicate quality issues in the sequencing data or in the reference genome. Reducing the occurrence of multi-mapped reads is essential to eliminate ambiguity and ensure accurate assignment of reads to their genomic locations.

Outputs of the mapping reads to the reference genome using SeqExpressionAnalyser.
Read counting
The SeqExpressionAnalyser utilises the featureCounts function from the Rsubread package to generate a count matrix from mapped RNA-Seq reads, a crucial step in quantifying DGE. 20 This process requires BAM (or SAM) files that store RNA-Seq reads aligned to a reference genome, as well as a GTF annotation file that provides detailed information about the genomic locations of genes, exons and transcripts. BAM files contain reads that represent fragments of RNA from the original biological samples, and their alignment to the reference genome indicates their origin. The GTF file serves as a guide, ensuring that each read is accurately assigned to a corresponding gene. During quantification, featureCounts assigns each mapped read to a specific gene based on its alignment position relative to the gene annotations. It then counts the number of reads assigned to each gene, yielding a count matrix in which rows represent genes, columns correspond to samples, and values indicate the number of reads per gene in each sample (Figure 6). This count matrix is essential for downstream analyses, particularly DGE analyses, in which statistical methods determine which genes are significantly upregulated or downregulated under different experimental conditions. The accuracy of this step is crucial, as errors in read assignment or gene annotation can directly impact the biological conclusions drawn from the data.
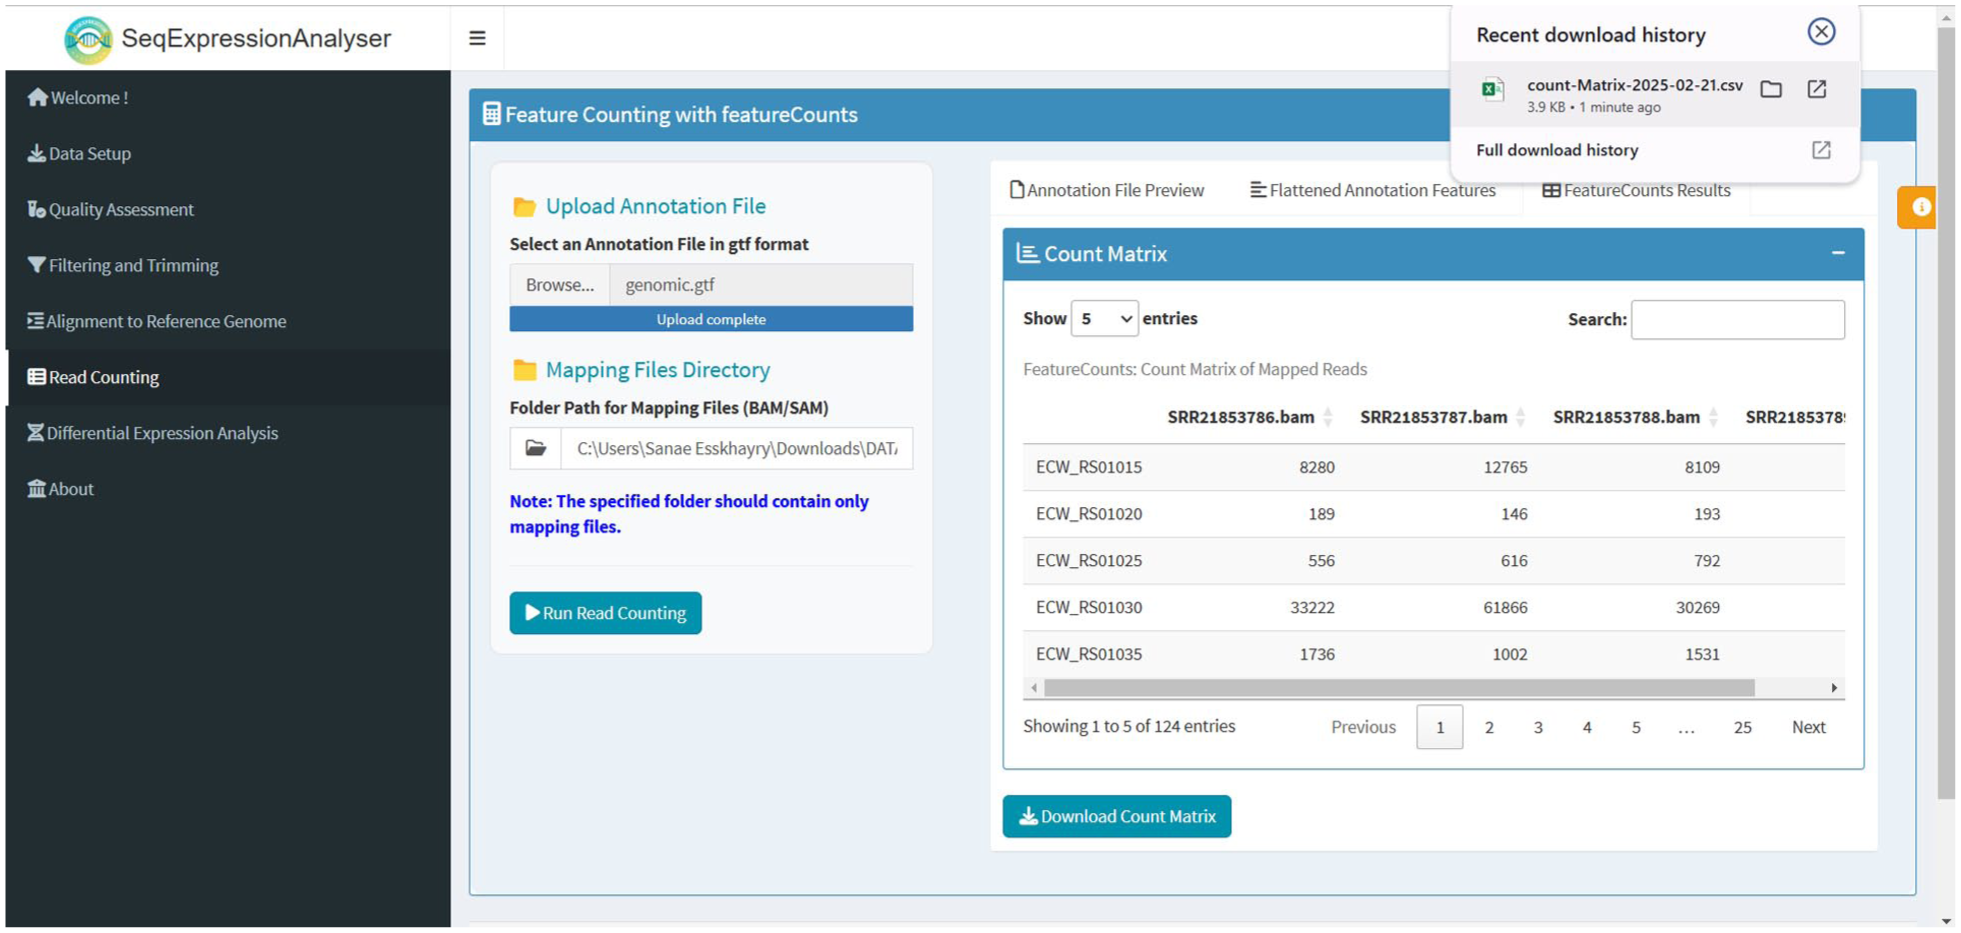
Feature counting results using SeqExpressionAnalyser.
DGE analysis
The SeqExpressionAnalyser uses DESeq2 to perform DGE analysis.
21
To carry out this analysis, users need to provide a count matrix, which should be generated during the quantification step, along with a metadata file. The metadata file must include a column that indicates the experimental conditions for each sample. The column names of the count matrix must exactly match the row names of the metadata and be in the same order to ensure proper mapping of sample information. This alignment is crucial because DESeq2 relies on the metadata to assign experimental conditions to each sample. Any discrepancies in names or order could lead to errors or inaccurate analyses. Ensuring this consistency is essential for preventing errors and enhancing the accuracy of the analysis. The process begins with DESeq2 normalising the raw counts by estimating size factors to account for variations in library depth. It then estimates gene-wise dispersion values to capture biological variability, fits a generalised linear model for each gene and conducts tests for differential expression. This final step involves calculating log2 fold changes, standard errors, Wald test statistics, raw

Differential gene expression analysis tab.
Discussion
The growing demand for an Automated End-to-End and interactive platform for RNA-Seq data analysis drove the development of the SeqExpressionAnalyser tool. Traditional tools and pipelines often require advanced computational skills, the integration of various tools and fragmented scripts, and familiarity with command-line interfaces. This can pose significant barriers for researchers without extensive training in bioinformatics. Our solution addresses this challenge by offering an intuitive web-based interface that seamlessly integrates all essential steps for DGE analysis of RNA-Seq datasets, from read processing to differential expression, while maintaining the robustness and transparency of established R packages. A variety of software options are available for analysing summarised expression data, each differing in features, implementation strategies (including R/Shiny, Python, and JavaScript), distribution formats (such as standalone applications, local web apps, and web services), and compatibility with existing workflows. However, none of these options fully integrates the DGE analysis workflow for R users. A comprehensive comparison of these tools is available in Supplementary File 2. A significant advantage of the application is its ability to automate and streamline a workflow that has traditionally been fragmented, often requiring multiple standalone tools, making it especially beneficial for R users. By incorporating quality control, sequence trimming, read alignment, read counting and differential expression analysis within a single framework, we significantly reduce both the time and complexity associated with conducting a thorough RNA-Seq study. This integration ensures analytical consistency across various steps, addressing a common issue found in multi-tool workflows. Furthermore, each component generates detailed reports and visual outputs, enhancing interpretability. Another notable advantage of our tool is its strong emphasis on data visualisation. 22 By integrating exploratory plots such as MA plots, volcano plots and heatmaps users can rapidly identify differentially expressed genes and discern underlying patterns in their datasets. These visualisation tools are crucial for both hypothesis generation and validation, particularly for researchers who may be less familiar with raw sequencing data outputs. In summary, SeqExpressionAnalyser addresses the computational challenges associated with bioinformatics analysis of DGE in RNA-Seq data. It provides a fully integrated, interactive workflow that streamlines the entire pipeline, making RNA-Seq data analysis more accessible and efficient. Reducing technical barriers enables researchers to focus on biological interpretation rather than on complex bioinformatics issues. As RNA-Seq technologies continue to advance, tools such as SeqExpressionAnalyser will play a crucial role in advancing genomic research and its clinical applications. The current version of the package emphasises preprocessing and DGE analysis. However, it lacks comprehensive downstream functional analyses, such as pathway enrichment, gene ontology (GO) analysis and gene set enrichment analysis (GSEA).24-27 The tool’s integration with widely used Bioconductor packages may not be sufficient for users handling highly customised RNA-Seq datasets, which could require additional modifications to adapt the analysis to their specific needs. Currently, the workflow supports only a single R-based method per core step, thereby limiting the range of analytical approaches available. While there is partial compatibility with long-read sequencing data through components like Rsubread 16 and featureCounts, 20 most modules are primarily designed for short-read applications.
To address these limitations, future enhancements will prioritise the integration of containerised versions of popular tools (e.g., STAR, 18 HiSAT2, 19 Salmon, 28 RSEM) 29 through Docker, creating a flexible and reproducible modular framework. This strategy will enable researchers to select the most appropriate methods for their experimental designs, rather than being confined to a single workflow paradigm. We also aim to enhance support for long-read sequencing by incorporating specialised tools in a modular way. In addition, integrating popular R/Bioconductor packages for functional analysis, such as clusterProfiler 30 and DOSE, 31 directly into the application will enable a smooth transition from DGE outcomes to pathway-level insights within a single interface. These improvements aim to expand the application’s capabilities while ensuring it remains user-friendly and accessible.
Conclusion
SeqExpressionAnalyser is a user-friendly web application designed to simplify RNA-Seq differential expression analysis, making it accessible to researchers of all levels of bioinformatics expertise. It integrates essential Bioconductor packages into a comprehensive, end-to-end workflow that addresses every step, from processing raw sequencing data to conducting differential expression analysis. The platform provides interactive diagnostic outputs that enhance data interpretability and facilitate troubleshooting at each stage of the analysis. Unlike command-line tools that require programming knowledge, SeqExpressionAnalyser minimises technical barriers, allowing life scientists and researchers to perform robust analyses with ease. Future enhancements will emphasise flexibility and the integration of advanced techniques, such as downstream functional analyses, alongside other external tools. By continually evolving, SeqExpressionAnalyser aims to be a comprehensive and intuitive tool for RNA-Seq data analysis, enabling researchers to derive meaningful biological insights from their studies.