
Abstract
Keywords
Introduction
The bridges which cross over natural or artificial obstacles are increasing with the rapid development of traffic. Usually, the designed life of bridges is from 50 to 100 years. During the service life of bridges, damage is inevitable, with deterioration caused by traffic loads, aging, etc. To avoid sudden collapses of bridges, which can result in a large number of casualties and property loss, periodic inspections and evaluations of bridges are required to ensure the safer use of bridges within their service life and to make informed maintenance decisions. Under this background, structural health monitoring (SHM) technology has been developed and applied to help engineers understand the performance of bridges and make informed decisions.1–3
The development of signal processing has promoted damage detection methods on SHM. 4 In terms of methods used for signal analysis and processing, the Fast Fourier transform (FFT) is the most traditional one. However, the signal can be represented in only a single domain by the FFT. The FFT is a global transform and it neglects the unique characteristics of a nonstationary signal. 5 Thus, some methods which employ the joint function of time and frequency have been presented to represent, analyze, and process nonstationary signals, for example, the short-time Fourier transform (STFT), 6 wavelet transform (WT),7,8 and Wigner-Ville distribution (WVD). 9
In 1998, Huang et al. proposed a completely new signal processing method, the Hillbert–Huang transform (HHT), whose key part is the empirical mode decomposition (EMD). 10 The EMD is suitable for analyzing nonstationary and nonlinear data. Compared with the STFT, WT, etc., the EMD is intuitive and adaptive since the basis function is derived from the data itself. Based on these advantages, works in SHM have been performed by the EMD technique in recent years.11–13 Chen et al. utilized the HHT for early detection in composite wing box structures, the research showed that accurate results were obtained in spite of the presence of noise. 14 Xu and Chen conducted experimental research on damage detection for a three-story shear wall model with an abrupt change in stiffness using the EMD. 15 Xianglei Liu et al. conducted an instantaneous vibration analysis of the Zhaozhou Bridge using an improved EMD method, which is called the extreme-point symmetric mode decomposition (ESMD). 16
In addition to the signal processing methods, the sensor technology for data acquisition is also a vital part of SHM technology. Currently, the point-strain sensor is mainly used for strain monitoring. While the point-strain sensor performs well in terms of the monitoring isotropic homogeneous material (steel), for anisotropic inhomogeneous materials, it tends to suffer from the effects of minute damage on the interface. Specifically, it is likely to obtain abnormal data with the point-strain sensor surrounded or covered by minute damage. Additionally, it is important to note that the damage occurs randomly, and the measurement of the point-strain sensor is too local for bridges (usually long-span) monitoring, unless the bridge is full of point-strain sensors. However, that scenario is unrealistic.
In light of the present problems, Wu proposed the concept of distributed long-gauge strain sensing and developed the related long-gauge strain sensor. 17 On this basis, Hong investigated the finite model updating and the damage detection method of a bridge’s macrostrain mode based on a distributed long-gauge strain sensor.18,19 Wu researched the damage detection method of a bridge under moving vehicular loads using a distributed long-gauge strain sensor. 20 Fouad et al. conducted early corrosion monitoring of steel reinforcements in concrete structures using long-gauge fiber Bragg grating (FBG) sensors packaged with carbon fiber and discussed the effects of the salt solution, electrical current, and temperature variation on the sensor measurements during corrosion. 21 Based on distributed long-gauge optical fiber sensors, Yongsheng Tang et al. proposed a self-sensing fiber-reinforced polymer (FRP) bar. Through static experiments of a concrete beam reinforced with the proposed self-sensing FRP bars, they found that the self-sensing FRP bar can not only be applied as an embedded sensor for SHM but also reinforce concrete structures. 22
FRP, with its advantages of high strength, light weight, and corrosion resistance, is mainly used for the reinforcement of civil engineering structures. The effects of existing cracks in concrete with different spacing and widths and the FRP’s location relative to the centerline of the specimen were discussed. Research regarding the degradation of the tensile properties of pre-stressed basalt fiber-reinforced polymer (BFRP) and hybrid FRP tendons in a marine environment was performed by Xin Wang et al. 23 The results show that the BFRP tendons have superior resistance to salt corrosion. Due to its lightweight, corrosion resistance, and a linear elastic modulus similar to concrete, BFRP is applied in long gauge sensors to protect FBG sensors against the harsh environment outside the bridge and to increase the lifetime of the sensors.
The quasi-static signals and dynamic signals are both very useful in terms of bridge SHM, but they are used for different purposes. Dynamic signals are mainly used to reflect fatigue failure and impact effects, while quasi-static signals are mainly used for load identification and damage identification.3,24 The quasi-static strain response of the bridge under ambient traffic loads is useful information for a condition assessment, which the SHM of the bridge usually depends on. For instance, the quasi-static strain allows for identifying moving vehicle loads on the bridge to avoid a sudden failure resulting from overloading, and the quasi-static deflection can be applied to evaluate the integral rigidity of the bridge. Moreover, noise can be removed from the data file in the process of extracting the quasi-static strain response. Hence, in terms of the scientific evaluation on the operating state of the bridge structure, researching the dynamic and static signal separation method for extracting the quasi-static response is of great importance. Although there are many studies on the SHM using the EMD, the signal analyses are focused on traditional short-gauge electrical sensors (no more than 10 cm). Our research focused on long-gauge FBG sensors (up to 1 m).25,26 Currently, the relevant research on long-gauge sensors mainly focus on structure damage identification. However, research analyzing the dynamic long-gauge strain of bridges using the EMD under vehicle loads is limited.
This paper investigates the method regarding the extraction of the quasi-static long-gauge strain of bridge. The presented method integrates the EMD with a long-gauge strain sensor. A dynamic load test on a practical bridge was conducted to verify the method. It is shown that the present method can effectively extract the quasi-static long-gauge strain of a bridge and is not affected by changes in vehicle speeds.
Dynamic and quasi-static long-gauge strain separation method for bridges
The bridge vibration resulting from moving vehicles contains multiple high-frequency components. The dynamic and quasi-static signal separation method is mainly based on the WT, neural network, EMD, etc. Considering the dynamic test characteristics of the long-gauge strain sensor and the obvious advantages of the EMD in nonlinear signal separation, the EMD is employed to extract the long-gauge quasi-static strain.
The basic principle of the EMD can be simply understood as follows: first, the oscillations in the dynamic signal (
When we can find a suitable method to perform the above decomposition for all the oscillations of the whole signal, the above process can be applied to all the residues of the local trend. Therefore, the components of the dynamic signal ( identify all the local extrema of the signal ( with the interpolation method, produce the lower envelope ( calculate the mean ( extract the component repeat the above procedures for residual signal (
In fact, the above procedures need to be redefined by a sifting process which determines whether the component
If the conditions are satisfied, the component 

Treating the residue 
In summary, the entire process is similar to a sifting process. This process also plays a role in smoothing uneven amplitudes. Here, the IMF 
In equation (4),
Sensitivity enhancement technology for FBG
The BFRP-packaged long-gauge FBG sensor
As shown in Figure 1, the interior of the long-gauge strain sensor is mainly composed of a sensing part and two fixed connections. With the concern of operating in a severe environment, the BFRP is adopted as the external material of the sensor. One of the main features of this sensor is the use of a hollow sleeve with a length of the gauge, which ensures uniform stress on the sensing component. Therefore, when the sensor has been installed on a structure, the average strain of the structure within the gauge length of the sensor can be measured.
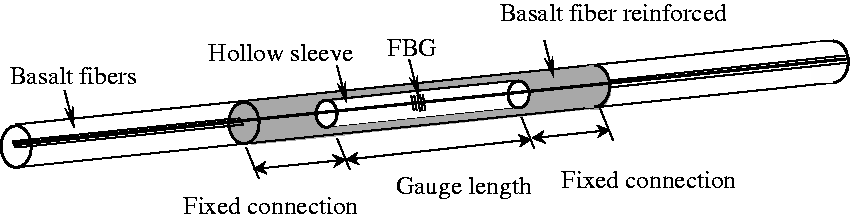
The schematic diagram of a long-gauge strain sensor.
The sensitivity enhancement technology
Due to the noise and uncertain factors in the field test, it is difficult to use the measurement results. Therefore, sensitivity enhancement technology for improving the precision of long-gauge FBG strain sensors has been proposed. The basic principle of sensitivity enhancement technology is employing large stiffness materials to package the fiber on both sides of the grating. The sensitivity enhancement technology makes the deformation in the gauge range concentrate within the grating range. Hence, the strain in the FBG component is much larger than other parts within the gauge. In extreme cases, the deformation is entirely borne by the FBG component. The average strain can be obtained by simply converting the measured strain. The detailed description regarding the principle is as follows:
As shown in Figure 2, it is assumed that the two ends of gauge are well bonded to the measured structure and there is no relative displacement.

The long-gauge FBG sensor enhanced sensitivity: (a) physical map and (b) schematic diagram.
The total displacement at the both ends of the gauge is

Each point in the sleeve is subjected to the same force, therefore

Therefore, the strain of the FBG component, 
The average strain, 
The simplified form of 
Then, 
Calibration experiment
A calibration experiment for the long-gauge FBG sensor was conducted on a calibration table shown in Figure 3(a). The experiment consists of two phases: first, the sensors are slowly pulled, and then the sensors are slowly released. The results in Figure 3(b) show that the strain coefficient of the sensor is 1.16 pm/µε. Namely the magnification factor

The calibration experiment: (a) the calibration table and (b) experimental results.
Field test on the Wanlongshan Bridge
The configuration of the Wanlongshan Bridge
The Wanlongshan Bridge is located in Pingxiang City, Jiangxi Province, as shown in Figure 4. The superstructure of the main bridge is composed of three spans of continuous prestressed concrete steel box girders (85 m + 150 m + 85 m). The box girders are single-cell box girders with straight webs, a roof 12 m wide, a zero block 9 m high, a middle 3.5 m high, a side span closure segment 3.5 m high, and a bottom slab with a 1.8 power parabola. The two bridge piers are reinforced concrete double limb variable cross-section rectangle solid piers, with heights of 42 m and 48 m. The bridge piers and box girder are consolidated. The single limb of the bridge piers has a longitudinal length of 2.0 m and a lateral length of 6.5 m. In addition, the pile caps are cuboids with a longitudinal length of 10.2 m, a lateral length of 11.2 m, and a height of 4 m.

Wanlongshan Bridge: (a) Wanlongshan Bridge and (b) long-gauge strain sensors layout.
Installing long-gauge FBG sensors
The layout of the long-gauge strain sensors is presented in Figure 4(b). The sensors are embedded in the middle of the bottom slab of the box girder. There were nine sensors (eight strain sensors and one temperature compensation sensor) numbered S1#1 to S1#9 from left to right on the left span. In Figure 4(b), the red sensor is the temperature compensation sensor and the black sensors are long-gauge strain sensors. As shown in Figure 5, the installation of the sensors includes three steps. First, the surface of the structure is cleaned with a grinder and alcohol. Then, location of sensors is determined and their ends are fixed with structural adhesive. Finally, after determining that all sensors can work properly, all parts of sensors are fixed with structural adhesive and tin foil is stuck on the surface of sensors to prevent moisture.

Installation of sensors: (a) Fixing ends; (b) Fixing an entire sensor and (c) Pasting tin foil.
Modal analysis and tests
As previously mentioned, the low order modal frequency is the key to extract the quasi-static long-gauge strain of the bridge under traffic loads. In this article, a numerical analysis model for the Wanlongshan Bridge was built using ANSYS to conduct the modal analysis. The information regarding the model is as follows: Element SOLID45 was applied to establish the model; the material of the box girders and the bridge piers is C60 concrete with an elastic modulus of E = 3.6e10 Pa and a density of 2600 kg/m3. According to the actual support condition of the bridge, the boundary conditions of continuous rigid frame bridges are relatively simple. Specifically, the ends of the box girder are simply supported, and the bridge piers are completely fixed. Moreover, the boundary conditions have little effect on the continuous rigid frame bridges, especially the first-order vertical bending mode.
The first order natural frequency resulting from the above modal analysis of the bridge is 1.225 Hz. In addition, a field modal test had also been implemented on the bridge, which indicates the first order natural frequency of 1.221 Hz. A comparison of the two results is shown in Figure 6. We found that the deviation between the actual and theoretical overall stiffness of the bridge is very small.

Comparison of the Wanlongshan Bridge modes obtained by two methods: (a) the result from the field test (1.221 Hz) and (b) the result of the modal analysis (1.225 Hz).
The long-gauge strain histories of the dynamic load test
Field loading tests have been conducted since the completion of the bridge, including a dynamic load test. In the dynamic load test, a dumper weighing 32 tons drives back and forth across the bridge at speeds of 10 km/h, 20 km/h, and 30 km/h respectively. The dynamic load test was divided into two stages in sequence, the driving forth and the driving back. Figure 7 gives a schematic view of the test. From Figure 7(a) and (b), we can see the dumper drives on right side of the road in both stages.

The dynamic load test: (a) driving forth and (b) driving back at the speed of 30 km/h.
In the dynamic load test, the temperature variation monitored by the temperature compensation sensor is very small, Figure 8 shows the temperature variation and the influence of temperature are ignored in this paper. The long-gauge strain-time history curve of S1#3 at the speed of 20 km/h is given in Figure 9. The first peak is the macrostrain resulting from the dumper passing through the location closest to the sensor S1#3 in the first stage. Similarly, the second peak is generated at the second stage by the same way. Both of the peaks are 3.7 µε.

The temperature variation in the dynamic test.

The strain-time curve of the long-gauge sensor S1#3.
Extracting the quasi-static macro-strain
Extracting the quasi-static macro-strain under the moving vehicle loads
Dynamic and quasi-static strain separation is now performed according to the proposed method. For convenience, the macrostrain histories in Figure 9 are taken as an example, and the decomposition results are depicted in Figure 10. The macrostrain is decomposed into nine IMF components as shown in Figure 10(a1) to (i1). Figure 10(a2) to (i2) shows the Fourier spectra corresponding to the IMF components. The detailed decomposition process is as follows. First, the macrostrain is treated as the signal

Decomposition of the long-gauge dynamic strain measured by S1#3 and corresponding the FFTs at the speed of 20 km/h: (a1–i1) the IMF components obtained by the EMD method and numbered in order of appearance as IMF1-IMF9; and (a2–i2) the FFTs corresponding to the IMF components in (a1–i1), IMF1FFT-IMF9FFT.
The first order frequency of the bridge (1.225 Hz) is marked with a red dashed line in the Fourier spectra. Each IMF is ranked according to the extraction order, and it can be seen that their frequency is from high to low. Based on the amplitude of each IMF component, we find that the high-frequency components have high fluctuation frequencies but small contributions to the measured responses in the strain records; conversely, the fluctuation frequencies of low-frequency components close to static are lower but they have large contributions.
Based on vibration theory of bridges, the bridge dynamic response is dominated by low-order vibrations under moving loads. Therefore, as shown in equation (4), the presented method takes the first order frequency of the bridge as the threshold to implement dynamic and quasi-static signal separation. The separation results shown in Figure 11 demonstrate that the dynamic and quasi-static strain responses have been separated. Figure 11 shows that the quasi-static strain amplitude is 3.2 µε, which accounts for 87% of the total strain. The separation results of other sensors under different speeds can be obtained in the same way. Figures 12 and 13 provide the separation results of S1#2 and S1#4 at the speed of 20 km/h.

The dynamic and quasi-static strain responses of S1#3 at the speed of 20 km/h.

The dynamic and quasi-static strain responses of S1#2 at the speed of 20 km/h.

The dynamic and quasi-static strain responses of S1#4 at the speed of 20 km/h.
Effects of the speed of a moving vehicle on extracting quasi-static macro-strain
In fact, the speeds of vehicles on bridges are unknown and varied; therefore, effects of the speed of a moving vehicle on the presented separation method are investigated. Based on the proposed method, the quasi-static long-gauge strains under different vehicle speeds are extracted, analyzed, and compared. The long-gauge strain response was collected in the dynamic load tests. Here, the data collected by the sensor S3 are still taking as an example. The quasi-static strains and dynamic strains at different speeds are given in Figures 14 and 15, respectively. Figure 14 suggests that the quasi-static strains at different speeds are almost the same, approximately 3.2 µε. In the case of the speed of 30 km/h, the second peak of the strain-time curve is much smaller than the first peak, which is about 2.7 µε, because there is a certain deviation between the path of driving back and driving forth.

The quasi-static strains at different speeds.

The dynamic strains at different speeds.
In general, the quasi-static strains for different speeds during the first and second stages of the tests are essentially the same. However, in the dynamic load test, the quasi-static strains have a slight deviation between the two stages, which is because the distance from the sensor is different when the dumper is driving back and forth. In summary, the test results reveal that the speeds of vehicles do not impair the dynamic and quasi-static macrostrain separation. Thus, the proposed method can stably extract quasi-static macrostrains from dynamic macrostrains of bridges under moving vehicle loads.
Conclusions
Based on dynamic monitoring data collected by the distributed long-gauge strain monitoring system of the Wanlongshan Bridge, the dynamic and quasi-static strain separation method for the long-gauge strain of a long-span rigid frame bridge under moving vehicle loads was studied. With the aid of related parameter studies, the following conclusions can be drawn:
The natural frequency of a long-span rigid frame bridge is small, and the bridge is dominated by low-frequency vibration under moving vehicle loads. Thus, by setting the first order frequency of the bridge as the separation threshold, the useful quasi-static strain components can effectively be extracted from dynamic strain signals based on the proposed method. Under moving vehicle loads, in terms of the macro-strains of bridges, the low-frequency components have a larger contribution than high-frequency components. The speed has a relatively small effect on the proposed method, and it can essentially be ignored. This indicates that the suggested method has a good stability on separating the dynamic and quasi-static strains of the long-gauge for the bridge subjected to moving vehicle loads.