
Abstract
Keywords
Introduction
Designers in the built-environment disciplines increasingly solve problems using generative design methods. Generative design (GD) refers to computationally creating design forms (e.g., building envelopes or spatial compositions) informed by advanced performance analysis (e.g., daylight simulations, sustainability analysis, cost estimation) to explore alternative solutions to a design problem. GD can amplify designers’ exploration and help find designs that
Any complex design problem has multiple conflicting quantitative and qualitative objectives, which requires designers to evaluate their trade-offs. In a typical generative design workflow, the design alternatives are sifted through to find the ones that meet the quantitative and qualitative design criteria,8,9 such as aesthetics, composition, usable area, cost, and energy load. The qualitative criteria are computationally hard to assess, and mostly relies on design expertise. To support designers in managing the design alternatives, several Design Space Exploration (DSE) tools have been proposed (e.g., see the Design Explorer 10 ). A characteristic feature of these interfaces is the combination of abstract data visualizations (data views) and visuals of design geometries (form views such as 2D images and 3D models), which can be used to evaluate and select generated designs.
As an example of a generative design project, in a real-world case exploring massing design solutions for an urban rezoning project in Vancouver, Canada, our industry partner’s designers generated more than 100 alternatives (Figure 1 shows a subset of solutions). Following that, designers search for alternatives that balance design goals, which can be driven by clients’ preferences, city regulations, and aesthetic, economic, or communal considerations. Each alternative is evaluated by considering performance metrics, such as setback limits, floor-space ratio, building height, site coverage in residential zones and annual hours of sunshine. Another objective is maximizing views from floors to nearby parks. Furthermore, building masses and the space between them are subject to qualitative considerations such as ease of movement, space for greeneries, and ease of construction. A sample set of design alternatives and focusing on one in a close-up view. The exploration studies solar gain and shadow factors (red means more radiation). Gradient colours on the surfaces represent the solar radiation received.
When presented with a collection of alternatives, how can designers search for the designs that best meet their goals and balance their design criteria? How can DSE tools support this kind of search, and what are the characteristics of these tools? And how to create these tools in ways that do not overwhelm designers or interrupt their creative flows?
Our close study of Design Space Exploration (DSE) approaches and tools in the literature revealed an opportunity to focus on a systematic exploration of tasks and corresponding tool features for DSE systems. This study critically reviews current DSE tools followed by identifying a domain characterization of DSE, i.e. the abstract goals and tasks to which DSE can be broken down. We present DesignSense as a novel DSE tool that learns from and expands on several features found separately in current DSE systems. We also based the interface design on domain task characterization and lessons adopted from information visualization. Finally, we present a formative focus group evaluation that suggests several areas for improvement.
Methodology for DSE problem characterization
Design studies 11 are a commonly used methodology in the field of information visualization to develop bespoke data visualization solutions for targeted domain problems. Design studies are suitable for designing and developing design space exploration tools as they tackle a domain problem (exploring the outputs of generative design) supported by data visualizations. Through a design study, we aimed to characterize the domain problem of design exploration of generative design through multiple iterations of understanding and abstracting DSE as well as designing, prototyping and evaluating interactive visualizations for supporting DSE tasks.
We followed an iterative and agile user-centred design approach for system prototyping and solicited feedback on multiple system iterations from architects and computational designers (as domain experts) from two global design consulting firms. Besides continuous feedback from domain experts, we analyzed previous DSE interfaces through multiple critical lenses that were developed iteratively throughout our research, namely the degree of coupling between design forms and data on the interface, the utilization of simplification techniques such as data clustering, the richness of exploration-support features such as grouping, ranking, selecting and zooming on design alternatives. This critical analysis informed our approach to designing DSE interfaces. Finally, previous studies influenced how we frame the problem of DSE for generative design and how we approached designing DSE interfaces. Specifically, we built on a study by Shireen et al., 12 which investigated design exploration under choice overload conditions, and relied on models of DSE from domain researchers.8,13 Shreen et al. 12 identified that designers explore design spaces through criteria identification, construction, evaluation, and application when searching for solutions in a generative design task environment. Finally, we further evaluate the developed system through a formative focus group with domain experts to receive initial feedback on how well it supports DSE of generative design, with a task-based evaluation to follow in the future, featuring think-aloud protocols during design exploration and open-ended interviews.
Background and related work
Before critically reviewing the literature, we introduce the key concepts we borrowed from the information visualization field (c.f. Munzner
21
for details) to help the readers contextualize the arguments presented. • A • • A • • • •
Data generation process and data abstraction
Generative design systems in architectural design increasingly use parametric data-flow models.
14
A typical combination uses a parametric model to generate 3D forms, such as Grasshopper and Rhino3D,
15
where each combination of values for the model’s parameters is a design alternative, and all possible combinations form a design space.
14
Designers generate designs
Each design alternative in DSE includes the input parameters used to generate it and the output performance metrics resulting from evaluating it. Each design alternative also has an associated design form represented with 2D images, 3D geometry or both. Images can be used to visualize the results of performance simulations, such as colouring based on how much annual sunlight they receive (e.g., see Figure 1).
Design space visualization
Using information visualizations for DSE has many precedents in different fields. For example, the ARL Trade Space Visualizer,
22
modeFrontier,
23
RAVE,
24
and LIVE
25
are widely used systems in engineering to integrate design visualization and optimization. They use feature-rich support for various abstract visualizations such as parallel coordinate plots, scatterplot matrices, and histograms. Users of these systems can
In architectural design, selecting designs requires judging performance and form criteria together, which is necessary for a holistic evaluation. Designers seek to understand their design problem and the performance-to-form relationships in their generated design space (i.e., make sense of it).12,13,41 Therefore, data visualizations should support identifying patterns in data and revealing relations between data attributes. Users facing shopping interfaces place visuals of ‘merchandise’ at the forefront but only support simple widgets and controls that do not sufficiently contribute to understanding the problem. Finally, unlike passive shoppers, designers use any insight gained towards generating new solutions (refine). In the middle between data-focused and visually-oriented shopping interfaces, we find DSE interfaces that couple abstract data visualizations with form visualization in 2D or 3D views. The early examples of such DSE interfaces from the visualization community are FilmFinder, 28 Design Galleries, 29 and EZChooser, 30 among others from different design domains.10,31–47
Analysis of DSE interfaces
Our survey covered about 30 interfaces and focused on issues such as the relation between data and forms during DSE and the management of alternatives. The DSE interfaces we identified are complex; we analyze them through multiple lenses developed iteratively. The recent work by Garcia and Leitao 48 presents a similar analysis of DSE interfaces. Their study included nine interfaces and covered how design parameters and forms are visualized and the available means for managing alternatives through searching, filtering and ranking. Our analysis makes similar (and different) observations and expands them by employing concepts from information visualization and human-computer interaction. The study by Garcia and Leitao covers other areas not discussed here, such as the use of multidimensional sliders and the relation between Algorithmic Design and DSE (c.f. Garcia and Leitao 48 for details).
Data and form coupling
The literature on DSE argues for coupling qualitative and quantitative characteristics for evaluating design alternatives.35,38,40,42,43,49,50 Our analysis distinguishes the interfaces representing design forms (form views) and data like performance metrics and input parameters (data views).
Data views and input manipulation
DSE interfaces use abstract data visualizations for selecting alternatives based on their performance or input values. For example, parallel coordinates plots (PCPs)10,32,34,38,41,46 or scatterplots40,44,51 are used separately or together for supporting multidimensional data visualization.35,37,45,47 When considering the manipulation of input parameters, as opposed to visualizing their values, Garcia and Leitao 48 observed that most DSE interfaces included 1-dimensional sliders only to manipulate inputs. The alternatives to 1-dimensional sliders, namely 2D/3D sliders and 2D/3D parallel sliders, are rare, except for the D.Star, 41 which supports manipulating plotlines on a PCP. 52
Form views, overview and details
Overviews of design forms can be seen in multiple DSE interfaces, including interactive (e.g., scrollable, sortable) grids of thumbnail images10,35 or 3D geometries. 40 Other visual presentation approaches rely on preprocessing with clustering or dimensionality reduction. Aside from overviews, detailed form views for an alternative can be found as a zoomed 2D image and an interactive 3D view.10,31,38,40,47 The detailed views can have multiple images10,38 to provide different perspectives on forms (e.g. side, top or perspective views).
Compositing form and data views
Multiple patterns exist for compositing 53 form and performance data, 53 for example, juxtaposition (e.g., Dream Lens 40 ), superimposition (e.g., colouring surfaces by the amount of sunlight they receive in Figure 1), nesting (e.g., visual thumbnails inside Self-Organized Maps 38 ), overloading (e.g., forms’ details window inside Parallel Coordinates Plots in Cupid 32 ), or integration (e.g., Design Galleries 29 ).
Interactions between data and form views
Most DSE interfaces support selecting alternatives based on their attributes only. Form views often only react to data-driven queries, and users relate forms with data attributes through brushing and linking combined with a distinctive and common visual encoding34,40,41,45 or through explicit visual links in others.
29
A typical example of data-driven queries is to filter design forms based on selections on a scatterplot 40,44,51 or a parallel coordinates plot.10,34,35 On the other hand,
Design space simplification
Multiple researchers5,54 argued that simplifying design spaces can alleviate the choice overload created by working with a large set of alternatives. Abuzuraiq and Erhan 55 showed that simplification, whether through clustering or dimensionality reduction, has been used in DSE systems to create overviews of the design space and to set the stage for data-form coupling (e.g., embedding displays of forms on a self-organizing map38,42 or in a hierarchical clusters tree embedded in a parallel coordinates plot 32 ).
Knowledge externalization
Designers make sense of a large set of alternatives by organizing them into collections that embody and dynamically change with their design criteria.12,41 The use of user-created collection(s) is rare in DSE systems. We find examples of supporting single collections under the name of a “cart”,
34
or “bookmarks”
42
or a “privileged collection”.
31
A single collection helps accumulate exploration progress but does not enable multiple criteria reviews, such as needed by intelligence analysts
20
or designers.
12
A few DSE systems allow working with multiple collections, whether by creating multiple data-flow streams
38
or first-class spatial containers.
56
On the other hand, general-purpose visual analytics systems support multiple collections in abstract representations such as
DSE domain goals and tasks
Based on the critical literature review, the tools used for DSE, and our interaction with design practitioners, we proposed the following DSE goals and tasks.
DSE goals
In generative design, interactive data visualizations can serve several overarching goals: making sense of (understanding), refining, and narrowing the design space.
Understand
Understanding the design space involves uncovering patterns, relationships, and performance trade-offs. Furthermore, designers can apply or identify new criteria by comparing multiple alternatives and assessing their strengths and weaknesses.
Refine
The generative design process is iterative. Examining alternatives can lead to changing the generative model (e.g., parametric model) to produce different forms or updating the performance metrics. Designers continually improve their understanding of the problem.
Narrow
Designers seek alternatives that
DSE tasks
We propose the following five high-level DSE tasks inspired by the visualization tasks taxonomy by Brehmer and Munzner. 19
Find potential designs (T1)
Designers explore to identify
Relate inputs to performance and form data (T2)
Designers analyze how input parameters influence performance and form to identify dependencies and correlations by sensitivity analysis.
Understand performance trade-offs (T3)
Designers consider output-to-output relationships to find effective designs or trade-offs. When trade-offs are present, designers may find, e.g., the Pareto-frontier among conflicting performance objectives. To arbitrate between designs with performance trade-offs, designers compare design forms or weigh performance metrics based on various factors. Designers also connect outputs to design forms to identify the features contributing to a performance portfolio.
Couple form and data (T4)
Designers may compare design forms to arbitrate between designs with similar or trading-off performances. Overall, the analysis of designs’ performance and form is interwoven and has no specific order. Designers can inspect an individual alternative (performance or form) to learn about it in detail, compare multiple alternatives, or overview many alternatives as a step towards understanding and narrowing them. 12
Externalize insight (T5)
In a study by Shireen et al., 12 designers were asked to explore a large set of generated alternatives printed on cards. They observed several search patterns, including putting designs into groups according to different criteria or hypotheses (e.g., the group of buildings with circular shapes) and marking, tagging, ranking, and discarding alternatives. The above patterns suggest that designers externalize their knowledge during DSE akin to the sensemaking cycle reported by Pirolli and Card. 20
DesignSense’s system design for DSE
We developed DesignSense as a fully functional DSE prototype featuring coordinated and linked views,
59
representing and tightly coupling views of the design forms and performance data (https://www.designsense.app/). We proposed mechanisms for expressively selecting from and navigating through design alternatives (Figure 2). DesignSense is implemented as a front-end web interface using Vue.js and D3.js. It enables the storage and retrieval of design data, similar to Design Explorer.
10
DesignSense includes the following coordinated views: (1) A parallel coordinate plot. (2) a scatterplot with lasso and rectangular brushes. (3) a gallery of sorted and selectable image thumbnails. In addition to (4) the top bar where system-wide operations are accessed. (5) a panel where alternatives saved as a set are shown. (6) a panel where results from a background clustering algorithm are presented.
DesignSense facilitates the exploration and selection of numerous alternatives (T1) while enabling both qualitative and quantitative assessment (T4) to support sensemaking and problem understanding (T2, T3). Interactive form and data views facilitate combined evaluation, fostering bidirectional selection and design inspection, facilitating a continuous review of qualitative and quantitative criteria. Operations such as grouping, information-seeking, and annotating aid in organizing the design space (T5) and adding subjective semantics to groups, enabling users to build on previous exploration progress. Complex selection queries are visually and incrementally made using various logical operations, with support for clustering and Pareto analysis throughout the exploration process. Users can seamlessly switch between overview, comparison, and inspection levels of design analysis without mode switching. Interface components are customizable to accommodate changing project needs, leveraging large displays effectively. Below, we describe the system details, justifying our design decisions where needed.
System features and composition
DesignSense proposes novel features while adapting others that appeared separately in the literature but not in the same combination and degree of integration in DesignSense. Its first contribution addresses the need for coupling form and data through form-driven selections and linking form and data views. Second, it tackles the choice overload problem 54 by introducing integrated clustering features. Third, DesignSense aims to support the sensemaking cycle in DSE through knowledge externalization, allowing users to create, manipulate, and annotate sets of designs. Additionally, it offers minor yet important contributions, including incremental expressive selection (disjunctive queries), workspace customization, and seamless switching between overview, comparison, and inspection modes.
Incremental and Expressive Selection
Most DSE systems we analyzed (except38,61) supported only conjunctive queries that are made by finding the intersection (logical AND operations) between sets, e.g., users can narrow the design space by repeatedly brushing on scatterplots or by picking ranges on widgets’ sliders. However, we argue that disjunctive queries should also be supported since they afford a higher degree of expressiveness and flexibility and allow users to select non-contiguous regions in the design space or select values from dimensions that are not ordered. Kazemi
62
argues for disjunctive queries in design exploration on interactive and visually guided queries. In DesignSense, the users can choose alternatives from any view, and the selection is coordinated with all views through brushing and linking, using a consistent visual encoding scheme. Selections occur via various brush types tailored to each view, and they are shared. They can be refined incrementally (similar to Wills
60
) through actions like replacement, addition, intersection, subtraction, and toggling or negating. The users can choose an operation, invert and clear selection by key modifiers or on fixed or floating menus (Figure 3). (1) set-based operations applied on selections. (2) toggling inspection (left), selection modes, creating sets, clearing and inverting selection (middle), information-seeking functions, e.g. zoom, filter, and resetting dataset (right). (3) On-demand context menu with frequently needed functions, where colour-coded icons distinguish their category (inspection, selection or information-seeking).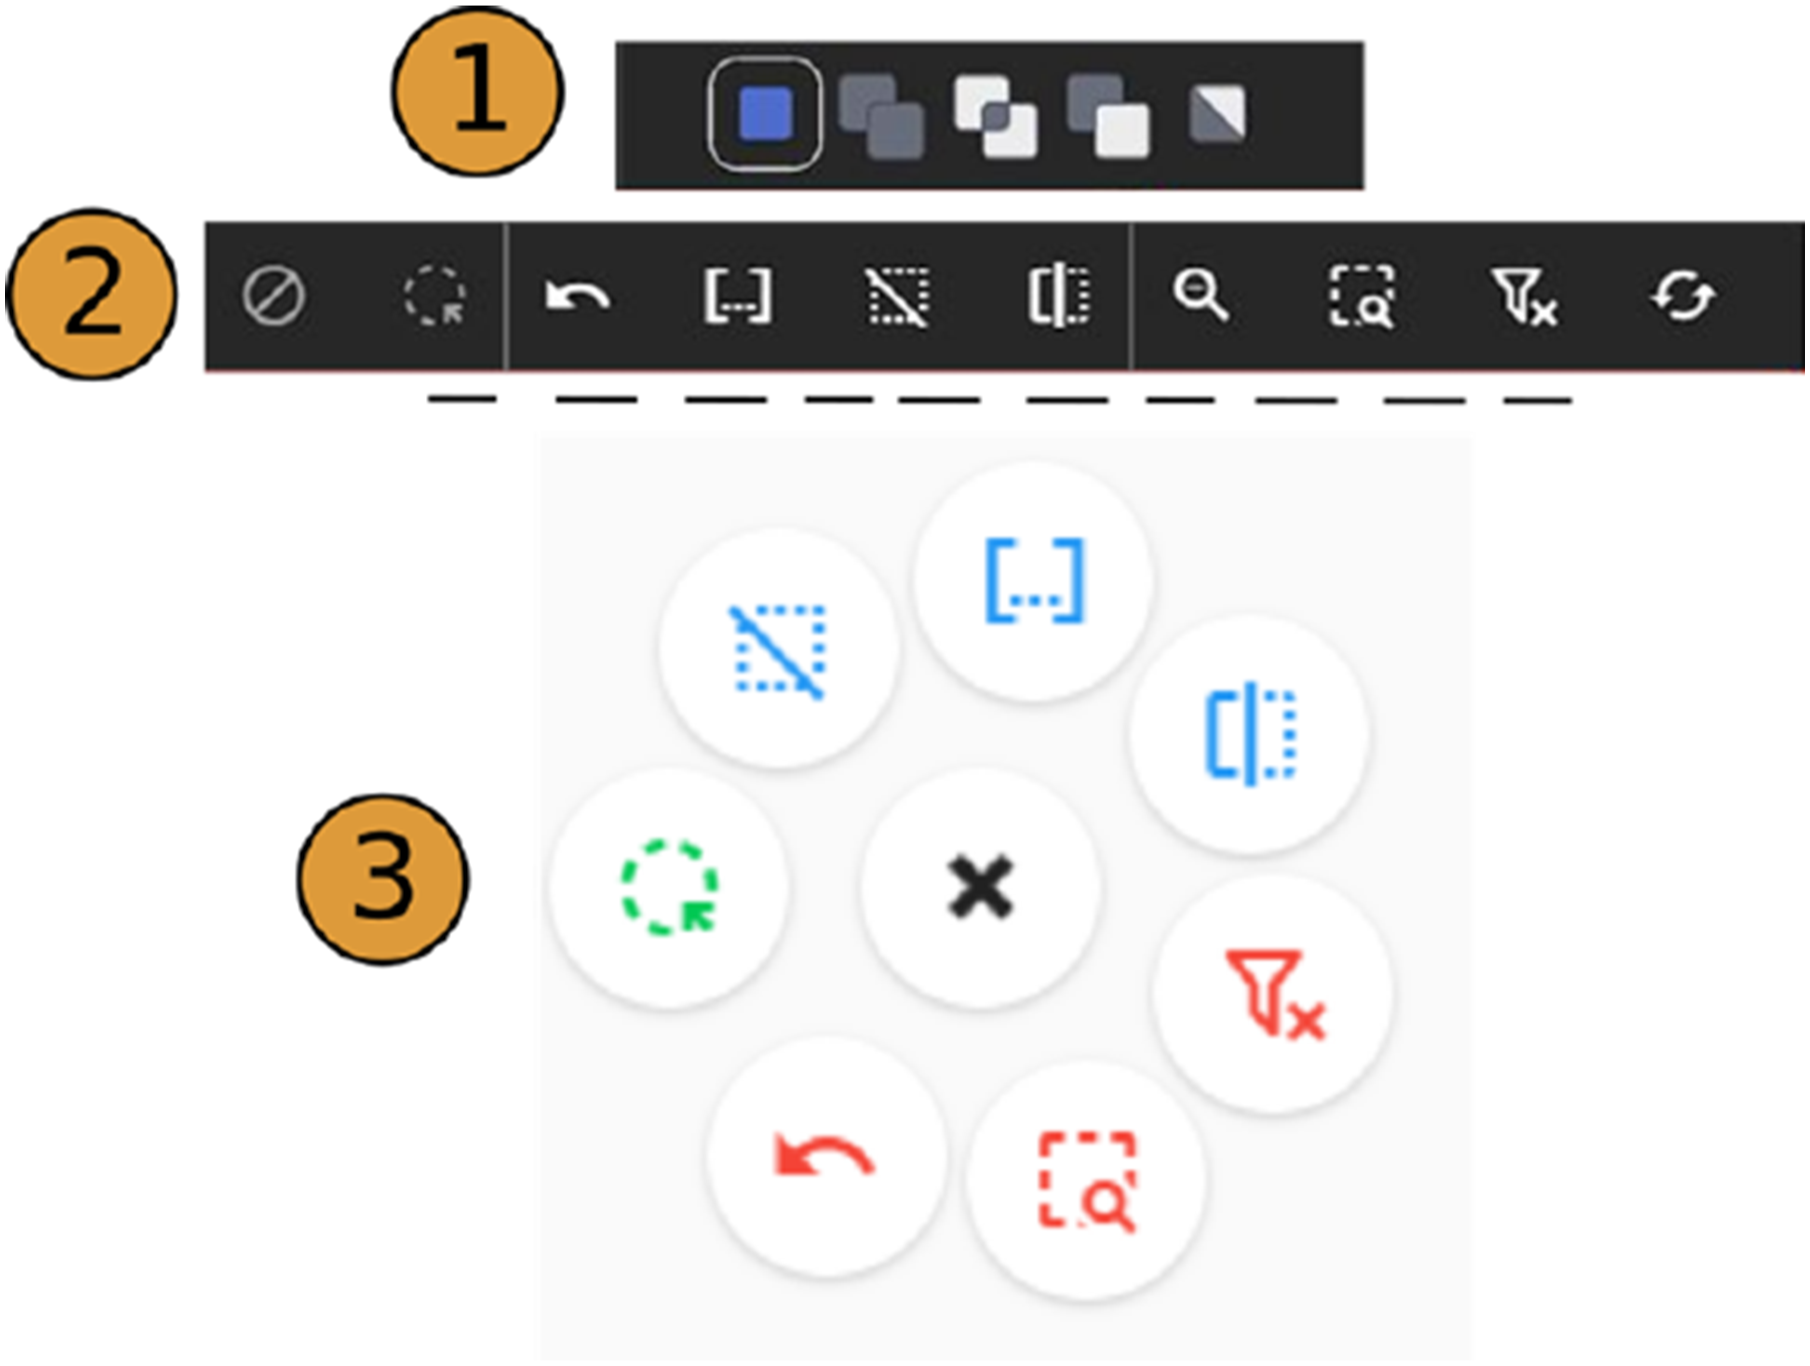
Information Seeking
DesignSense enables exploring a dataset shared between all or on one view. At any time, the shared dataset can be restricted to the selected design alternatives (zoom), or users may exclude the selection from the dataset (filter). We implemented undo to return to a previous state(s) and reset operations to reload the initial dataset to provide control and avoid premature commitment.
Inspection
While reviewing alternatives, users may inspect an alternative or visually link its representation to different views. When inspecting, the encoding on all the views changes to emphasize the data in focus. Users can initiate inspection by hovering (along with a modifier key) over an alternative’s representation in any view, such as its thumbnails in a gallery, lines in the parallel coordinates plot, or dots in the scatterplot (Figure 4). (1) Rectangular brushing on the PCP view. Tooltips show the precise brush range. (2) The lines of an inspected alternative are thicker, while the lines of currently selected and unselected alternatives are given a lower visual priority. Finally, inspection is enhanced with tooltips that show the exact values for all dimensions. (3) and (4) inspection on the scatterplot with a circle outline and on the AG with thick dashed outlines around the thumbnail.
Data views
To support identifying the relationships (T2, T3) and narrowing the design space with data-driven queries (T1), we provide two data views, a PCP view 64 and a scatterplot view. Both visualizations are common in the DSE interfaces. In practice, PCPs are used to provide an overview of multidimensional data. They are also commonly used for filtering and identifying outliers. Since the order of axes in a PCP impacts whether a correlation is discernible, we support reordering and inverting axes. A rectangular brush along any axes can select an interval of values; once dragging is over, the alternatives brushed are integrated into the current selection depending on the current selection operation. To enhance the precision of selection on the PCP, we show a tooltip with the exact range of the currently drawn brush (Figure 4).
In DesignSense, users can select alternatives by rectangular and lasso brushes on the scatter plot. They can use the Pareto Frontier function to decide on the trade-offs when performance objectives conflict. The Pareto Frontier consists of designs that cannot be modified for one objective without compromising the others. Users can visualize and select frontiers for the two dimensions on the scatterplot (Figure 4 - (3)).
Form-driven selection in Augmented Gallery (AG)
DesignSense offers filtering, comparing, and inspecting alternatives based on qualitative criteria on the forms visualized in an interactive gallery of thumbnails, referred to as the Augmented Gallery (AG) (Figure 5). The bottom panel shows a grid of image thumbnails, each representing a different alternative. The thumbnails can be resized to increase the details and visibility, scrolled through, or sorted based on a data dimension. Also, the AG enables form-driven selection by dragging rectangular brushes on the thumbnails, which is most effective when combined with a sorting order and an image size large enough to discern the qualities of the design alternatives. It is also possible to toggle selections on their thumbnails. The Augmented Gallery (AG) shows sorted thumbnail images for all alternatives. Users can select alternatives by brushing on thumbnails or toggling, choosing to offer only the alternatives currently selected (eye icon) and seeing an enlarged image or 3D view of the alternative under inspection.
Users can hide unselected alternatives from view (through the eye icon) on the AG and continue narrowing the selection. Further selections are shown in this mode with dashed lines (Figure 5). The AG facilitates an in-depth comparison of a few alternatives through on-demand expandable panels containing a vertical list of data key-value pairs (Figure 6-Bottom). For closer examination, the AG offers a detailed inspection panel showing an enlarged image of the selected alternative, with the option to cycle through multiple images if available. The AG also has a 3D form view that allows panning, rotating, and zooming to enable focusing on desired design aspects. Top: Brushing is denoted with dashed lines when the AG only shows the current selection. Bottom: Direct comparison is supported via an expandable panel below each thumbnail listing design data as key-value pairs. This feature becomes available when the size of the icons is set to the largest.
Coupling Form and data
Coupling the qualitative and quantitative aspects of alternatives can be achieved by coordinating and moving back and forth between form and data views in DesignSense. For example, selecting alternatives in the gallery also visualizes the selection on the scatterplot and the parallel coordinates plot (or vice versa). This allows for the visual and numerical filtering of alternatives (e.g., a designer can first select a set of alternatives that fall within a certain threshold of sunshine utilization on the PCP by followed or preceded by selecting the alternatives with acceptable open-space utilization on the gallery). Coordination can also happen on one alternative through inspection (e.g., a designer reviews the form behind a specific alternative with a high area-to-volume ratio, as in Figure 4).
User-created sets
During exploration may want to save their progress to revisit it later or combine the results of this inquiry with earlier results. DesignSense enables that by supporting saving and retrieving selections into sets (Figures 7-(1)). Replace, Add, Intersect, Subtract, and Toggle operations apply when retrieving a set, which is treated like making a new selection. Users indirectly operate on and compose new sets from existing ones by systematically retrieving sets. This process is visually informed
65
and distinguishable in all views since recovering a set updates the current selection. Users can delete sets or add comments to them. (1) The Sets view contains a list of cards, each representing a set. The number of alternatives in each is shown. Sets can be deleted, retrieved and updated. (2) In the Clusters view the thumbnails show the clusters’ representatives. (3) the trophy symbol on the scatterplot view computes and highlights the Pareto-frontier for the chosen dimensions.
Clustering
Clustering is supported through the Clusters view to integrate simplification in DSE. Using the K-means algorithm, alternatives are clustered based on user-chosen quantitative dimensions after normalization. The clustering algorithm is run every time the visualized data is transformed, e.g., through filtering or zooming operations. We use the alternatives closest to the clusters’ center as representatives to visualize each cluster. Representatives in Clusters view (Figures 7-(2)) provide a visual overview of the design space and can be a starting point for further exploration. Selecting any cluster can be followed by any set operation of its members against the selection as the other cluster.
Flexible Layout and supporting multiple displays
All views in DesignSense can be resized and moved to support working on multiple display setups. Furthermore, an on-demand context menu (Figure 3-(3)) is provided to reduce travelling to the top menu bar for most system operations.
How DesignSense addresses gaps in the DSE literature
DesignSense addresses the multiple gaps found by surveying around 20 DSE systems: 1. Form-driven Selection. Although coordinating form and data views can be a common DSE system feature, only two systems offer form-first interaction, i.e. filtering designs based on forms alone.32,40 The specific form-driven selection implemented in DesignSense, i.e. brushing/clicking on the images gallery, is not seen in other DSE systems. 2. Support for Multiple Collections. Only five DSE systems out of the systems surveyed allowed designers to create collections or sets of designs. Three out of five only enabled putting designs into a single collection31,34,42 (i.e. as a shopping cart
34
), while two others enabled creating multiple collections38,56 at the same time. With a support for multiple groups, each group can represent a different search criteria or the result of a separate line on inquiry. 3. Support for Expressive Selection. Except for three systems,38,61,62 most DSE systems only supported Intersection (AND queries) between subsequent selections on the interface. In contrast, DesignSense and a few others,38,61,63 support additional selection mechanisms such as forming Unions and Subtraction boolean operations between groups of designs, which results in a more expressive query language for selecting designs. 4. Simple Integration of Simplification into DSE. Out of the surveyed systems, some used simplification (i.e., clustering or dimensionality reduction), but only two systems32,42 (other than DesignSense) integrated simplification into design exploration such that it is coordinated with form or data views. However, we argue that DesignSense presents the results of clustering/simplification in a simpler manner, i.e. thumbnails of clusters’ representatives.
In summary, DesignSense tightly links and adds to several features found separately in current DSE systems.
Evaluation of DesignSense for DSE of generative design outputs
We evaluated DesignSense in a formative focus group study to receive initial feedback on how it can support DSE goals and tasks. Figure 8 shows DesignSense at the time of the evaluation featuring the PCP, the scatterplot, and the Augmented Gallery (without the inspection panel), coordinated brushing and linking, information-seeking, user-created sets, clustering, and moving and resizing views. After the evaluation, we added the inspection, side-by-side comparison, lasso selection, Pareto-frontiers computation, or context menus features. The interface of DesignSense at the time of evaluation.
Focus group details
The focus group consisted of eight architectural and computational designers from the same firm, all experienced in generative design and DSE using Design Explorer. 10 Four were expert computational designers, and two specialized in building performance. Participants met online. Two researchers led the session: one presented DesignSense by screen sharing, and the other moderated the discussion on the DSE tasks and tool features. The aim was to gather feedback on if and how DesignSense could be used in practice and to receive suggestions for improvement. The participants were asked to focus on the tasks and features rather than the project.
The two-hour session was recorded, and meeting notes were taken for data analysis. In the first 30 min, we demonstrated the DesignSense features using a project from the participants’ firm. An open-ended discussion with frequent references to the interface followed the demonstration in the rest of the session. The focus group resulted in an engaging discussion about the DSE and DesignSense centring on idea generation rather than confirming features.
Evaluation results
One researcher reviewed the video recording and the meeting notes to encode data in a thematic analysis to group the topics that emerged. Generally, the participants agreed that the features for supporting DSE tasks are comparable to or enhanced from other DSE interfaces, such as Design Explorer. 10 Below is a summary of the themes that arose during the discussion:
Visualization and shifts in design concerns
A noticeable theme emerged around distinguishing and prioritizing the data visualized based on the two concerns: design form and building performance. Both involve using different suites of tools while working closely with each other on a design project. For example, performance analysis results are reported to designers to inform their design decision-making; changes in the forms imply changes in the performance measures. The participants interested in building performance expressed a potential integration of their usual analysis process, such as creating a value function akin to the Design Space Construction framework. 9 This method involves weighting and summing normalized performance values based on project-specific preferences, to help in multi-criteria decision-making. Additionally, they showed interest in sensitivity analysis, descriptive statistics, trend lines, data normalization, prediction via surrogate modelling of building performance, and ANOVA tests.
The participants who work closely with form asked for the ability to inspect a design’s geometry in more detail, e.g., for
Scatterplot
The participants found brushing and highlighting data between scatterplot and other visualizations useful. They asked for additional demonstrations of brushing on various views multiple times with emerging design questions.
Clustering
The participants found that clustering, combining clusters, creating sets and brushing contributed to improved filtering of design alternatives. They noted that these features complemented each other and had the potential for
Set-based exploration
The focus group appreciated using sets to store and retrieve alternatives based on preferences or criteria and user notes. And they recommended a persistent repository for such sets. One participant noted that
Derived data
One participant suggested new features that can enable designers to derive additional data from available data, such as through pre-determined or custom formulas. At least descriptive statistics functions (e.g., mean, min, max, std) can be useful for comparing alternatives. They noted that
One participant highlighted the difficulty in “subjective intervention” when working with derived data, such as weight preferences assigned to each objective in a value function. They mentioned that assigning
Diagonal sorting
The sorting alternatives in the AG view provoked ideas for additional sorting strategies. The participants shared a printed form of “
Comparison
The participants showed an interest in comparing a small number of design alternatives in detail. They pointed at a different interface for comparing designs side-by-side. This feature is now implemented in the prototype but was not part of the evaluated version.
Multiple ways of visualizing form
Participants requested supporting multiple images for each design alternative to be able to view different performance metrics. For example, they mentioned using data mapped on the views to show
Flexible layout
The participants appreciated the ability to resize and move the different panels freely in the DesignSense interface. One participant pointed out that
Discussion
Matches vs. Mismatches
Three categories of features resonated the most with participants, judging from the positive feedback they received or the discussion they provoked. The first category relates to the coupling of form and data, a major driver for this work. The second category is set-based exploration, which includes all the features for creating and manipulating sets like coordinated selection, disjunctive queries, information seeking, user-created sets, and clustering. The interest in these features can be seen as a response to the large design spaces of generative design, which motivate systematic set-based exploration. The third category contains more specific features that were received positively, like the scatterplot view and the flexible interface layout change.
The participants also proposed multiple features highlighting some system mismatches during evaluation. These include assigning more screen space to form views, integrating more data analysis into design exploration, and linking the representations of individual alternatives on data and form views. The participants in the evaluation were silent about disjunctive queries (c.f. section on Incremental and Expressive Selection), which extend the conjunctive (narrowing) queries prevalent in DSE tools.
Designers vs. Scientists
The evaluation highlighted the different concerns designers and building scientists had when using a DSE interface like DesignSense. Matejka et al. 40 made a similar distinction between the ‘engineer’ type of users and the ‘artists’. They also argue that accommodating both groups (and those in between) can encourage them to appreciate each other’s concerns. Each group contributed different features to our discussions, e.g., asking for a larger form view versus more data analysis. In general, the evaluated version of DesignSense appealed more to the scientists among the participants. It highlighted the need to tailor the interface to each group through different features.
Exploration vs. Analytics
The evaluation revealed the need to support the design decision-making with design data visualizations and the demand for integrating exploration with data analysis (i.e., design analytics). This can be accomplished through visually-assisted support for techniques such as sensitivity analysis and value function elicitation, among others.
Future work
Our future research will continue, based on the initial formative evaluation, to focus on the following areas: (1) attuning to different user groups, (2) improving the system’s scalability and the exploration session’s longevity, and (3) conducting a task-based evaluation.
As evident from the focus group, the features of DesignSense currently appeal more to building scientists and designers with building performance expertise. An important area of future research is exploring how to make DesignSense easier to learn and use by designers without a background in data analysis. This can be achieved by introducing interface presets. For example, a designer’s preset prioritizes form views and simple visualizations, which will differ from an engineer’s preset, focusing on advanced data analysis. Furthermore, a combination of tooltips, tutorials, and walkthroughs could help make DSE interfaces more approachable to designers.
DesignSense is currently implemented as a front-end web page. We plan to implement a back-end system that allows users to maintain a persistent record of their exploration and design sessions. Furthermore, loading images and 3D models is currently a performance bottleneck that prevents DesignSense from scaling to large datasets. A back-end server can optimize form data processing by pre-compressing before serving to reduce loading time. Finally, a back-end server makes it possible to connect DesignSense to parametric modellers so alternatives can be generated on demand without leaving the interface, as well as offloading heavy building performance analysis tasks to the server.
Finally, the two-hour focus group session was not enough to review the system in detail and leaned towards suggestions rather than testing the choices made on DesignSense. Next, a follow-up task-based evaluation should directly assess DesignSense concerning the revisited domain tasks and the flow between them within the context of a realistic design project and the diverse needs of the users (i.e., designers or scientists).
Conclusion
Unlocking the full potential of generative design hinges on many factors that span the entire generative design process and extend beyond it since the generative design is often one part of a larger design process.
8
These factors include the variation
66
and validity
67
of the underlying generative model and the ability to sample the design space that the model endows for diverse
68
and optimal alternatives. Generative design also relies on the ability to explore this generated set in a way that is unhindered by the size of this set5,54 and in a manner that reflects design judgment,35,38,40,42,43,49,50 with its quantitative and qualitative dimensions. We argue that designers may avoid generative design systems if they lack proper support in exploring and utilizing the generated outputs. Therefore, we view this work as a step towards reducing the barriers to using generative design in practice by designing better DSE interfaces than are currently available. In particular, DesignSense does so by enabling designers to explore the outputs of generative design without being overwhelmed by the overload of design choices and to be data-informed in their exploration without forgoing their
Although we focused our design study on the architectural design domain, the same need for coupling form and data and the same challenge of choice overload exists in other domains where forms are culturally important such as product design, mechanical design, urban planning and game design
69
to name a few. The demand for coupling ’form’ and data is not exclusive to design domains either, the design study by McCurdy and Meyer
70
with astronomers and astrophysicists showed a lack of support for the coordinated statistical and visual analysis of galaxy observation. Finally, design space exploration and shopping share many features, but whereas designers can create new alternatives on demand, consumers cannot. Nevertheless, future work can explore the data visualization and analysis features that could enhance consumer-facing shopping interfaces. Figure 9 shows a preliminary exploration on that front where we load and explore a dataset of used cars into DesignSense. Using DesignSense to shop for used cars using the posts retrieved from a popular community website.
We presented a domain characterization of DSE for generative design and a critical analysis of available DSE systems. We introduced DesignSense as a novel DSE system that integrates features found separately in existing systems and adds new ones. We based our design reasoning on domain task analysis and lessons from the information visualization field. We share our initial findings from a formative focus group evaluation of DesignSense that suggested several areas for improvement and highlighted the need to design DSE interfaces that accommodate the differing needs of both designers and scientists.