
Abstract
1 Introduction
The Oxford Dictionary defines subjectivity as “the quality of being influenced by personal ideas, opinions, or feelings, rather than facts”. It may be considered as judgment based on individual impressions, feelings, and opinions, rather than external facts (Akhtar-Danesh, Baumann, and Cordingley 2008). William Stephenson introduced Q- methodology as an option for studying subjectivity, which he conceptualized as a person’s self-referent internal experience (Stephenson 1935a, b). Stephenson demonstrated, using empirical methods of measurement and analysis, that a person’s subjective internal experience has structure that is operationalized by a factor analysis of a person’s Q-sorts (Stephenson 1953).
Accordingly, Q-methodology is appropriate for research about attitudes, feelings, values, life experiences such as stress and quality of life, and intraindividual concerns such as self esteem and body (Dennis 1986). For example, Q-methodology has been used for research about political science (Stevenson 2019), pain (Risdon et al. 2003), job satisfaction (Chinnis et al. 2001), clinical decision making (McCaughan et al. 2002), nurses’ attitude toward health promotion (Cross 2005), stress (O’Byrne et al. 2021; Yeun et al. 2016), course evaluation (Brewer-Deluce et al. 2020; Mackinnon et al. 2022), information systems (Wingreen and Blanton 2018), climate change (Lo 2015), and health economics (Baker, Thompson, and Mannion 2006).
In a Q-methodology study, the subjective data collected from each person are collectively called a Q-sort. A Q-methodology study comprises qualitative and quantitative components. The quantitative component includes a by-person factor analysis of Q- sorts that factorizes participants into different groups, which reveals the structure of people’s internal subjective experiences.
The qualitative component of a Q-method study involves an interpretation of the factor structure revealed by the data analysis and may also be preceded by a rotation of the factors whose purpose is to make the factors more interpretable (Thurstone 1947). In a factor rotation, the factor axes are rotated to highlight salient aspects of the factor structure to be interpreted. By analogy, it is something like rotating a sculpture to achieve a viewing angle that best invokes a desirable ambience or sensation.
Sometimes, it is desirable to study how people’s subjective responses, perceptions, and their associated factors change over time and from one circumstance to another (for example, Bilal, Wingreen, and Sharma [2020]; Klaus, Wingreen, and Blanton [2010]). However, this is a conspicuously underresearched topic in the literature of Q-methodology, partly because of the lack of supporting statistical tools and methodological procedures. Although there are several commands for the statistical analysis of cross-sectional Q-sorts, such as PQMethod (Schmolck 2014), PCQ (Stricklin and Lincoln 1996),
2 Q-methodology
Philosophically speaking, people interact with the universe of their perceptions and inner life in every conscious moment: sights, sounds, smells, tastes, touch, the sensations and emotions evoked by their senses, and their thoughts about them. The boundaries of a person’s potential experience are infinite, so Q-methodology requires researchers to define a limited domain of subjective experience, which is called a concourse. But even within the restricted subdomain of a concourse, there are potentially infinite subjective experiences a person may have; therefore, Q-methodology operationalizes subjective beliefs, perceptions, and preferences by observing people’s interactions with a sample of the concourse in the empirically controlled procedure of the Q-sort.
The first step in a Q-methodology study is to define the boundaries of the concourse of interest. The next step is to develop a sample from the concourse, which for most academic research is usually a set of verbal statements to represent the concourse in the same way that a sample of people represents a population of people; this sample is called a Q-sample or Q-set (Brown 1993). The concourse may be developed from different sources, including a literature review, interviews, expert opinions, focus groups, or related techniques.
In this section, we use a running example to explain the terminology and steps used in a Q-methodology study. This example includes the marijuana legalization (ML) dataset (known here as the ML study). The ML study evaluated views of 40 participants on ML. The dataset was collected in different workshops on Q-methodology presented in different countries (Akhtar-Danesh 2018a).
In the ML study, the concourse was sampled by searching the World Wide Web and published literature on the topic, which resulted in 51 statements that represented the pros and cons of marijuana legalization. The statements in the concourse were reviewed by the research team to ensure that it satisfies various desirable criteria, for example, for clarity, to eliminate repetition, and to provide balanced coverage of the domain of the concourse (Akhtar-Danesh, Baumann, and Cordingley 2008). The review produced a Q-sample composed of 19 statements to represent the concourse (listed in table 1). The statements in the Q-sample are then randomly numbered and printed on a deck of cards with one statement per card, or as a “virtual card” in an online Q-sort application.
List of complete Q-sample (19 statements) with their randomly assigned numbers used in the running example (ML study)

Next a grid with a quasinormal distribution is developed (Q-sort table) that has the same number of cells as the number of statements in the Q-sample. The grid is printed (or designed online) to serve as the data entry form. This grid includes a rating scale that typically ranges between about
The reason for designing a quasinormal distribution is that many scholars believe it is a better model of participants’ preferences when compared with uniform distributions where people sort equal numbers of items into each category or with “free” distributions where people may sort as many or as few items into any category as they desire, although this has been a topic of some debate among Q-methodology scholars (Brown 1985). Briefly, the scholarly debate on the issue revolves around the tradeoffs between methodological rigor and the desire to faithfully model the true distribution of people’s beliefs. Cottle and McKeown (1980) demonstrate that the shape of the distribution is of little relevance with regard to the statistical analysis of Q-sorts because different distributions result in nearly identical statistical results. In theory, the quasinormal model is a better fit for people’s true subjective beliefs because most people feel very strongly about a few things, feel strongly about a greater number of things, and are ambivalent or neutral about an even greater number of things. For these reasons, most Q-methodology research implements a quasinormal distribution, although it is not strictly necessary to do so. The Q-sort table for the ML study is shown in figure 1.

The Q-sort table used for data collection in the running example (ML study)
Participants then sort the cards into the Q-sort table according to a “condition of instruction” by which to elicit their preferences. The condition of instruction is customized based on the objective of the study, the number of statements, the Q-sort table, and the participants. For instance, the instruction may differ based on the literacy level of participants or if the participants are adults or children. The purpose of the Q-sort statements, Q-sort table, and sorting exercise is to provide an empirically observable, replicable means by which the person may interact with the Q-sample. Table 2 presents the condition of instruction for the ML study.
Condition of instruction for the running example (ML study)


Participants in the ML study first sorted each card from the Q-sample into three categories: agree, disagree, and neutral. Participants then selected the one card from the “agree” category that represented their greatest agreement and coded it +3; they did the same for the “disagree” category, selecting the one card that represented their greatest disagreement and coding it

The completed Q-sort table for the first participant in the running example (ML study)
In the next step, a factor analysis is conducted on the Q-sorts. For instance, table 3 shows the first five Q-sorts for the ML study. As seen in the table, the statement numbers in the Q-sort tables are transformed to the rating scale so that each Q-sort represents the view or preferences of one participant. In contrast to R-methodology, where variables are the object of factor analysis, Q-methodology subjects, represented by their Q-sorts, are factor analyzed. This is a by-person factor analysis, where each Q-sort is a field vector that represents one person’s coherent viewpoint on the topic of study (Akhtar-Danesh 2018a; Akhtar-Danesh, Baumann, and Cordingley 2008; Brown 1980). Similarly to ordinary factor analysis, the extracted factors are usually rotated to have simpler structures and to become more interpretable (Thurstone 1947).
The first five Q-sorts from the running example (ML study)

Following the analysis of the Q-sorts, the final step is the factor interpretation, which is based on the estimated factor scores for each statement and the identification of distinguishing statements for each factor. A distinguishing statement for a factor is one with a factor score that is significantly different from its scores on all the other factors (Akhtar-Danesh, Baumann, and Cordingley 2008). The distinguishing statements define the uniqueness of each factor compared with the other factors and are used in factor interpretation. For the ML study, the following output from the

In the manner described above, the infinite universe of people’s subjective experience becomes accessible to controlled, replicable empirical investigation. Before a condition of instruction is administered, all possible Q-sorts are equally probable and equally unpredictable. Each condition of instruction is an experimental treatment, and each Q-sort is an experiment in subjectivity. Analysis of Q-sorts reveals the structure of people’s subjectivity from which inferences and generalizations may be made about the concourse. Each factor represents its own coherent “theory” of subjective experience that is derived from the interpretation of the factor. For a complete review of Q- methodology, the readers are referred to Brown (1980) and Akhtar-Danesh, Baumann, and Cordingley (2008).
3 The qpair command
The
Until recently, Brown’s (1980) method has been the only option for estimating factor scores in Q-methodology. Similarly to the
Historically, Stephenson’s (1978) method has been the only method for identifying distinguishing statements; however, the
3.1 Syntax
The command syntax is
The
3.2 Options
3.3 Stored results
In addition to the displayed results,
These matrices can be retrieved and used in subsequent analysis, for example, to compare factor scores based on different factor extraction techniques, to compare demographic and other background variables among the extracted factors, or to graphically display rotated and unrotated factor loadings.
4 Example

The Q-sort table used in the PO study for data collection
4.1 Approach I, factorizing change in perception
If we want to extract three iterated principal axis factors (
The most important sections of the output produced by the above command are described below. First, as shown below, Stata displays the approach, the factor extraction and rotation techniques, the extracted factors with their eigenvalues, the differences between consecutive eigenvalues, the proportion of each eigenvalue to the total (number of Q-sorts), and the cumulative eigenvalues.

Second, each

Third,

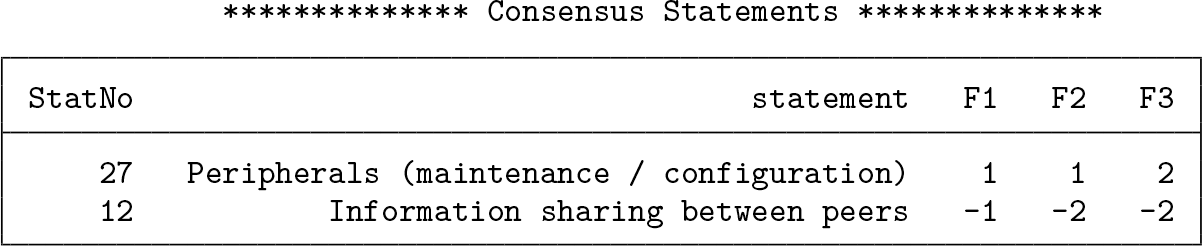
Finally, the consensus statements are shown below. There were only two statements (numbers 27 and 12) with factor scores that were not significantly different between the three factors. In other words, the ranking of differences for these statements was the same among all participants. For instance, all participants on average felt almost the same level of importance between their own views and the views of their organizations on
4.2 Approach II, measuring change from baseline
In the following,
The output regarding the unrotated and rotated factors are omitted, and sections of most interest to Q-methodologists are presented below.
First, the following section shows the approach and the factor extraction and rotation techniques.

Second, the following table indicates that 15 participants were loaded on factor 1 from the first set of Q-sorts (baseline). The statements that distinguish between this group and the other two factors are also shown in the table. For instance, participants who loaded on this factor ranked programming languages (statement number 1) as the highest priority compared with factor 2, which was ranked quite low (

Third, the following table compares the scores between the first and second sets of Q-sorts for the distinguishing statements among the 15 participants who loaded on factor 1. The score from the first set is shown under the

As can be seen, these participants ranked statement number 1 the highest (3) based on their own views (baseline) and their organizations’ views (follow-up); they do not think that there is any difference in their views and their organizations’ views regarding this statement. However, they indicated large differences between their views and their organizations’ views on
Finally, the following table presents all statements with factor scores for all three factors at baseline and the average factor score for each statement from the second set of Q-sorts.

4.3 Some other options with qpair
The other options that can be used with both
4.3.1 score() option for factor scores
Historically, factor score in Q-methodology is calculated as suggested by Brown (1980). In addition,
4.3.2 esize() option for identifying distinguishing statements
In all Q-methodology commands except
4.3.3 bipolar() option to identify factors with negative loadings
A factor might be bipolar, in which case it represents two opposing viewpoints. A bipolar factor can be easily identified by its negative factor loadings.
4.3.4 stlength() option to customize length of statement in the output
Sometimes, because of some lengthy statements or a large number of factors, the common output including the statement number (

5 Conclusions
In this article, we introduced
The
Finally, although the
6 Programs and supplemental materials
Supplemental Material, sj-zip-1-stj-10.1177_1536867X221141002 - qpair: A command for analyzing paired Q-sorts in Q-methodology
Supplemental Material, sj-zip-1-stj-10.1177_1536867X221141002 for qpair: A command for analyzing paired Q-sorts in Q-methodology by Noori Akhtar-Danesh and Stephen C. Wingreen in The Stata Journal
Footnotes
6 Programs and supplemental materials
References
Supplementary Material
Please find the following supplemental material available below.
For Open Access articles published under a Creative Commons License, all supplemental material carries the same license as the article it is associated with.
For non-Open Access articles published, all supplemental material carries a non-exclusive license, and permission requests for re-use of supplemental material or any part of supplemental material shall be sent directly to the copyright owner as specified in the copyright notice associated with the article.