
Abstract
Keywords
Introduction
Underwater acoustic sensor networks (UASNs) are capable of underwater environment in real time, accurate and effective monitoring, and can be widely applied to various fields such as underwater military target surveillance,
24
marine data collection, monitoring water quality, seabed mineral resources exploration, and assisted navigation.1,25–30 The quality of communication among the sensor nodes and the reliability of topology of UASNs have been seriously affected due to the factors of complex marine environment, such as the high latency, low bandwidth, and easy attenuation of signal and multipath effects, seriously affecting.15–23 Currently, optimization for terrestrial sensor networks has some achievements. Fu and Han
2
solve the sensor node–distributed optimization problems of the terrestrial sensor network by quantum genetic algorithm; Aziz et al.
3
consider comprehensively the battery power of sensor and other factors, then employing the distributed topology control technology to optimize the energy consumption of wireless sensor networks; Wang et al.
4
present a parallel particle swarm optimization (PSO) strategies based on the mobility of sensor node, so that distribution of the node in sensor networks reaches local optimum; Mi and Zhou
5
proposed a terrestrial wireless sensor network routing algorithm multi-objective optimization. Considering the particularity of UASNs in complex environments and underwater acoustic communication mode, Pioneers’ achievements in the optimization strategy are not fully applicable to UASNs. As adopted in Jafri et al.,
6
the connectivity of UASNs has been optimized from the aspect of protocol design, but there are key nodes in the UASNs, making the invulnerability of network topology unable to be improved (the key node means all single-hop neighbor nodes of this node belong to subsets which do not communicate with each other with the number of subsets at
It cannot ensure the communication between the all sensor nodes;
Throughout the life of UASNs always exist the key nodes, and this problem has not been effectively solved;
The interruption phenomenon happens during data collection of sensor nodes;
On the condition of being difficult to replace the equipment (e.g. the sensor) under water, it cannot maintain effective monitoring during the long-time mission.
This article takes into consideration both relevant features of UASNs and topological reconstruction of the underwater non-uniform coverage of UASNs. Moreover, we use the autonomous underwater vehicles (AUVs) to present two different methods for the topological optimization of two kinds of UASNs based on, respectively, topology reconfiguration (TO-A algorithm) and Double-autonomous underwater vehicle (Double-AUV); a new version of AUVs (TO-DA algorithm) is proposed in this article, which can overcome those limitations mentioned above. TO-A algorithm is divided into two stages: in the first stage, the artificial fish swarm algorithm (AFSA) is adopted to readjust the position of the sensor nodes that are inspired by node deployment algorithm 7 and then the coverage of the UASNs is optimized; in the second stage, the entire connectivity of the UASNs is restored using edge node in the UASNs to repair the disconnected position and eliminate key nodes to improve the invulnerability of network, so as to made up for the shortage of AFSA in the first stage. Shadow zones cause high bit error rates, loss of connectivity, and dramatical impact,9,31–33 so this article presents a new version of AUVs, called Double-AUVs (see Figure 1). By this way, (1) the connectivity among UASNs inside the shadow zone is established by Double-AUVs so as to avoid an information collection vacuum period generated by shadow zone while its carrying out mission; (2) a topology optimization mechanism based on Double-AUVs is adopted which is proposed in this article and an UASN’s key node is eliminated by triangle dilute methods to extend the life cycle of UASNs by sacrificing part of the coverage of the UASNs.

The reason for Double-AUVs.
The remainder of this article is organized as follows. In section “Network model and problem description,” we present our system model and raise the problem that needs solving. In section “The TO-A algorithm,” our new algorithm (TO-A algorithm) is described in detail. In section “The TO-DA algorithm,” we present our mechanism of topology optimization. An empirical evaluation of TO-A algorithms and TO-DA algorithm is provided in section “Experimental study.” The article concludes with recommendations for future work in section “Conclusion.”
Network model and problem description
Network model
In order to match with the actual situation, the energy consumption of sensor nodes in coordinate axis (include

where
In this article, sensor nodes are divided into three categories: key nodes, edge nodes and ordinary nodes.
Hypothesis 1. Underwater acoustic sensors have function about auxiliary locating. The node can exchange information between adjacent nodes to get the set
Hypothesis 2. AUVs node can communicate directly with the base station on the water.
Hypothesis 3. In the process of mission, the energy of AUVs node approximates infinitely large (represent
Hypothesis 4. There will be no new failure while topology optimization is performed by AUVs.
Hypothesis 5. There is no data loss when communication occurs among nodes.
Hypothesis 6.
Given the high cost of AUVs, the number of AUVs should be much smaller than the number of sensors, namely
Relevant judgment
Calculation of neighborhood topology of nodes
According to the Hypothesis 1, the sensor node

There is an example (see Figure 2): node


Local network topology: (a) the local topology.
Judgment for the key node and the edge node
Uneven characteristics of actual network are reflected in the network model, so there are key nodes and non-key nodes. In this article, we have a more detailed classification of the non-key nodes, the ordinary nodes, and the edge nodes. In order to prevent the network topology from breaking off after the node has been removed, the neighborhood topology of the node is supposed to be connected. That neighborhood topology of the node is connected is the sufficient condition to ensure that the network topology is still connected after the node was removed. We can obtain neighborhood topology

Neighborhood topology of
The set of neighbor of the node
Node
Check the values of
Repeat above procedure until all nodes in the set
Compare the set
For example (see Figure 2), the set of neighbor of the node
After determining the node
A method of localization of underwater sensor network is proposed by Heidemann et al., 10 and its effectiveness is verified by experiments on the sea. In this article, we use AUVs to patrol the mission area, gathering information about the marine environment, and the location of the nodes. And the location of the disconnected position is located by the method mentioned above. 10
Goal description
The UASNs topology changes frequently, resulting in the decrease of network performance due to the complex ocean environment. In order to improve the performance of UASNs topology and prolong the network lifetime, the network topology optimization mechanism based on AUVs is proposed (for both TO-A and TO-DA algorithms). Two optimization processes of the algorithm are shown in the following figure. Figure 4 is a schematic diagram of the optimization process of two algorithms.
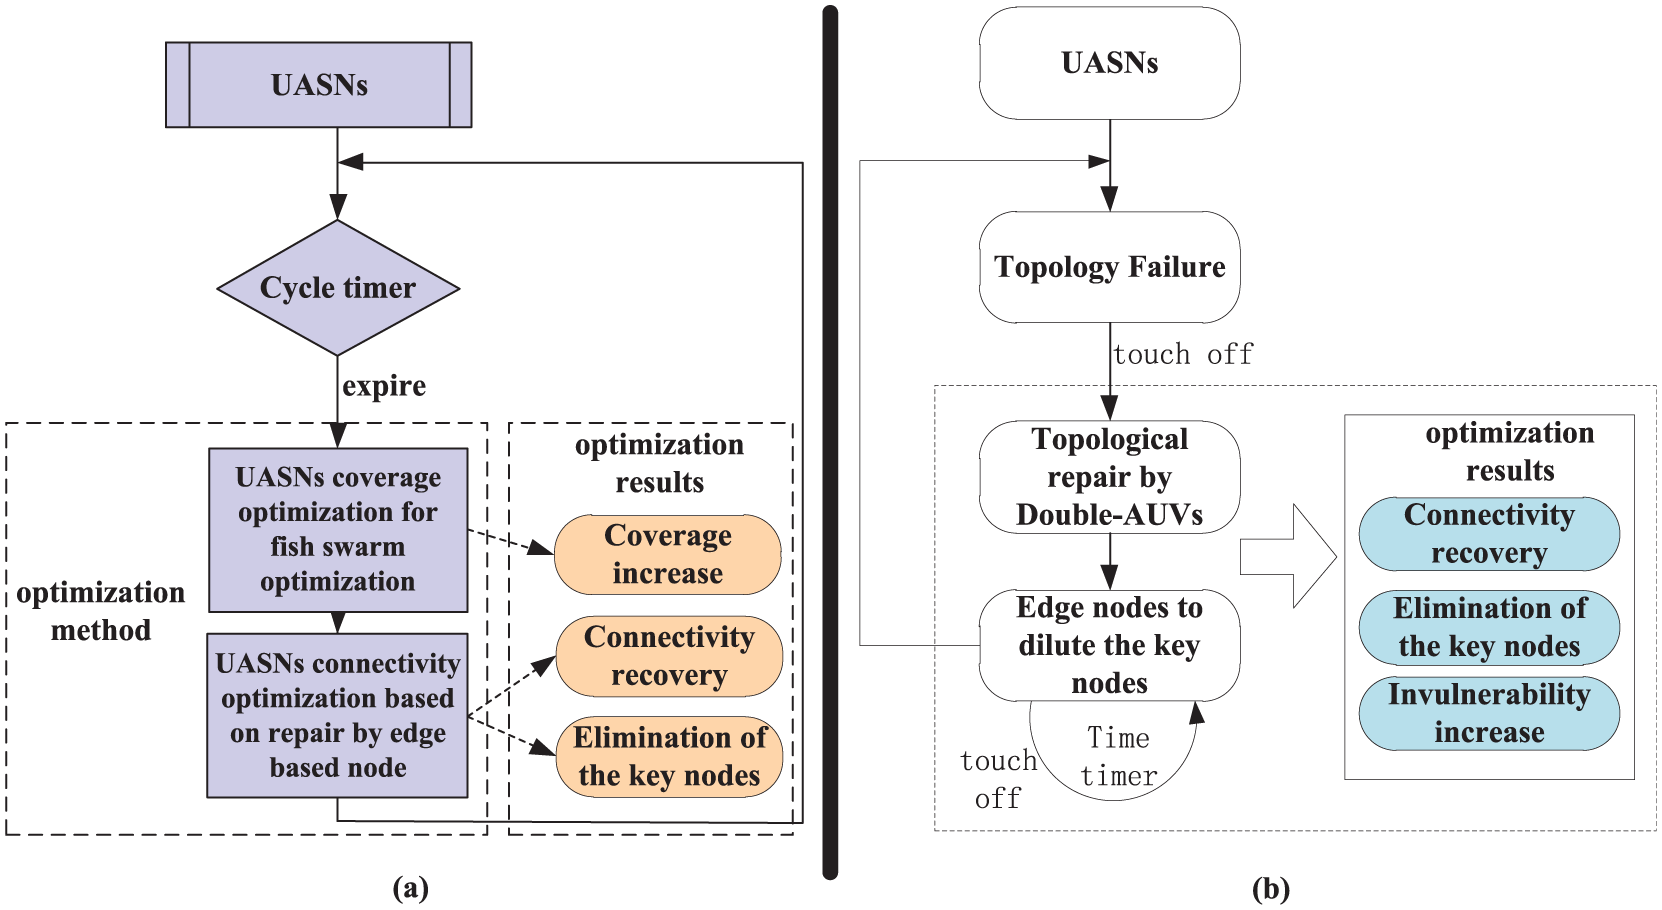
The flowchart of topology optimization.
The TO-A algorithm
Coverage optimization for UASNs inspired by fish swarm
In the process of UASNs coverage optimization inspired by fish swarm, the sensor nodes are treated as artificial fish, events in the target monitoring area are used as food, the process of sensor nodes tending to events is equivalent to the process of artificial fish looking for food, and the sensor node simulates fish foraging, rear-end collision, and clustering behavior in order to complete the adjustment of positions. The perception of artificial fish is greater than its communication range (because the perception of sensor nodes is greater than its communication range), set to


where
The allowable degree of crowding is known as the congestion factor, around a location in the target monitoring area. The congestion factor of the sensor A is expressed as

where the constant
The process of coverage optimization of UASNs inspired by fish swarm is as follows:
Step 1
Step 1.1

where
Step 1.2

If sensor node
Step 1.3

Respectively, the values of


If

If the sensor node
Step 2
Each sensor node in the target area performs the steps mentioned above. After a total of 100 iterations, the process of UASNs coverage optimization is over.
In this process, each node can control itself, in accordance with the rules of the algorithm to get the global optimal value. It requires the step size of each time node to randomly move a size not exceeding its own perceptual range, so as to ensure that any event during the process of foraging operation is not skipped, and when rear-end collision or clustering occurs, there will not be too crowded among sensor nodes.
Connectivity optimization for UASNs based on edge nodes
After coverage optimization for UASNs inspired by fish swarm is completed, though the network coverage has been optimized, there are disconnected positions and key nodes existing in the UASNs. Repair the disconnected position and eliminate the key nodes by edge nodes, so that the connectivity of UASNs can be optimized.
Selection of the repair node
The repair node is selected from edge nodes, which is used to repair the disconnected position and remove the key nodes in the UASNs. The process of the selection of repair node is shown in Figure 5.
1. Initiating the request of repair operation, that is, Request messages

Schematic diagram of the process of repair node selection.
Broadcast the
2. The edge node processes the Request message
Edge node
Edge nodes need to establish the queue of Request messages and set timer of Request message. The queue of the Request messages is constructed with each key node further away from

where
While the timer of the Request message expires, the edge node
3. The key node processes the Response message
The key node takes into account energy, movement distance, and utilization of coverage of the edge node. In this way, it can construct the queue of Response messages and selects a number of edge nodes from the queue to send the Take message to itself.
The key node sets the timer of the Response message after the Request message is sent. If the key node has not received any Response message that is returned by the edge node during a certain period of time measured by the timer, then the key node expands the search range, increases the initial value of hops, and broadcasts the Request message again.
4. The edge node processes the Take message
The timer of the Take message is set at the same time as the edge node sends the Response message. If the edge node has received the Take message during a certain period measured by the timer, the edge node is selected as the node for repairing the key node that has sent the Take message and started the process of moving; when the timer expires and the edge node does not receive the Take message, the next key node from the queue of the Request messages will be selected to send the Response message and the timer of the Take message will be started.
The process of the selection of the repair node for repairing the disconnected position is similar to the above process, but the request of repair (namely the Request message) is initiated by the AUVs that discover the disconnected position and information interaction between the AUVs and edge nodes.
The movement of the repair node oriented by virtual force
In the following description, we define the disconnected position of UASNs and the position of the key node as the target position. When the repair node is selected, the repair node begins to move to the target position. We assume that the nodes will be affected by four kinds of virtual force in the process of moving. They are the gravitation of the target position, repulsion among neighboring nodes, repulsion of obstacles, and random disturbance force.
The target position will generate gravitation based on Hooke’s law for the repair node to attract the repair node to move it; the repulsion will be generated among single-hop neighboring nodes based on Coulomb’s law; in order to avoid a collision during the movement, the obstacle on the movement route of the repair node will generate repulsion based on Coulomb’s law; random disturbance force is used to adjust the operator for avoiding the repair node to fall into motion trap, and it is in the condition of long-term stop or reciprocating motion. Assuming that


where
The resultant force acted by the repair node is expressed by equation (18). When the resultant force is 0 or in the opposite direction of the last resultant force, the node does not move. If it does not move

The movement of the repair node is represented as follows

where
The selection of several important parameters such as
The method for supplying the coverage
Although there is no impact on the connectivity of the network topology, it may lead to individual events unable to be covered and affect the coverage of UASNs. In order to fill up the gaps that may be left after the repair node is removed and ensure the network topology unchanged, the position of original neighbor nodes of the repair node can be fine adjusted by virtual force. In this process, the original neighbor nodes of the repair node are affected by two kinds of virtual force: (1) the gravitation of the original location of the repair node based on Hooke’s law; (2) the force among the neighbor nodes based on Coulomb’s law (whether it is the gravitation or the repulsion depends on the distance among the nodes). Two kinds of virtual force are expressed as equations (20) and (21). If the conditions of


where
The resultant force acted by the original neighbor nodes of the repair node is expressed as follows

The position of nodes in the original neighborhood of the repair node is adjusted under the action of the resultant force, which fills up the gaps caused by removing the repair node to prevent the coverage of UASNs from being lowered.
The TO-DA algorithm
The process of repair
The reasons why we present the TO-DA algorithm for optimizing the topology of the UASNs are as follows:
The underwater acoustic sensor has limited energy and the frequent topology evolution for maintaining the connectivity of the network topology leads to the energy of sensor nodes greatly reduced in complex ocean environment;
The shadow zone still exists in the process of mission execution, and the communication signal attenuation among the underwater acoustic sensors or the signal-to-noise ratio (SNR) is large, which cannot maintain stable/effective communication. This is because the acoustic wave cannot penetrate the shadow zone with much signal distortion.
The number of AUVs is limited because of its expensive cost contrast to the sensor node. Replacing the key nodes with AUVs leads to the weakening of the ability about global monitoring, data acquisition, and so on. Sometimes the implementation of topology reconfiguration is caused by the energy deficiency of individual underwater acoustic sensors or the poor communication caused by suspended matter in sea water.
In the view of the above, we present the TO-DA algorithm. It is the improvement of the TO-A algorithm. Each AUV carries a underwater acoustic sensor. They exchange the information and fix position by a wire. The wire can penetrate shadow zone without much signal distortion. The AUV can clean or charge the sensor that is connected to the AUV for avoiding the frequent topology evolution. When the sensor nodes in the monitoring area are monitored by Double-AUVs, the information about the failure node is also recorded for statistics. If the disconnected node is found, then
On this basis, if Double-AUVs find the disconnected position of the UASNs, proceed as follows:
Case 1: The disconnected node does not belong to set B.
Step 1 According to Hypothesis 1.The node
Step 2 In the
Step 2.1 If
Double-AUV

where
Step 2.2 If
In the

The process of selecting node for reconstruction.
The key node
In the
The edge node
After the edge node
The key node
After the key node
The key node
When the key node
The edge node
After the edge node
Step 3 Use the method mentioned in section “The method for supplying the coverage” to avoid the coverage loss.
Case 2: The disconnected node belongs to set B.
The Double-AUVs can directly repair the connectivity of UASNs.
Step 1 The Double-AUVs just send the information to sensor node
Step 2 When the sensor node
Step 3 When the sensor node
The process of eliminating key nodes
Frequent repairs will decrease the lifetime of the entire network, and lead to gaps in information collection, and so on. In order to improve the performance of UASNs, it is required to first eliminate key nodes after the repair is finished. By Definition 5, after the edge of the node is removed, neither the communication branch is increased, nor new node key nodes is formed. After the optimal node is selected, the information about other sensor nodes in the connected branch can be known by Hypothesis 1. Then, select the nearest edge node from the key node in random and reconstruct the neighborhood topology of the key node through the triangular mechanism.
Eliminating the key node requires three nodes at least due to the stability of the triangular structure and the limited energy of the underwater acoustic sensor. Then, we introduce the concept of triangle mechanism. At least select the nodes in the neighborhood of the key node that can be connected with the key node for establishing a connection (see

The process of eliminating the key nodes: (a) the local topology and (b) the local topology after the key node was eliminated.
After the process mentioned above is finished, the nodes
Experimental study
In this section, we conduct simulation experiments repeatedly to demonstrate the effectiveness and efficiency of the proposed algorithm by the Monte Carlo method. The experimental environment is as follows: there are 50 events required to be monitored, which are unevenly distributed in the
The experimental parameters.

The TO-A algorithm analysis
Compared with the PSO algorithm mentioned by Bhavya and Nithya 13 , we carry on three comparison experiments.
Experiment 1
A comparison experiment about coverage optimization. Figure 8 shows the change curve of the degree of coverage with time gradually after the optimization algorithm is carried out. Solid line represents the effect of TO-A algorithm. Dashed line represents the effect of PSO algorithm. It can be seen that the final value of the coverage after PSO algorithm is less than that of the TO-A algorithm in this article, because the TO-A algorithm inspired by fish swarm in this article is capable of global search so that the global extremum can be realized. But both of them can achieve nearly optimal in the coverage and guarantee the coverage over 95%. We also find PSO algorithm can achieve the optimal in the coverage earlier, because PSO algorithm obtains the value of local optimal quickly. So, the curve can be earlier convergent.

The change of coverage in the optimization process.
Experiment 2
Compare the number of the key node after coverage optimization. The experimental scenario is set as follows: the number of events increased from 50 to 70 and the number of sensors distributed in the UASNs is 20, 25, and 30, respectively. The TO-A algorithm and PSO algorithm are carried out in these three scenarios. We have statistics on experimental times of key nodes exist in the 100th round experiment (see Figure 9). It can be seen that with the increase in the number of events, there is a significant reduction in the number of experiments of the existence of key nodes, because during the execution of the two algorithms, sensors always move toward the place where the density of events is high. The events distributed are more even so that sensors deployed are more even after the events in the sparse area are increased. But the PSO algorithm is easy to fall into local optimum so that the overall result is worse than the TO-A algorithm (inflection point as shown in Figure 9).

The number of experiments that exists the key nodes.
In addition, as shown in Figure 9, when the sensor node is set to 25, the overall effect after the implementation of the algorithm is optimal. The number of sensor nodes is less difficult to uniformly cover the events when the number of events is constant. The number of sensor nodes is increased too much and events are distributed unevenly, leading to sensor nodes deployed unevenly and the key nodes are easily generated.
Experiment 3
A comparison experiment about recovery of the connectivity. First, we verify the optimization of the connectivity by executing the TO-A algorithm proposed in this article. We set the number of events to 50 and the number of sensor nodes to 20. The connectivity of network is repaired by the edge nodes (this method is mentioned in section “Connectivity optimization for UASNs based on edge nodes”). The connectivity of UASNs was recovered in 100 repeated experiments. Figure 10 shows the connectivity recovery curves of 4 experiments were randomly selected from the 100 repeated experiments.

The curve of recovering connectivity that is randomly selected from 100 experiments.
Figure 11 shows the change curve of the experimental results through performing two kinds of algorithms during 500 s.

The change of connectivity through the algorithm: (a) the TO-A algorithm and (b) the PSO algorithm.
As said by Bhavya and Nithya, 13 eight self-moving nodes (the AUVs) were deployed in the above experimental background. When the network is not connected, the self-moving node is used to repair. Figure 11(a) shows clearly, in addition to initializing repair operation that takes nearly 40 s, and others only take 10 s. It is indicated that the PSO algorithm achieves the connectivity of UASNs quickly. But it is easy to generate the disconnected network because in the work by Bhavya and Nithya, 13 the key nodes were not eliminated, which leads to weaken the invulnerability of UASNs. Even the deviation of the location of AUVs nodes that is influenced by ocean currents will occur and leads to the disconnected UASNs and the UASNs need to be repaired again (as it has been shown time in Figure 8(a) around 240 s). Although the TO-A algorithm proposed in this article spends a longer time to initialize the repair operation (the average cost is about 55 s in 100 repeated experiments), the TO-A algorithm will enhance the invulnerability of UASNs through eliminating the key nodes and it is not easy to disconnect the network under the influence of ocean currents and all kinds of biology. Figure 11(b) shows the connectivity of UASNs which was repaired by the TO-A algorithm within 500 s that the experiment starts. In the process of the experiment in 500 s, after the PSO algorithm mentioned by Bhavya and Nithya 13 is carried out, we can calculate the connectivity rate of UASNs is 372/500=74% and the connectivity rate of UASNs after the TO-A algorithm proposed in this article is carried out is 445/500=89%. We can also find a phenomenon that the longer experiment time is, the advantages of the TO-A algorithm more obvious is, so the TO-A algorithm has better scalability.
The TO-DA algorithm analysis
Compare with the PSO algorithm mentioned by Bhavya and Nithya 13 and the fish swarm optimization algorithm mentioned by Pandey and Pompili 14 (called Fish Swarm optimization algorithm [FSO]).
Experiment 1: a comparative experiment about repairing the connectivity
When the failure node occurs in the topology of the network, the number of connected nodes decreases sharply. Figure 12 shows the change of the number of connected nodes with the time after the implementation of three algorithms, which are TO-DA algorithm, the PSO algorithm, and the FSP algorithm, respectively. It can be seen the curve of PSO algorithm is relatively stable, because the PSO algorithm is the local optimum; the curve of FSP algorithm is fluctuated, because large number of sensors were selected to move when the FSP algorithm is executed. After performing the above two algorithms, the number of connected sensor nodes is less than the result from the TO-DA algorithm proposed in section ” The TO-DA algorithm.” We can also see that the start points of three curves in Figure 12 are different, because the method of deployed node is different in three algorithms. During the execution process of TO-DA algorithm, there is a larger changein the number of connected nodes, because the process of repairing node happens always in the implementation of the operation of eliminating the key nodes. In the process of eliminating the key nodes, on one hand, it will speed up the covering of all nodes in UASNs; on the other hand, there will be the inevitable decline in performance of the connectivity of UASNs when the edge node in the mobile, but the time of declining in performance is short. So, we just need a very short period of time to achieve the overall optimization of the repair.

The change of connectivity when disconnected location is restored by the algorithm.
Experiment 2: the analysis of coverage and performance of survivability
Figure 13 is the change of the survivability and the coverage after the algorithm is executed. The left ordinate, solid blue line (representing PSO algorithm (1) in Figure 13) and blue circles line (representing TO-DA algorithm (1) in Figure 13) represent a change of the coverage in PSO optimization algorithm and the TO-DA algorithm over time, respectively; the right ordinate, solid green line (representing PSO algorithm (2) in Figure 13) and green circles line (representing TO-DA algorithm (2) in Figure 13) represent a change of the survivability in PSO optimization algorithm and the TO-DA algorithm over time, respectively. It can be seen in Figure 13 that though the coverage of the UASNs after the TO-DA algorithm is carried out is less than the effect by implementation of the PSO algorithm, the survivability after the TO-DA algorithm is executed is far beyond the effect after the implementation of the PSO algorithm. Through statistical analysis, although at the expense of coverage of approximately 8.5% in the optimization process, survivability performance is improved by about 50%. Because the process of TO-DA algorithm execution is always accompanied with the operation of eliminating the key nodes, which makes the topology change, the coverage is reduced, but the key nodes are eliminated, and the network lifetime is prolonged. This method is more suitable for long-time underwater missions.

The comparison of coverage and survivability.
Experiment 3: the performance analysis of the network after the end of the process of optimization
Figure 14 shows the connectivity and the overall energy consumption of the UASNs during the process of the optimization. In the optimization phase, the line slope of the energy consumption is larger because there are lots of moving nodes. In the whole UASNs network, the energy consumption of the nodes gradually tends to be stable and the growth is stopped at 110 s. This situation indicates the process of the implementation of FSP algorithm is finished. As we can see from Figure 14, the connectivity curve shows an upward trend with time, the curve reaches the peak near the 60 s. There is a clear advantage compared with the FSP algorithm. It reaches the peak at about 43 s, then the curve about TO-DA algorithm drops to 0.9 in a short period of time, then backs to the peak near 85 s and maintain stably, because the implementation of the TO-DA algorithm is finished near the 60 s, and the connectivity of UASNs has been optimized, but during the following processes of eliminating the key nodes, there is inevitable decline in local connectivity. So, the overall connectivity of the network decreased slightly due to the edge nodes leaving its original location; however, the connectivity of UASNs is restored immediately with the completion of eliminating the key nodes. At the same time, as it is seen from Figure 14, when the time is at 120 s and curve of the energy consumption of the topology of UASNs does not leveled off, there is still a small slope. It indicates the energy consumption continues to increase, and the repair process of connectivity of UASNs is still in progress.

The comparison of connectivity and energy consumption.
The above three experiments about TO-DA algorithm are not difficult to be found in the UASNs. As the time passed, the automatic repairing and restructuring of the sensor nodes makes an increase in the density of the sensor nodes. This enables the connectivity among the nodes turn better and the survivability of local topology of network has been improved, but the coverage occurs redundant phenomenon in a certain extent.
Conclusion
In this article, we propose a topology optimization scheme based on reorganization, namely, TO-A algorithm that maintains connectivity and coverage, and a topology optimization mechanism based on Double-AUVs, namely, TO-DA algorithm that prolongs the life cycle and connectivity of UASNs. To be more specific, the TO-A algorithm’s purpose is to address the problem about topology affected by ocean currents and other environmental factors that leads to the dynamic evolution of network and generates gradual reduction in the performance of UASNs; the TO-A algorithm not only adjusts the location of sensor nodes by simulating the fish swarm behavior so as to optimize the coverage, but also uses the edge nodes to repair the disconnected position in the UASNs so as to eliminate the key nodes and optimize the connectivity. Although the TO-A algorithm presented above, compared with other algorithms can effectively improve the connectivity of the network and optimize the coverage with lower energy consumption, the TO-DA algorithm is a further research for executing the underwater long-term missions. We redefine the Double-AUVs and propose the TO-DA algorithm. The TO-DA algorithm not only repairs the failed node by Double-AUVs, but also takes into account the frequent topology repair, which leads to a reduction in the lifetime of the network. So, after the repair is completed, the algorithm begins to carry out the operation that eliminates the key nodes, which will improve regeneration and survivability of UASNs in uncertain ocean environment.
The simulation results, respectively, demonstrate the performance of UASNs after the algorithms are executed; all the algorithms can restore the connectivity of UASNs, but the TO-A algorithm is more efficient in coverage, and the TO-DA algorithm is more efficient in survivability. The TO-A algorithm can guarantee the network coverage is maintained at about 97%, connectivity rate above 89% with lower energy consumption and the TO-DA algorithm can improve survivability of the network effectively above 50% with lose of 8.5% of the network coverage.
Research results have certain contributions to the research of topology of UASNs and have extensive application value.
In the near future, on one hand, we plan to make reasonable assumptions about the AUVs own energy, control threshold value of AUVs’ energy, and further ensure the efficiency of the network, because the energy of AUVs is infinite in the hypothesis of this article; on the other hand, the uncertainty factors that affect the performance of UASNs also include the dynamic nature of the boundary of different temperature water layers, the mesoscale vortex, and other factors such as human factor; so, we will consider these factors in the follow-up study.