
Abstract
Keywords
Introduction
The Internet of things (IoT) 1 is opening up opportunities to build smart cities in which traffic congestion, parking, street lighting, waste, irrigation, and urban noise are monitored in real time and managed more effectively. Wireless sensor networks (WSNs) provide the eyes and ears of the IoT, bridging the real world and the digital world. This has led to considerable investment and research in WSNs, which are essentially distributed network systems comprising a large number of sensor nodes interconnected wirelessly. WSNs can be used in a variety of applications, such as environmental monitoring, military surveillance, medical monitoring, and object tracking. 2 However, all of these applications require positioning information.
Indoor location-based services (LBSs) are expanding rapidly. 3 The global positioning system (GPS) is widely used outdoors; 4 however, it does not perform well indoors, due to the blocking of radio waves by structures. Furthermore, indoor environments are prone to interference from moving bodies, multi-path effects, and shadowing. This has necessitated the development of positioning systems specific to indoor environments.5,6
Most indoor positioning systems employ multiple independent, decentralized sensors in the form of a WSN, using the received signal strength indicator (RSSI) as the basis for positioning.7–9 Most existing RSSI-based positioning systems use scene analysis for positioning, wherein the environment is divided into several zones and an RSSI database is established for each zone. The current RSSI value at an unknown location is compared with those stored in the database, and the pattern that most closely matches the user’s pattern is returned as an estimate of the user’s location. The number of zones determines the amount of time required to build the database as well as the degree of complexity involved in matching. The zone approach does not provide high positioning resolution.
In this study, we developed a novel two-stage indoor positioning scheme. The first stage involves scene analysis designed specifically for small-scale indoor environments based on a signal propagation channel model constructed in advance. RSSI data from reference nodes is distributed according to power level and the monitored space is split into zones. A fuzzy inference system (FIS) algorithm is used to improve the accuracy of zone localization and sharpen zone-positioning estimates. RSSI data from the reference nodes are used as inputs to determine the location of the target node based on fuzzy rules. The proposed positioning system is able to determine locations without the need for training. Furthermore, unlike existing systems based on fingerprinting algorithms, the proposed system does not require numerous measurement points for the construction of a radio map.10,11
Positioning resolution is further enhanced in the second stage. Coordinate positioning is performed according to the position of zones determined in the first stage using an adaptive trilateral positioning technique. We also developed an expansion scheme to enable the application of the proposed two-stage positioning method to large-area environments without sacrificing positioning resolution. This is achieved by extending the original rectangular area to form a larger rectangular area, using a few simple estimates to maintain positioning resolution.
The remainder of this article is organized as follows. Section “Related works” describes some related works. Section “Zone-positioning” details the FIS applied to zone-based location as well as various zone-splitting methods for first-stage localization. Section “Coordinate positioning” describes coordinate positioning in the second stage. Section “Extended positioning” outlines the extended positioning method. Section “Simulation results and analysis” provides simulation results and discusses the performance of the positioning system in a variety of situations. Conclusions are drawn in section “Conclusion.”
Related works
The techniques commonly used to calculate positions within an enclosed space are classified according to the sensor technology they employ: time of arrival (ToA), time difference of arrival (TDoA), angle of arrival (AoA), and RSSI. Unlike the first three methods, RSSI is output by most off-the-shelf sensor nodes, leading to its wide-scale application in localization systems. Fingerprinting is the most effective solution for RSSI-based indoor location sensing. Fingerprinting is generally divided into two phases: training and online positioning. 12 A variety of location-detection algorithms have been developed, including probabilistic methods, deterministic methods, and neural networks. K-Nearest Neighbors (KNN) is the most popular RSS-based location-fingerprinting approach used to determine indoor locations. 13 The methods presented in the above-mentioned studies provide adequate estimation accuracy; however, they require considerable quantities of training data. Furthermore, computational overhead is high and distance-based learning lacks specificity.
Fuzzy logic (FL) is widely used in inference systems to imitate human behavior and make decisions. These systems are referred to as FISs (fuzzy inference systems). 14 FIS has been used to improve accuracy in WSN localization. Chenji and Stoleru 15 proposed an FL-based approach to mobile node localization in sparse networks with few available anchors. In that study, FIS provided a 24%–40% improvement in localization accuracy. In Abdelhadi and Anan, 16 a fuzzy system for collaborative feedback communication in WSNs reduced error in localization estimates to less than 5%. In this study, we employed an FIS with a triangular membership function for input (RSSI) and output (zone) to improve the accuracy of zone localization.
Most indoor localization methods are based on a signal propagation model in which distance is estimated using RSSI data. Most authors have adopted the log-distance path loss model for the calculation of distance.17,18 Achieving a realistic simulation environment requires that we take into account the effects of shadowing, path loss, multipath effects, noise, and interference. Thus, we use the equation of the log-distance path loss model as follows

where
Channel model simulation parameters.

Zone-positioning
The first stage of the proposed method involves zone-positioning. In the following, we discuss three zone-splitting methods: traditional triangular splitting, fuzzy triangular splitting, and fuzzy rectangular splitting. We adopted the FIS to enhance the efficiency of zone-positioning.
Trianglar splitting
Figure 1 illustrates the proposed triangular splitting method in which the simulation area is divided into four triangular zones of equal size. The position of the reference nodes can greatly affect the accuracy of positioning, particularly indoors. Locating reference nodes in four corners (as a square) can improve positioning accuracy. 19 However, it is not always possible to distinguish the four triangular zones when the reference nodes are located in four corners. We therefore included an additional reference node in the center of the square by which to assess the zones. After sorting the RSSI values from the five reference nodes from large to small, we select the three strongest for zone-positioning. Large-area zones permit only low-resolution positioning, whereas dividing the space into a larger number of zones increases RSSI instability at zone boundaries.

Triangular zone-splitting method.
Fuzzy triangular splitting method
The triangular splitting method produces large zones with limited accuracy. In Figure 2, the number of zones was increased to eight. The shape of the zones is non-uniform; therefore, fuzzy inference15,16,20 was used to improve positioning accuracy.

Fuzzy triangular splitting method.
Fuzzy rectangular splitting method
Existing fuzzy triangular splitting methods have been shown to improve localization precision; however, improvements are still required with regard to zone identification, due to the fact that the central node covers four zones. Thus, we re-divide the indoor environment into nine zones, as shown in Figure 3. This splitting method reduces uncertainty in the central area while enhancing the resolution of zone-based positioning.

Fuzzy rectangular splitting method.
Fuzzy inference
The FIS used in this article provides an alternative approach to zone identification. The fuzziness of RSSI values is represented in the membership function. Inference based on fuzzy rules brings the process of estimation in line with human thinking patterns. Figure 4 presents a flow chart of zone-positioning in conjunction with fuzzy inference.

Flowchart of zone-positioning in conjunction with fuzzy inference.
In our FIS, the RSSI value of the target and five reference nodes are used as input parameters. The RSSI value is converted into a membership function between 0 and 1 using fuzzification and mapped to an input fuzzy set, which is defined according to the power level of the RSSI value. RSSI power levels from the corner reference node (A) and central reference node (E) are, respectively, presented in Figures 5 and 6.

RSSI power level at reference node A.

RSSI power level at reference node E.
In the fuzzy set of input parameters, we selected a triangle as the shape of the membership function due to its low complexity (i.e. enabling rapid computation). The number of membership functions is determined by the input RSSI power levels, which are defined as six fuzzy sets (L1, L2, L3, L4, L5, and L6), as shown in Table 2. Figure 7 presents the fuzzy set of input parameters for the RSSI value of reference node A. Since the RSSI value in S6 and S7 is similar, we placed these two power levels in the same fuzzy set (L6). Reference nodes A, B, C, D are in the four corners of the indoor space range; therefore, the fuzzy sets of these four reference nodes are identical. Figure 8 presents the fuzzy set of input parameters for the RSSI value of central reference node E.
Fuzzy membership function for RSSI power level.

RSSI: received signal strength indicator.

RSSI fuzzy set of reference node A.

RSSI fuzzy set of reference node E.
In this article, we based the number of fuzzy sets in the output parameters on the total number of zones. From Figures 2 and 3, fuzzy triangular splitting resulted in eight zones, whereas fuzzy rectangular splitting resulted in nine zones. Figures 9 and 10 present the fuzzy sets of output zone positions obtained using fuzzy triangular splitting and fuzzy rectangular splitting, respectively.

Fuzzy set of output zone positions obtained using fuzzy triangular splitting.

Fuzzy set of output zone positions obtained using fuzzy rectangular splitting.
In the following, we summarize the structure of the FIS used to identify the zone in which the target is located:
Fuzzifier: triangular membership function;
Fuzzy Inference Rule: Mamdani fuzzy rules;
Fuzzy Inference Engine: max–min operation;
Defuzzifiction: center of gravity.
Simulation results are presented in section “Simulation results and analysis.”
Coordinate positioning
In the following, we describe the coordinate positioning method used in the second phase, which involves selecting reference points for trilateration based on the results of zone-positioning in the first phase in order to improve positioning accuracy.
Distance measurement using linear interpolation
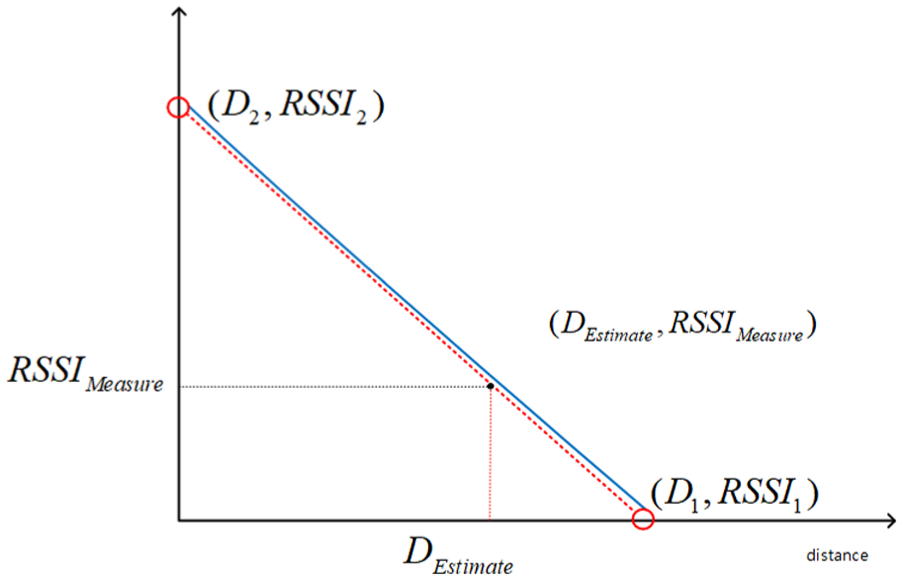
Trilateration is a method used to identify the absolute or relative location of a point through the measurement of distances based on the geometry of circles, spheres, or triangles. Thus, the accuracy of the initial distance information is important. Most previous methods use RSSI values to perform range finding.21–23 The computational complexity of distance calculation can be reduced by translating curves in the nonlinear channel model into linear equations through linear interpolation, as shown in Figures 11 and 12.

Schematic illustration showing channel model.
Distance measuring based on linear interpolation.
In Figure 11, the blue curve represents the original channel model, and the red dots indicate RSSI values measured every 0.5 m. The curve in the channel model indicates that an increase in distance reduces the slope of the curve, particularly at distances exceeding 3 m. This leads to a drop in resolution, which reduces positioning accuracy. Thus, we sought to keep the range of the indoor channel model to within 3 m.
We define an RSSI value as a set of right-angled triangles based on its corresponding known distance, as shown in Figure 12. The bevel (red segment) connected to the right triangle in each segment is a simplified channel model, each of which represents a set of linear equations. The concept of linear interpolation is to utilize the slope (m) between two arbitrary points on the same line. We use equation (2) to represent the relationship, as follows

Equation (3) can be obtained by rearranging equation (2) as follows

where
Adaptive trilateral positioning
Trilateration is based on the distance between the three reference points and the target point, wherein equations are derived for the three circles. The position of the target point is obtained by solving these equations.24,25 However, in practical applications, distance estimates are prone to error, such that the three circles fail to intersect at a point, that is, a solution cannot be derived for the three equations. In this article, we sought to overcome location error in trilateral positioning by developing an adaptive approach using the relative position of any two circles.
Three circles intersecting within a common area
First, we find the intersection points of any two circles and identify the intersection point closest to the center of the other circle, which results in three intersection points (red points in Figure 13). We then draw a triangle using these points. Finally, we estimate the coordinates of the target point (centroid of the triangle, as represented by black dot in Figure 13).

Three circles intersecting within a common area.
Two circles intersecting within a circle
First, we find the intersection points of two circles (e.g. A&C, C&B), and then we identify the two intersection points closest to the separate circles (A&B: red dots). We then calculate the center of the mass (black dot), which gives us the coordinates of the target point, as shown in Figure 14.

Two circles intersecting in a circle.
Two circles intersecting with one separate circle
We use the intersection of two intersecting circles to calculate the centroid points. We then assign a weighting value between the centroid point and the center of the separate circle to obtain the coordinates of the target node, as shown in Figure 15. This situation commonly occurs when the target node is closer to the location of reference node A. In this situation, we would, respectively, use equations (4) and (5) for weighting1 and weighting2


Two intersecting circles with a separate circle.
Selection mechanism used for multi-set positioning reference points
The precision of distance values and reference point coordinates are crucial to the effectiveness of trilateration. In this article, we use the results obtained in the first stage to identify the zone of the target node, which is then used as the basis location for selection of a combination of reference nodes. Zone selection affects the choice of reference points as well as the positioning results. Selecting only a single-set reference point can lead to the selection of an erroneous combination of reference points, which can increase positioning error. Thus, we developed a mechanism for the selection of multi-set positioning reference points, using a combination of multi-trilateration methods. Figures 16–18 present a schematic illustration of the process in which a combination of reference nodes is selected in the second positioning stage using rectangular zone splitting in conjunction with fuzzy inference.

Reference node selection method: Zone2.

Reference node selection method: Zone1.

Reference node selection method: Zone5.
In Figure 16, under the assumption that the target point is in
In Figure 17, under the assumption that the target point is in
In Figure 18, we assume that the target node is in
We divide the square average into four small triangular blocks under the assumption that the estimated distance to reference node A is less than the estimated distance to reference node D, and further that the estimated distance to reference node B is less than the estimated distance to reference node C. Under these conditions, the target node would be toward the lower side, such that triangle
Figures 19 and 20 present schematic illustrations showing the selection of reference nodes in the second stage of triangular zone splitting in conjunction with fuzzy inference.

Reference node selection method: Zone1–Zone4.

Reference node selection method: Zone5–Zone8.
In Figure 19, we assume that the target node is in
In Figure 20, we assume that the target node is in
When the estimated distance to reference node B exceeds that of reference node C, then we can be sure that the target node is toward the top-left. We therefore select triangle
Extended positioning
Limitations in the channel model restrict the proposed two-stage fuzzy inference positioning method to a range of 3 m × 3 m.
We therefore developed an extended positioning method to overcome this limitation. If we consider a 3 m2 area as a unit map, the two-stage positioning method can apply in each unit map. We treat a 3 m × 3 m area as a small-scale map and then extend/combine it to create a large-scale 6 m × 6 m area containing 13 reference nodes for positioning. This large-scale area is divided into five small-scale positioning maps (3 m × 3 m), as shown in Figure 21.

Expanded positioning environment.
In the resulting large indoor space, positioning can be divided into two steps. The first step involves identifying the small-scale map in which the target node resides. In the second step, we use the five reference nodes in that particular map as a benchmark for two-stage fuzzy inference positioning. This makes it possible to enlarge the positioning range to match the actual dimensions of the indoor space while maintaining the original resolution.
The first step involves using the RSSI determination of the reference node in Table 3 to identify the correct positioning map. We begin by comparing the RSSI values of reference nodes
Unit map detection.

RSSI: received signal strength indicator.
For example, the situation where
We can then use the RSSI values of
In the situation where
Table 3 lists the decision rules of the RSSI values for the five unit maps. We could use the decision rules to determine which map should be used further. When using the extended positioning method, the unit map of the target node is selected in the first step. This map is then used to perform two-stage fuzzy inference positioning. This approach makes it possible to extend the range of detection while maintaining high positioning resolution.
Simulation results and analysis
In this section, we present the results of simulations using the proposed indoor positioning system. The simulations were conducted using several custom functions as well as standard functions of MATLAB®. We implemented the proposed channel model using RSSI values simulated by a mathematical model. Gaussian random variables
Efficiency analysis: first-stage zone-positioning
We began by investigating the effects of the standard deviation parameter in the first stage of zone-positioning. We randomly deployed 100 sampling points throughout the indoor environment. Figures 22–24 present the results indicating the percentage of correct positioning using the three splitting methods with four standard deviation values. The percentage of correct estimates is calculated as follows (6)

where

Percentage of correct zone-positioning estimates obtained using triangular splitting with various standard deviation values.

Percentage of correct zone-positioning estimates obtained using fuzzy triangular splitting with various standard deviation values.

Percentage of correct zone-positioning estimates obtained using fuzzy rectangular splitting with various standard deviation values.
Figure 25 and Table 4 compare the percentage of correct zone estimations obtained using the three methods when positioning sampling points = 255. These results indicate that regardless of the splitting method, the percentage of correct zone estimates decreased with an increase in standard deviation. Rectangular zone splitting in conjunction with fuzzy inference achieved correct zone estimates of approximately 73%–82%, while triangular zone splitting in conjunction with fuzzy inference achieved correct zone estimates of approximately 46%–53%. Conventional triangular zone splitting achieved correct zone estimates of 83%–95%, due to the smaller number of zones (i.e. fewer chances to be wrong).

Comparison of percentage of correct zone-positioning estimates using three splitting methods with four levels of standard deviation.
Comparison of percentage of correct zone-positioning estimates using three splitting methods.

In the above simulations, the three splitting methods did not generate the same number of splitting areas or areas of the same size. Thus, it is not fair to calculate the percentage of correct zone-positioning estimates from the results in Table 4. Nonetheless, we can see that the rectangular splitting method in conjunction with fuzzy inference generated a larger number of splitting zones as well as a higher percentage of correct zone-positioning estimates.
Equation (7) was used to calculate the improvement provided by the fuzzy triangular splitting method over the fuzzy rectangular splitting method

where
As shown in Tables 4 and 5, fuzzy rectangular splitting outperformed fuzzy triangular splitting by 53.8%–58.7%. Thus, it would be reasonable to expect that the selection of fuzzy rectangular splitting for first-stage processing would achieve superior results with regard to zone localization.
Improvements afforded by fuzzy rectangular zone splitting compared to fuzzy triangular splitting.

In the previous simulation, we examined two zone-splitting methods based on fuzzy inference. In an indoor environment, fuzzy rectangular splitting results in higher resolution and superior positioning performance. The above results were averaged from all of the regions; however, we also investigated the performance of these methods in specific regions. This was achieved by deploying 50 sampling points in each zone (to ensure a sufficient number of samples), and then applying the rectangular splitting method with fuzzy inference with the aim of identifying zones in which positioning performance was not up to par. Figure 26 presents the average positioning performance in each zone.

Positioning performance of fuzzy rectangular splitting method in nine specific zones.
As shown in Figure 26, in the case of
Analysis of coordinate positioning in second stage
In the following, we analyze coordinate positioning performance in the second stage. We begin by using the linear interpolation distance measuring method to reduce the complexity of the curve channel model. Table 6 lists the parameter setting used in linear interpolation. Table 7 presents a comparison of mean error and standard deviation imposed by the linear interpolation distance measuring method under four levels of standard deviation.
Parameter settings used in linear interpolation.

RSSI: received signal strength indicator.
Linear interpolation ranging and actual distance mean error and standard error.

In Table 7, the observed mean error induced by linear interpolation within a distance of 3 m was 2–4 cm under four levels of standard deviation, whereas the standard error was controlled to within 2 cm. These results demonstrate the efficacy of the proposed linear interpolation method in reducing computational complexity and converting RSSI values into distance values.
In the following, we discuss the performance of the proposed adaptive trilateral positioning method (second stage) under four levels of standard deviation.
For the sake of consistency and completeness, we employed data compiled in this study to evaluate the proposed fuzzy splitting method and KNN-based localization. The KNN method is based on comparative searches of fingerprint profiles aimed at selecting the
Simulations were conducted using various zone-splitting methods to determine the mean error and standard error in the coordinate positions of 225 randomly selected sampling points.
We began by defining the error of the


where
The standard error in the

Trilateral positioning allows for the selection of single-set or multi-set positioning methods. Tables 8 and 9 present a comparison of these methods.
Mean error in coordinate positioning under four levels of standard deviation.

KNN: K-Nearest Neighbors.
Comparison of standard error in coordinate positioning under four levels of standard deviation.

KNN: K-Nearest Neighbors.
Simulation results demonstrate that the proposed scheme outperforms the non-fuzzy positioning-based algorithms followed by the KNN-based and then by the traditional triangular splitting method. The results in Tables 8 and 9 show that fuzzy rectangular splitting outperformed the other methods, regardless of whether it was implemented in a single set or multiple sets. Multiple-set implementations of fuzzy rectangular as well as fuzzy triangular splitting exceeded their single-set counterparts. In the case of
Single-set implementations of all three zone-splitting methods resulted in average error exceeding 30 cm as well as a significant increase in the standard deviation, compared to trilateral positioning in multiple sets. We can also see that the mean error of the two methods combined with FIS has better performance than that of the traditional triangular splitting method in the second stage. The mean error and standard deviation imposed by two-stage fuzzy rectangular splitting were lower than those of two-stage triangular splitting. Our simulation results indicate that coordinate positioning would be optimized by selecting fuzzy rectangular splitting for the first stage and adaptive trilateral positioning for the second stage.
Extended positioning
In the following, we describe the extension of a 3 m2 area into a 6 m2 area with 13 reference nodes and five maps, as shown in Figure 21.
First, we determine which unit map should be used. Two-stage fuzzy rectangular splitting is applied to each map and 50 sampling points were deployed in each zone.
As shown in Figure 27, if a target node is within a non-overlapping area, the percentage of correct estimations approaches 100%. As shown in Figure 28, if the target node lies in an overlapping area, map selection becomes important. Differences in the relative position of zones in different maps of the same location produce differences in the positioning error, which can be used for two-stage positioning. Thus, we focused on areas of topological overlap in our analysis of positioning performance within different maps.

Topological distribution of non-overlapping areas.

Topological distribution of overlapping areas.
We used the channel model with

Positions of sampling points in overlapping range.
Positioning results from first overlapping zone.

Positioning results from second overlapping zone.

Positioning results from third overlapping zone.

Positioning results from fourth overlapping zone.

Positioning results from fifth overlapping zone.

Positioning results from sixth overlapping zone.

Positioning results from seventh overlapping zone.

Positioning results from eighth overlapping zone.

In the simulation results presented in Tables 10 to 17, the map of sampling points marked in color was obtained using the proposed method. The fact that positioning performance is highest in overlapping areas demonstrates the efficacy of the proposed unit map. According to the above data results, we mark in accordance with the color of the suitable positioning map for each sampling point, as shown in Figure 30.

Optimal positioning of maps in overlapping area.
As shown in the figure, if the sample point is within 1 m from the central reference node, then we can select central map Y for two-stage positioning to improve positioning accuracy. Otherwise, a neighboring map could be selected to improve positioning performance. Such cases are termed “single topological preferred positioning.”
According to Tables 11, 13, 14, and 16, eight sampling points are marked using black triangles in Figure 30. The difference in mean error between two neighboring maps is no more than 2 cm, and the difference in standard deviation error is no more than 3 cm. Therefore, the location of these eight sampling points can be selected from one of the two neighboring maps. We achieved 100% correct positioning in non-overlapping areas. This method can be applied to large indoor areas while enabling the selection of the best map for two-stage positioning and retaining the advantages of high positioning resolution.
Conclusion
This article analyzes the performance of two-stage (coarse/fine) indoor WSN positioning schemes using a variety of zone-splitting methods in conjunction with fuzzy inference. The RSSI between the reference node and target node is used to estimate the zone without the need for additional expensive hardware. The proposed method is fast and does not require training or a large number of measurement points for the formulation of a database. In the first stage, we use zone splitting to estimate the position of a target node within a zone. We employed fuzzy rectangular splitting as well as fuzzy triangular splitting to enhance the accuracy of zone-positioning within an indoor environment. Simulation results demonstrate that fuzzy rectangular splitting outperforms fuzzy triangular splitting in zone-positioning estimates in a variety of indoor environments.
As long as the zone containing the target is correctly identified, advanced trilateration can be used to achieve the goal of two-stage indoor location. In the second stage of localization, a combination of reference nodes is used to formulate a triangulation algorithm based on the position of the zone identified in the first stage. If the zone identified in the first stage is correct, then the selection of a reference node combination can enhance positioning accuracy. If the zone identified in the first stage is incorrect, then the selection mechanism can opt for an alternative combination of reference nodes to reduce positioning error.
We also developed an extended positioning scheme to expand the applicability of this approach from the original rectangular area (3 m × 3 m) to a large rectangular area (6 m × 6 m). The proposed scheme identified the best rectangular map for implementation using a two-stage positioning method. The selection of an appropriate map also helps to retain high positioning resolution, even within an expanded environment.
In the future, we hope to apply the indoor positioning method proposed in this article to indoor environments of various sizes, from small homes to large indoor shopping malls.