
Abstract
Keywords
Introduction
Tunnel safety is one of the most important issues in tunnel construction. To ensure safe tunnel construction, tunnel safety management systems need to be improved. Therefore, to ensure real-time management of on-site personnel and efficient post-disaster rescue, tunnel personnel positioning systems with high positioning accuracy and low costs need to be enhanced.
At present, the most common tunnel personnel positioning technologies are infrared positioning technologies, ultrasonic positioning technologies, Wi-Fi positioning technologies, RFID (radio-frequency identification) positioning technologies, Bluetooth positioning technologies, ZigBee positioning technologies, and UWB (ultra-wideband) positioning technologies.1–3 While ultrasonic and infrared positioning methods are low in cost and high in precision, they are not suitable for tunnel environments because they usually only provide proximity detection and are susceptible to obstacles between the transmitter and the receiver. Similarly, because Bluetooth positioning technology has short communication distances (usually 5–10 m), a large number of reference nodes need to be arranged to improve the positioning accuracy of the positioning system. Although the UWB positioning technology has a higher range accuracy, it has a small data transmission rate.4,5 Since the RFID positioning technology has poor distance resolution and inaccurate positioning, it can only judge whether a person is located between two card readers. 6 Meanwhile the RFID positioning technology is also vulnerable to narrowband interference, and has low security. 7 As the positioning nodes and base stations in Wi-Fi positioning technology have high energy consumption and are susceptible to interference, it is rarely used for tunnel positioning. Compared with the above positioning methods, the ZigBee positioning technology has been more widely used for tunnels because it has low power consumption, low costs, and high stability. 8
When a wireless positioning network is used for actual personnel positioning, the positioning accuracy is inevitably reduced because of the influences of multiple paths, reflection, and attenuation of the wireless signals transmitted by the nodes. 9 Therefore, to obtain more accurate personnel position information, several personnel positioning methods are proposed. The most common positioning methods are divided into two main categories: range-free methods, such as centroid algorithms, DV-Hop algorithms, APIT algorithms, and convex programming algorithms10–13 and range-based methods, such as time of arrival (TOA), time difference of arrival (TDOA), angle of arrival (AOA), and received signal strength indicators (RSSIs).14–17 While range-free methods do not require sophisticated hardware, their positioning accuracy is lower than the range-based methods, 18 and when factoring in the particularity of the tunnel environments, the range-based method is more suitable for tunnel personnel positioning systems. Of the range-based positioning methods, the AOA positioning method requires a special sophisticated transceiver antenna, and the TOA and TDOA, while simple, require strict time synchronization.19,20
However, as most nodes in wireless positioning networks both transmit and receive signals, and as the RSSI value can be measured without the need for additional hardware costs, 21 RSSI-based positioning methods can significantly reduce system costs and are more suitable for tunnel personnel positioning. Because of these benefits, a lot of significant researches have been done on RSSI-based positioning algorithms to improve the accuracy of the algorithms. These studies focus on improving ranging accuracy and innovating positioning algorithms; the details of references are shown in Table 1.
Reference review.
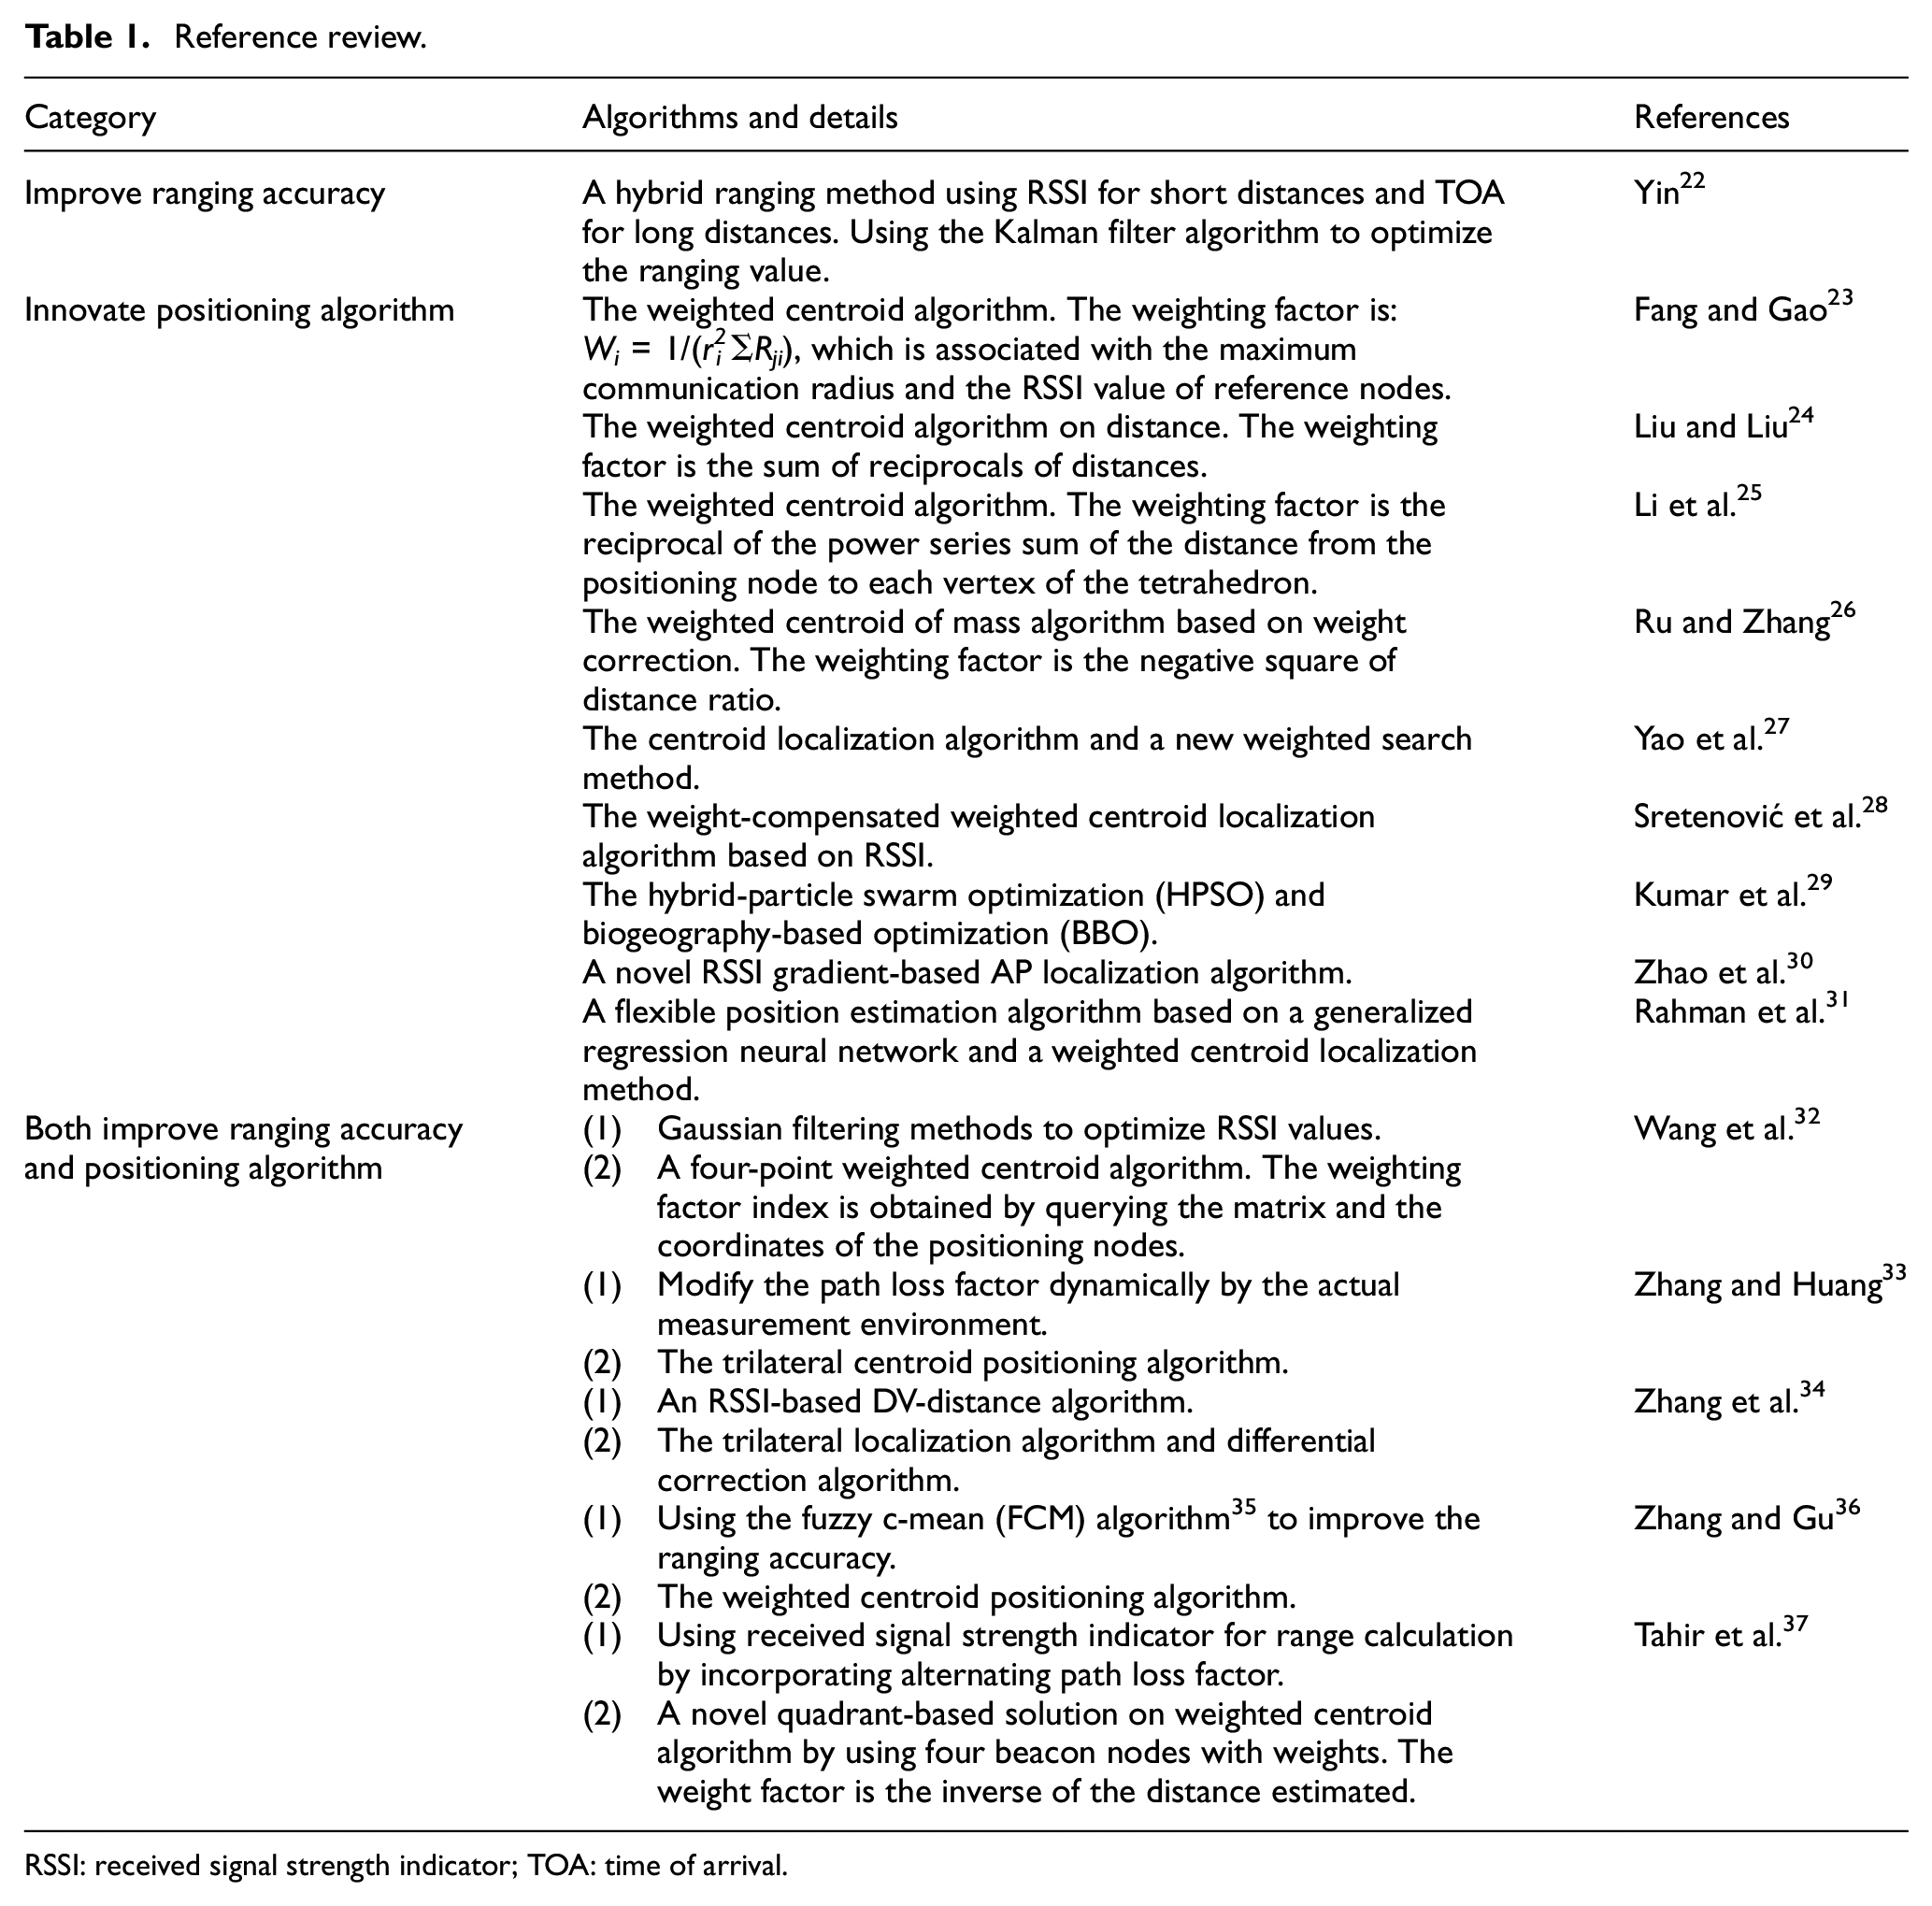
RSSI: received signal strength indicator; TOA: time of arrival.
Based on the above research, this article proposes a two-step hybrid algorithm to improve the location accuracy. First, a Gaussian model is employed to optimize the RSSI value and improve the ranging accuracy. Then, to address the RSSI-based trilateration method problem, a quadratic weighted centroid is used to position the unknown positioning nodes to reduce positioning errors.
The remainder of this article is organized as follows. The RSSI-based ranging model and trilateral measurement positioning algorithm are introduced in Section “Ranging and positioning methods.” Section “Quadratic weighted centroid algorithm” proposes the quadratic weighted centroid algorithm; Section “Simulation and analysis” simulates the proposed quadratic weighted centroid algorithm and verifies the superiority of its positioning accuracy by comparing it with several other algorithms; Section “Reference node layout optimization” simulates the positioning errors for different reference node layout modes and proposes a scheme to reduce the cost of the positioning system; and conclusions are given in Section “Conclusion.”
Ranging and positioning methods
RSSI-based ranging method
When a wireless signal is transmitted between the transmitting node (reference node in practical applications) and the receiving node (positioning node in practical applications), its intensity decreases as the transmission distance increases. Therefore, in practical applications, if the RSSI value of the receiving node is measured when it is received from the transmitting node, the range can be calculated using a logarithmic distance path loss model, 38 as shown in formula (1)

where

and the distance between the unknown receiving node and the transmitting node can be expressed as

Trilateral measurement positioning method
Trilateral measurement positioning is a positioning method based on ranging. Specifically, the distance between the unknown positioning nodes and three reference nodes is obtained using a ranging algorithm, and the equations established from the distance formula are then used to solve the positioning node coordinates. As referred to in Section “RSSI-based ranging method,” the distance can be determined by measuring the RSSI value in the wireless position network, from which the position of the unknown positioning nodes can be identified by combining the RSSI value with the trilateral measurement positioning method. However, in practical applications, as it is often not possible to obtain accurate RSSI values due to the field environment (such as obstacles, multiple paths effects, etc.), there are errors in the distance between the nodes obtained using the RSSI value. For example, it is difficult to apply the positioning calculation to identify the specific point where the three circles intersect in Figure 1 as more commonly, as illustrated in Figure 2, the area at which the three circles intersect is given as the position of the unknown positioning nodes. Therefore, if the RSSI-based trilateral measurement positioning method is to be used for positioning calculations, the accuracy needs to be improved.

Theoretical trilateral measurement positioning method.

Actual trilateral measurement positioning method.
To resolve some of the trilateral measurement positioning method problems, this article improves the traditional algorithm by (1) optimizing the RSSI ranging value, (2) introducing a centroid algorithm into the trilateral measurement positioning, and (3) introducing a weighting factor to improve the positioning accuracy of the trilateral measurement centroid positioning algorithm.
Quadratic weighted centroid algorithm
RSSI value optimization
In actual measurement processes, the positioning node is able to receive multiple RSSI values from a reference node in the same position. However, because of the influence of environmental factors, the RSSI values fluctuate across a relatively wide range, making it difficult to accurately determine the distance; therefore, the received RSSI value needs to be data processed.
Since there is a Gaussian random variable ξ in the logarithmic distance path loss model described in formula (1), the multiple RSSI values measured at the same position can be considered to follow a normal distribution and a Gaussian model can be used to optimize the RSSI value. The probability density function of the Gaussian model is described as follows

where
When the positioning node receives


According to practical experience, the confidence interval that the confidence level of
Quadratic weighted centroid algorithm
As discussed in Section “Trilateral measurement positioning method,” when actually positioning using the trilateral measurement positioning method, the three circles intersect in an area rather than at one point. To resolve this problem, a trilateral centroid positioning algorithm is constructed based on the centroid algorithm. In Figure 3, points A, B, and C are the reference nodes in the positioning system with the coordinates being (

Trilateral centroid localization algorithm.
The coordinates for points D, E, and F are then set at (

Similarly, the coordinates for points E and F are determined; therefore, the coordinates for the centroid point M of the triangle DEF are as follows

To further improve the positioning accuracy, this article introduces a weighted factor to solve the centroid coordinates to reflect the leading roles of the different reference nodes in the positioning nodes; therefore, the weighted centroid coordinates for

As the above weighted centroid algorithm only selects three reference nodes for the positioning calculation, the error is still relatively large. Therefore, to further improve the positioning accuracy, the four reference nodes closest to the unknown positioning nodes are selected to solve its coordinates; that is, the reference nodes in the positioning calculation are

Compared with the weighted centroid based on distance (WCBD) algorithm that introduces the sum of inverse distances as the weight coefficient only when the second centroid is obtained, 24 the proposed algorithm accounts for the influence of the different distances of the reference nodes on the positioning error when the centroid is first sought, making it a more rigorous algorithm.
Algorithmic flow
The process for determining the positioning in an actual tunnel using the quadratic weighted centroid algorithm is as follows
Step 1: Send ID, position message, and positioning request.
The reference nodes in the tunnel periodically send their ID, position information, and positioning request to the wireless sensor network (this article uses the ZigBee network as an example).
Step 2: Calculate the RSSI value.
When the positioning node receives a request from the reference node, the reference node begins to collect the positioning node’s RSSI value multiple times (usually 8 times). At the same time, the reference nodes use the optimization method mentioned in Section “RSSI value optimization” to optimize the received RSSI values. Then, the distance between the reference node and the positioning node is calculated using formula (3) and transmitted to the upper computer through the coordinator.
Step 3: Build the ID, coordinates, and distance collection.
After the upper computer receives the information from the coordinator, the upper computer arranges the communicating reference nodes from small to large based on the ranging, and places their IDs, positions, and corresponding distance information in three sets:
Reference node IDs: Reference_set = {
Reference node coordinates: Position_set = {(
Distance values between the positioning node and the reference node
Distance_set = {
Step 4: Calculate the coordinates for the four estimated positions for the positioning nodes.
The upper computer extracts information from the top four reference nodes (
Step 5: Obtain accurate coordinates.
Formula (10) is then used to optimize the estimated value, from which more accurate positioning node coordinates
Simulation and analysis
To verify the practicability and effectiveness of the algorithm, the simulation parameters for the simulation analysis were based on an actual tunnel environment; a one-way three-lane highway tunnel with 16 m in width and 60 m in length; the parameter settings for which are shown in Table 2.
Simulation scene parameters of positioning errors.

In the set scene range, the eight reference node coordinates were set at a distance of 20 m and the 20 positioning nodes placed randomly around the reference nodes. The position of the reference and positioning nodes are shown in Figure 4.

Reference and positioning nodes layout.
The positioning error of the algorithm was

where
The mean square error (MSE) of the algorithms was

where
The positions of positioning nodes arranged in Figure 4 were estimated by using the centroid algorithm, the proposed quadratic weighted centroid algorithm, the Min-Max multilateration algorithm, and the WCBD algorithm in Liu and Liu’s 24 work. The MSE, average error, standard deviation, minimum error, and maximum error for the four different algorithms are shown in Table 3.
MSE, average error, standard deviation, minimum error, and maximum error of four algorithms.

MSE: mean square error; WCBD: weighted centroid based on distance.
As shown in Table 3, the positioning accuracies of the quadratic weighted centroid algorithm, the Min-Max multilateration algorithm, and the WCBD algorithm were better and the error fluctuations smaller than for the centroid algorithm. The minimum positioning error for the Min-Max multilateration algorithm was 0.1833 m, the maximum error was 1.9907 m, the average error was 0.9683 m, the MSE was 1.1836 m2, and the standard deviation was 0.5090 m. Although the complexity of the Min-Max multilateration algorithm is lower, the positioning accuracy and the errors’ degree of dispersion of the Min-Max multilateration algorithm were larger than the quadratic weighted centroid algorithm. Meanwhile, the average error for the quadratic weighted centroid algorithm was 0.7913 m, the MSE was 0.6968 m2, the standard deviation was 0.2728 m, and the maximum error was 1.3174 m. Obviously, the overall positioning accuracy of the quadratic weighted centroid algorithm is better than the other three algorithms.
Reference node layout optimization
Different reference node layout modes
To examine the influence of different reference node layout modes on positioning errors, a positioning simulation was conducted using two reference node layout methods: symmetric and fold line; the specific forms for which are shown in Figure 5.

Reference node layout diagram: (a) symmetrical layout and (b) fold line layout.
A tunnel space 120-m long and 16-m wide was simulated using MATLAB programming. The lateral reference node spacing,
Simulation scene parameters of different reference node layouts.

The 25 unknown positioning nodes were placed randomly; the specific positions for which are shown in Figure 6. The positioning errors for the symmetric and fold line layout modes were compared when the lateral reference node spacing,

Positioning nodes layout diagram.
When the lateral reference node spacing,

Comparison of positioning errors when
The average error, MSE, standard deviation, and minimum and maximum error are shown in Table 5 for when the lateral reference node spacing,
Average error, MSE, standard deviation, and minimum and maximum error when

MSE: mean square error.
As shown in Table 5, when the reference nodes were symmetrically arranged, the positioning errors were between 0.3680 and 1.4103 m, the average error was 0.8235 m, the standard deviation was 0.2805 m, and the MSE was 0.7536 m2; while when the reference nodes were in the fold line layout, the positioning errors were between 0.2690 m and 5.0686 m, the average error was 1.5958 m, the standard deviation was 1.1166 m, and the MSE was 3.7435 m2. Therefore, while less reference nodes were required for the fold line layout mode, the average error and the error fluctuations were large, and while the symmetric layout mode required more reference nodes, the average error and the error fluctuations were small.
The positioning errors for the two layout modes are shown in Figure 8 when the lateral reference node spacing,

Comparison of positioning errors when
When the lateral reference node spacing,
Average error, MSE, standard deviation, minimum error, and maximum error when

MSE: mean square error.
As can be seen in Table 6, when the reference nodes were symmetrically arranged, the positioning errors were between 0.1452 m and 2.0127 m, the average error was 0.8419 m, the standard deviation was 0.5585 m, and the MSE was 1.0082 m2; while when the reference nodes were in the fold line layout, the positioning errors were between 0.2171 m and 4.6733 m, the average error was 1.7081 m, the standard deviation was 1.2948 m, and the MSE was 4.5273 m2. Therefore, when the reference nodes were symmetrically arranged, the average positioning error and the overall error fluctuations were significantly better than in the fold line layout mode.
In both the 20- and the 30-m reference node spacing simulations, the symmetric layout had low average positioning errors and small error fluctuations; however, the disadvantage is that because this layout requires a large number of nodes, the cost is much higher than for the fold line layout, which had large average positioning errors and a large error fluctuation, but significantly less nodes. Therefore, the selection of the positioning node layout mode in practical applications depends on the positioning accuracy requirements and the available funds; however, to ensure safety and positioning accuracy, the symmetrical layout mode should be chosen as a priority.
Different lateral reference node spacing
When tunnel personnel positioning systems are applied in practice, it is necessary to manually deploy the reference nodes in the tunnel when building the wireless positioning network. If smaller reference node spacing is chosen, the number of reference nodes and the positioning system costs increase. Therefore, the reference node spacing should be as large as possible to reduce the positioning system costs. The simulation tunnel were set at 120-m long and 16-m wide. The reference nodes were arranged at symmetric layout mode and the lateral reference node spacing,
Simulation scene parameters of different lateral reference node spacing.

To assess the viability, positioning errors were measured using a symmetric layout mode when the lateral reference node spacing was 20, 24, and 30 m; the results for which are shown in Figure 9, with the average error, standard deviation, and minimum and maximum error comparisons shown in Table 8. In the specific simulation, the positions of 95,381 fixed positioning nodes in the simulation area are estimated and the positioning error values at the respective positions are represented by different colors.

Positioning error distribution with different lateral reference node spacing: (a)
Average error, standard deviation, minimum error, and maximum error comparison of different

As can be seen in Figure 9(a)–(c), the overall positioning errors using the quadratic weighted centroid algorithm were low when the reference nodes were symmetrically arranged and could therefore meet the positioning requirements of most projects. As shown in Table 8, when the lateral reference node spacing was expanded from 20 m to 24 m and 30 m, the average positioning errors increased by 0.0960 m and 0.2104 m and the standard deviation had not changed much. Therefore, if there is no need for strict positioning accuracy, the reference node lateral spacing could be increased from 20 m to 24 m or even to 30 m, which would reduce both the number of reference nodes and the overall system costs.
Conclusion
To solve the problems associated with low positioning accuracy and high system costs in current tunnel personnel positioning systems, this article proposed a quadratic weighted centroid algorithm. First, a Gaussian filter model was used to optimize the RSSI values to improve the ranging accuracy, after which the centroid algorithm and weighting factor were introduced into the trilateral measurement positioning model, and a quadratic weighted centroid method proposed to calculate the coordinates for the positioning node. The simulation results found that the average positioning accuracy of the quadratic weighted centroid algorithm was 0.7913 m and the MSE was 0.6968 m2, which was significantly better than the traditional centroid algorithm, the Min-Max multilateration algorithm, and the WCBD algorithm.
Then, to assess node positioning accuracy to reduce system costs, an optimal positioning system reference node layout was examined through simulations, from which it was found that the symmetrical layout mode positioning accuracy was far better than the fold line layout mode. Then, to determine the best lateral reference node spacing, the average positioning errors under a symmetrical node layout mode for lateral reference node spacings of 20, 24, and 30 m were simulated, from which it was found that the average positioning errors increased respectively by 0.0960 m and 0.2104 m and the standard deviation had not changed much as the lateral spacing expanded from 20 m to 24 m and 30 m, which indicated that system costs and the number of nodes would be reduced at larger lateral spacing. According to the above simulation results, in actual construction, this article suggests that the reference nodes are symmetrically arranged and the lateral reference node spacing can be set to 24 m, which can ensure positioning accuracy and reduce the number of reference nodes.
Focused particularly on tunnel construction, the positioning accuracy of the quadratic weighted centroid algorithm developed in this article was proven to meet the real-time management requirements of on-site personnel and better ensure post-disaster rescue efficiency and can also be used as a positioning algorithm to improve tunnel personnel positioning system accuracy.