
Abstract
Introduction
Wireless sensor network (WSN) comprises numerous sensors that collects information from corresponding atmosphere and transfers to base station (BS). 1 Main goal is to observe, gather data and transfer it to BS. Sensor nodes present in various other parts of the field could combine the data gathered, provide most exact report regarding the local areas. Several WSNs organized are used in measuring physical parameters such as pressure, moisture, temperature else the place of objects, to enhance fidelity of reported metrics, and aggregation of information that minimizes the communication overhead in the network which leads in saving more amount of energy. Some of the features like minimum power, cost, multi-functioning behaviour of sensor nodes make WSN more attentive.2–4
In recent days, with the help of cloud technology development, WSN is employed in many real-world applications that comprise house security purpose, military surveillance, monitor the behaviour of non-domestic animals, hospital services 5 and so on. Nowadays, widely spread research effort is dedicated for new exploration of WSN in long and area which could not be accessed. 6 A sensor network consists of sensing unit, communication unit, memory unit and communication unit which are limited in nature. 7 WSN is deployed in unmanned environments that damage the nodes for replacement or more expensive nodes. Hence, in many cases, the wireless node must be computed for longer period of time without battery. As a result, energy efficiency is a most serious problem while developing a network router with the condition of extended lifetime for network. Energy conserving could be enhanced and maintained by adapting the network topology and modifying the sensors transmitting energy level in router.8,9
Clustering model is applied for decreasing the utilization of power in routing protocols. 10 This architecture contains the sensors which is grouped as clusters, the sensor nodes having minimum power are obtained to execute sensing operation, and transmit the data which have undergone sensing to their cluster head (CH) in small distance. Node in a cluster is approved as a CH, in order to avoid the correlating data from the remaining member of cluster, with respect to minimize the quantity of collected data transfers to BS. 11 The clustering architecture is depicted in Figure 1.

Clustering process in WSN.
Clustering technique has capability of enhancing the energy efficiency by reducing entire power conservation and handles it between the nodes while considering network lifetime. 5 Moreover, it is capable of improving channel content as well as data collisions that results in extended network throughput in terms of maximum load. 7 Based on some of the constraints like restricted energy, bandwidth and computational abilities, several routing protocols are developed in improving the network lifetime. Low energy adaptive clustering hierarchy (LEACH) is a professional WSN clustering protocol 12 that helps for selecting CH with pre-determined possibility of rotating CH between the sensors to eliminate quicker deterioration of CH energy. But selecting CH happens randomly. Consequently, a node which has least power could be elected as CH and they are not equally spread. Moreover, LEACH protocol needs the transmission among CH and the BS to be completed though one hop that conserves more quantity of energy and destroying the balance of sensors when CH is placed away from BS.
LEACH-centralized (LEACH-C) protocol is implemented for improving the features rather than LEACH that utilizes a centralized clustering technique in forming clusters. LEACH-C improves the network performance by establishing extended cluster through the distribution of CH for entire network. The nodes whose energy level is very high could be chosen as CH. However, LEACH and LEACH-C are not capable of using knowledgeable CH electing process, distributing CH is done randomly, and that results in more amount of energy consumption. Consequently, base-station controlled dynamic clustering protocol (BCDCP) 13 is presented to build mostly balancing clusters. BCDCP consists of equal number of members for every single CH, which is to eliminate excess CH and it uses CH–CH routing for transmitting data to BS. To improvise the lifetime, few position aware protocols are projected for reducing the transmitting price between the nodes.
In hybrid energy efficient distributed clustering (HEED) protocol, 14 CHs election is dependent on energy integrating with alternative parameters like proximity of node to the respective neighbour node. The CHs forwards information to BS using multihop communication system. HEED guarantees that a single CH can attain even CH distribution over the network. Yet, a head node consumes maximum energy in HEED protocol, which results in quick draining of energy. energy efficient clustering scheme (EECS) protocol 15 is applied for better distribution for CHs, where CH is chosen with respect to lasting energy as well as placement of nodes. In EECS, a competing technique is optional for selecting CH, a permanent communication range is provided for every candidate sensor. If a sensor identifies it with massive energy when compared with others, then designates it as CH and telecasts to all remaining nodes. Therefore, this technique makes possible issue in intense networks to contain many number of nodes compete to become a CH.
Topology-controlled adaptive clustering (TCAC) protocol 16 enhances a presentation of EECS protocol that organizes the nodes’ transmitting power state to reduce network energy dynamically, during the process of assuring inter-cluster connectivity. The CHs which are selected will transfer the data directly to BS. The Hausdorff clustering model 17 invents a greedy technique for selecting the CHs that depends on the position, communicating competence and networking connection, where cluster is constructed in a single time. Remaining energy of the nodes is consumed rapidly, whenever clusters are initially arranged. Local energy consumption prediction-based clustering (LECP-CP) model is projected in Yu et al. 18 comprising a new CH selection technique, inter-cluster transmission and routing tree creation technique. It depends on the distributed energy predicted and utilization ratio of sensors. Moreover, protocol offers the exact and practical cluster radius for eliminating the energy consumption for the whole network. Several applications contain BS away from sensor network so that the CH should conserve more amount of energy compared with other nodes. Hence, allocating task can be done easily in such a way that sensors play important role for enhancing the energy efficiency. For an instance, forward nodes could be applied for balancing high consumption of the CHs. In scalable energy efficient clustering hierarchy protocol (SEECH), 19 few nodes with large remaining energy are chosen, and the CH selects the nearby relay node (RN) as it should perform second hop. Thus, CH gathers the details from every cluster member and sends it to RN that forwards the information to BS. This is the way where RN could distribute the inter-cluster communication, assist in reducing the energy conservation of CH. But more than two nodes’ CHs might select similar forward nodes. In addition, alternate energy consuming is necessary that will increase the depletion of energy from the chosen RNs. Along with added energy utilization, CH selects its forwarding node. Hence, position of node is not considered for selecting forward nodes. Some other techniques involving the inter-cluster communication are also presented in the literature.5,7
This article presents a new swarm intelligence (SI)–based clustering and with multihop routing protocol for WSN. Initially, improved particle swarm optimization (IPSO) technique is applied for deciding the CHs and organizes the clusters proficiently. Then, the grey wolf optimization (GWO) algorithm–based routing process takes place to select the optimal paths in the network. The presented IPSO–GWO approach incorporates the benefits of both the clustering and routing processes which leads to maximum energy efficiency and network lifetime. For examining the outcome of the applied IPSO–GWO technique, it is simulated and the outcome is examined under several scenarios.
The upcoming parts are arranged here. Section ‘The proposed IPSO–GWO algorithm’ elaborates the presented IPSO–GWO model. Section ‘Performance evaluation’ examined the experimentation outcome, and section ‘Conclusion’ concludes the IPSO–GWO model.
The proposed IPSO–GWO algorithm
The proposed IPSO–GWO algorithm involves two main stages, namely, IPSO-based clustering and GWO-based routing. Initially, a number of sensor nodes undergo deployment in a sensing field. Once the nodes are deployed in the region to be sensed, BS sends a beacon signal to the entire network. Every node will receive the beacon signal and calculate its approximate distance to BS based on received signal strength indicator (RSSI). Next, the sensor nodes broadcast a handshaking message within its communication radius for gathering information about its neighbours. When a neighbouring data are gathered, then the clustering process takes place. Then, IPSO algorithm is applied for selecting the CHs and organizes the clusters proficiently. Then, the GWO algorithm–based routing process takes place to select the optimal paths in the network. The presented IPSO–GWO approach incorporates the benefits of both the clustering and routing processes which leads to maximum energy efficiency and network lifetime. The entire process is shown in Figure 2, and the stages are briefly explained in the following subsections.

Overall process of IPSO–GWO algorithm.
System model
Network model
A WSN includes N sensors that undergo deployment in a field to check the atmosphere frequently. Figure 1 depicts units of sensors that comprise sensor node, microcontroller component communicating unit and power managing component. Considerations of the sensors are as follows:
Sensor nodes have the capability of functioning in sensing state to observe physical variables else in the communication state to forward information between each nodes straightaway to BS and they collect the data from CM;
Every node’s connectivity handles the traffic;
Each node is allocated to an index of its position;
Sensors and BS are stable even after deployment process, that is, distinctive for sensor networking application;
Primary energy is better for every sensors, network is assumed to be identical;
Every nodes are left without attending once the deployment is over, in which the battery could not be able to recharge;
Each node measures the physical variables impermanent state as well as transmits the information in periodical time for the target node;
Each node consists of a set of transmitting energy level. Nodes have the ability of adapting the power transmission in terms of distant nature to the marked recipient;
The connection among nodes is similar in nature, this distance could be measured using the signal power received;
The data which are sensed are highly correlated. Hence, the CH aggregates data grouped from the cluster to a fixed length packet;
BS is superficially energized.
Network lifetime model
Different methods are available to define the network lifetime of WSN. This study defines the network lifetime as the number of rounds completed till the nodes die. Since the nodes in the neighbouring region have resulted to identical data, the loss of first node does not impact the whole network functioning, however, with a slightly degradation in quality. Once half of the node dies in a network, it loses its energy and becomes dead, the data quality will become worse. When the last node dies in the network, the network stops operating. To analyse the lifetime of WSN, the first node die (FND) and half node die (HND) are considered.
In several functions, the networks could perform efficiently, even if some nodes are destroyed. Whenever, more number of sensors are employed in a region, a node will have many others nearby nodes with high potential of similar features, so that it is easy for the networks to manage the failed nodes. Hence, time till the FND is not only the measure to estimate network survival rate. Consequently, the lifetime that is a HND is an efficient measure for evaluating the performance in cases of maximum node density. It defines the lifespan of network as followed by

where P denotes the number of sensors present in network.
IPSO-based clustering process
Let

As revealed in equation (1),

where

where
In current years, several optimization techniques have generally used in the WSN. PSO technique is a population-dependent stochastic optimization method enthused with social performances of bird gathering of fish schooling. The structure is initiated by population of arbitrary results and search for optimal updating productions. PSO remains same without any development operators, namely, mutation and crossover. The probable solutions, known elements, fly with the difficulty space through following the present optimum elements.
Due to its easy model and maximum effectiveness, PSO has been a generally applied optimization method and is effectively related to several real-time issues, mainly multi-modal issues. Therefore, it is an efficient technique to resolve the clustering issues of work effectiveness and minimum communication distance for the clustering system stage. In our earlier study, we employ PSO technique for resolving software-described network issues effectively. The conventional PSO technique is improved with altering the inertial weight to keep away from particles individual trap to local optimum, also use the IPSO technique is to exploit the fitness purposes. As an outcome, extra proper CHs and dispatch node is chosen that creates the protocol further work efficient. This division illustrates how the improved PSO techniques are proposed for optimal clustering in WSN. 20 It has the subsequent five major phases as follows:
1.
2.
3.

with the position of the elements is informed as follows:

where
4.

where
5.
GWO-based routing
There are three stages in GWO-dependent routing: (1) initializing wolves, (2) calculation of fitness value and (3) updating speed as well as location of wolves. 21 The hunting process of wolves is clearly demonstrated in Figure 3.

Hunting nature of wolves: (a) chasing, approaching and tracking prey; (b–d) pursuing, harassing and encircling; and (e) stationary situation and attack.
Initialization of wolves
Every result signified as matching of one entrance to an additional or BS. The sizes of the results are equivalent to the entire number of gateways (M). The solution gives a direction from every gateway in the direction of the BS during after that subsequent gateway in the network. Every gateway is initiated with an arbitrary number

where
Fitness function
It computes worthiness of the solutions through respect to the variables occupied in it. It assists to inform beta, delta and alpha results on every round. Now, the fitness functions are proposed for producing a competent routing path on every gateway to BS. On the whole, distance (P) traversed with gateways is described in equation (9)

The entire numbers of gateway gets in the networks are described in equation (10)

Routing is approved with regarding the smallest distance traversal and the least count of hops. 7 Consequently, the lesser on the whole distance crossed, and the numbers of hop, the maximum the fitness value for the result, which means that distances and numbers of hop are in reverse relative to the routing fitness. The solution with the maximum fitness value is the optimal solution in the population. The presented fitness function is prepared in equation (11)

where
Update wolves position
To attain the preys, every wolf has to know its place based on the location of delta, beta and alpha wolves are template in equations (7) and (8). In GWO-dependent method, alpha wolves are the wide resolution in the solution put; the beta wolves are the optimal solutions from the before iteration; and the delta wolves are the optimal solution from the present iteration. To inform the points of omega wolves, we consign to the standard of efficient positions of beta, delta and alpha wolves as said in equation (9). Using equations (3)–(9), the updating the position shows the way to the best solution for the optimization issue.
It is probable for informed locations may be negative or larger than one due to the algebraic subtraction and addition. Though the
If
If
All the solution is re-estimated through the help of fitness function later than handover new positions.
Performance evaluation
The performance analysis of IPSO–GWO protocol is created and the simulation outcome is verified with the help of evaluation parameters which are described below:
Energy efficiency: It is employed for determining the quantity of energy utilization of each node over the implementation of time period.
FND: It is based on round number from which the primary node in the network expires. It could be used for identifying the quantity of time in which all nodes present in WSN are functional completely.
HND: It also depends on the round number from which the half of the node present in the network is dead. It is applied to find the time consumption for 50% of nodes which are in active stage in the entire network.
Implementation setup
The IPSO–GWO method undergoes evaluating process with the help of sequential simulating implementation under different cases based on the location of BS. A group of three cases are represented as S1, S2 and S3 correspondingly and are depicted in Figures 4−6, respectively, as follows:
S1 – BS is placed in the middle of target region;
S2 – BS is placed in the corner of target place;
S3 – BS is positioned far away from target area.

S1: BS at middle of the target area.

S2: BS at the corner of the target area.

S3: BS distant from the target.
Here, a network with group of 300 nodes with rare deployment is carried out in the target region of 200*200 m2. The parameters obtained for validating process are provided in Table 1. For comparing purposes, three clustering techniques like LEACH, threshold sensitive energy efficient sensor network (TEEN), PSO and IPSO are employed.
Simulation parameters.

Results analysis
Energy efficiency analysis
For verifying the energy effectiveness of the obtained IPSO–GWO method, the maximum energy usage of three scenes are analysed and presented in Figures 7−9. The energy spent is determined with the help of average energy conserved by every sensor nodes under 2500 rounds correspondingly. IPSO–GWO acquires high energy efficiency compared with other models because of the inherent features of IPSO and GWO technique in the clustering process and routing operation, respectively.
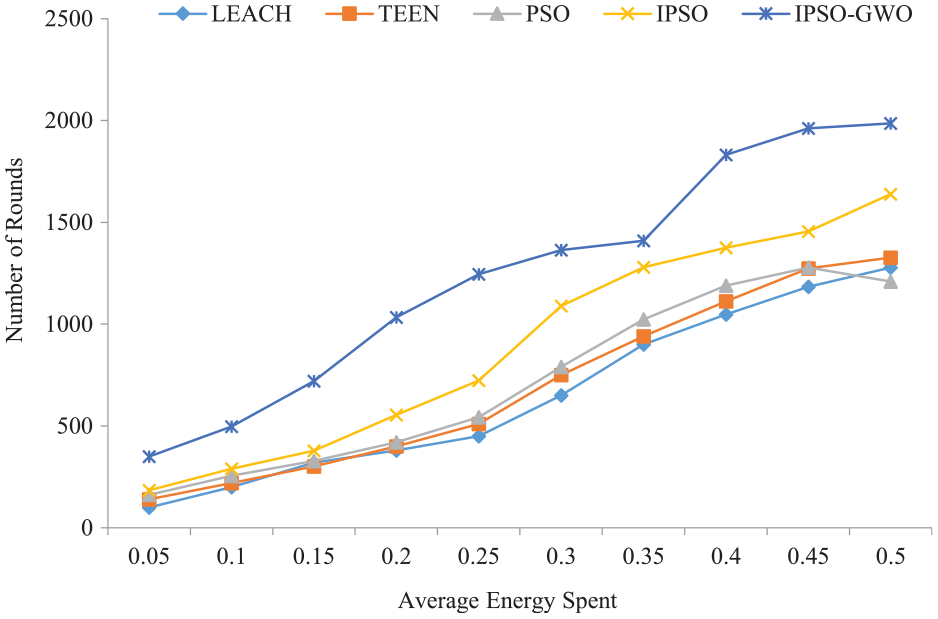
S1: average energy consumption.

S2: average energy consumption.

S3: average energy consumption.
The IPSO–GWO protocol minimizes the energy requires for transmitting the data inside the cluster. LEACH attains poor result due to the casual selection of CH as well as the use of one hop communication. These are some of the reasons that tend for maximum energy dissipation over alternate models. Next, the reactive
Number of data transmissions
The efficiency of WSN is investigated under the number of constructive data transmissions takes place among CHs and BS for specific interval of time. Data aggregation that is performed by CHs would be helpful till HND reaches. Because of IPSO–GWO model extends the HND to a high extent with effective routing mechanism and unequal clustering model. The number of data transmission under different models is depicted in Figure 10. When comparing with other models, large amount of data transmission is performed by the IPSO–GWO. Besides, lower number of transmissions is done through LEACH below every scene over other methods. It cannot handle the CH and minimize the communication process among nodes and BS. At the same time, the TEEN forwards the data only if an event is happened and lower amount of packets would be transferred. Since the IPSO–GWO technique would forward information frequently for long time period because of prolonging lifespan, number of helpful data transmission by IPSO–GWO model is high when compared with alternate methods.

Packets to BS earlier to HND.
Network lifetime
Different methods are accessible for describing the network lifetime. The lifetime of network is indicated by the round numbers finished until the nodes in WSN get expired. Because nodes exist in the nearby area lead for identical data, the FND do not hold any impact on the network operation only with slight degrading in quality. Upon the HND attains in WSN, the quality of the information gets highly degrades. Once the final node in the WSN dies, the WSN grows inactive and stops the transmission to BS. For determining the lifespan of network, FND and HND values are considered. Table 2, Figures 11 and 12 depict the results obtained by FND and HND under three cases, respectively.
Network lifetime analysis.

IPSO: improved particle swarm optimization; GWO: grey wolf optimization; FND: first node die; HND: half node die.

FND for S1, S2 and S3.

HND for S1, S2 and S3.
The figure reveals the IPSO–GWO model extends the FND in first case over other techniques. In first case, FND of LEACH takes place at 802 rounds and IPSO–GWO at 1982 rounds. In second case, the FND of LEACH takes place at 542 rounds and IPSO–GWO at 1564 rounds. In third case, the FND of IPSO–GWO takes place at 1438 whereas LEACH at 452 rounds, respectively. The IPSO–GWO model mostly increases the lifespan of network by attaining the efficient energy. The figure describes the IPSO–GWO method improves the FND in first case than other techniques. In first case, FND of LEACH takes place at 1126 rounds and IPSO–GWO at 2056 rounds. In second case, the FND of LEACH takes place at 849 rounds and IPSO–GWO at 1897 rounds. In third case, the FND of IPSO–GWO takes place at 1620 whereas LEACH at 614 rounds, respectively. The IPSO–GWO model focused on increasing the lifetime of network by achieving the energy efficiency.
Conclusion
This article presents an SI-based clustering and with multihop routing protocol for WSN. The proposed IPSO–GWO algorithm involves two main stages, namely, IPSO-based clustering and GWO-based routing. Initially, IPSO algorithm is applied for selecting the CHs and organizes the clusters proficiently. Then, the GWO algorithm–based routing process takes place to select the optimal paths in the network. The presented IPSO–GWO approach incorporates the benefits of both the clustering and routing processes which leads to maximum energy efficiency and network lifetime. The experimentation analysis of IPSO–GWO technique is created, and the simulation outcome is verified with the help of evaluation parameters. The simulation outcome exhibited that the presented IPSO–GWO algorithm offered maximum energy efficacy with improvised network lifetime.