
Abstract
Keywords
Introduction
Breast cancer is one of the leading causes of death among women in the world today.1–4 It is one of the most invasive types of cancer, and statistics reveal that every year approximately 40,000 women die from breast cancer in the United States alone. In India, as per the reports of 2012, around 1,44,937 women had breast cancer and out of which 70,218 of them succumbed to death. 4 It is thus an enormously serious health concern for women worldwide. Breast cancer develops from breast tissue results in lump in the breast, changes in the shape of the breast, breast skin abnormalities, fluids from the nipple and many other repercussions. The accuracy in the prediction of breast cancer plays a vital role as it leads to timely and conclusive decision-making providing opportunity to avail the sophisticated modern day healthcare treatments. With the ever increasing number of techniques introduced for the cancer diagnosis in the present day and age, data mining and artificial intelligence (AI)–based diagnosis hold a popular and significant choice among researchers for the prediction and discovery of tissues affected by cancer. The data mining techniques are used to detect large, heterogeneous, time series and complex information from data sets aiding various diagnostic and therapeutic services in the health care industry. The data sets in these approaches are fragmented, distributed and then analysed to yield predictive results for accurate diagnosis.
AI is similarly a widely used technique for the detection and diagnosis of various types of cancer. AI tools are mostly used for classification and clustering of gene data of malignant cells, mutated cells and cancer-affected tissues and such approaches play significant role in cancer treatment as indicated by Agrawal and Agarwal. 5 Beni and Wang 6 mentioned swarm intelligence algorithm to be used for forecasting scenarios as well as monitoring and diagnosis of cancer. Various machine learning techniques and optimization methods integrated with swarm intelligence have been successfully used for predicting and diagnosing the cancer-affected tissues. This study proposes a new breast cancer determination and diagnosing method based on swarm intelligence for the detection of breast cancer.
Jele et al. 7 and Teague et al. 8 proposed a fine needle technique for aspiration biopsy (FNA) which is a simple and quick procedure for removing breast lesion by a fine needle. Chen et al. 9 mentioned the fact that machine learning characteristics and techniques are needed for diagnosis and also for finding any possible errors made by physicians due to time-constrained examinations. The study also informs that classification and machine learning methods work correctly when probability densities are known. In case density of data is not available estimations could be performed with the help of kernel density estimation (KDE). Sheikhpour et al. 13 cited kernel density as a widely useful technique for data estimation. Kernel estimation depends on selection of the most relevant features which further improves the performance indicator. The main advantage of KDE used to increase the prediction accuracy with the help of class conditional densities of data using the Naïve Bayes (NB) classifier.
It is acknowledged that feature selection is crucial yet has associated challenges of consuming fair amount of space and search time. Computation thus plays a very important part in the performance of a feature selection method. Bolasn-Canedo et al. 10 classified feature selection into three types, namely, wrapper, embedded and filters.11–13 The analysis of these three feature selection techniques identifies wrapper capable of providing the highest accuracy, as mentioned by Lal et al. 14 In consistence with the same computational aspect, Wang et al. 15 proposed particle swarm optimization (PSO) intelligence as a powerful computation method being applied in large number of applications. Similarly, Jia et al. 16 proposed the use of particle swarm intelligence approach, statistical and discrete high-quality feature subsets for estimations establishing the same as one of the best computing techniques predominantly used in various applications today. 17 The combination of PSO and feature selection algorithms has immense capability to produce optimized prediction results in cancer diagnosis.
This study introduces a new particle swarm optimization integrated with non-dominating object–based feature selection method (PSO-NDS). The selected features are then subjected to three classification algorithms such as
The user of multi-classifier which reduces the possibility of error in the results generated.
The implementation of PSO algorithm in association with non-dominating sorting (NDS) and multi-classifier such as KNN, decision tree and KDE for prediction of breast cancer.
The use of Bayes’ theorem to further revise the results and obtain the best predictions.
The subsequent research work has been arranged as follows. Section ‘Feature selection methods’ elaborates on the feature selection method, and section ‘PSO using non-dominating method’ describes classification techniques, and proposed PSO-based multi-classification model is elaborated in section ‘Working and processing of PSO-NDS preprocessing’. The experimental setups of data and result comparisons are presented in section ‘Results and Discussion’. This article concludes with conclusion and future directions discussed in section ‘Conclusion’.
Feature selection methods
Feature selection method is used to remove irrelevant features from the data set in order to infer accurate information from the data analysis performed on the data set. For example, the biological platform for feature selection is based on gathering similar gene expressions. This section presents a brief overview on feature selections based on biological and cancer–related research works conducted. Hira and Gillies mentioned that the objective of feature selection and extraction is to avoid over-fitting of the data to continue further analysis. 18 As mentioned in the study, feature selection method is divided into three sub-methods, namely, filter, wrapper and embedded classification as shown in Figure 1.

Feature selection classification.
The filter method extracts data without any prior learning. The wrapper classifier uses prior learning with evaluation and embedded method is a combination of filter feature selection and embedded classification technique. It is thus prominent that decision-making based on the most appropriate feature selection method can be a difficult task. Various feature selection methods and types of classification are shown in Table 1.
Various feature selection method and types of classification.

SVM: support-vector machine; STuMs: support tracker machines.
Jafari et al.
19
mentioned in their study that the
Jiang et al. 25 proposed random forests for the creation of decision trees, the use of diverse samples of the original data and the use of different average algorithm for improving the accuracy. The study in Ma et al. 26 identified that least absolute shrinkage and selection operator (LASSO) method features are classified based on zero and nonzero. Anushaa and Sathiaseela 27 proposed the NLMOGA feature selection method which is based on constraint selection from a sub-population. This method involves finding the most suitable or closest set of objects from the group and uses Pareto’s front method to minimize the inner classes. In this method, computation cost and time complexity are quite high. The authors Khan and Baig 28 proposed multi-object GA (non-dominated sorting genetic algorithm (NSGA-II)) to be used for resolving multi-objective feature and subset feature–based problems wherein data used for large attributes and non-relevant features are eliminated. The proposed algorithm NSGA-II features involve measurement using ID3. The experiment is conducted with the help of NDS. Two classification algorithms are used such as ID3 and Pareto’s front. The NSGA-II method is applied to different applications such as salary prediction and DNA sequence, yielding immensely satisfactory accuracy (95.2) of prediction of data.
The authors Zeng et al.
29
proposed a method for optimization that uses genetic algorithm kernel density estimation (GA-KDE) named support tracker machines (STuMs). The method sweeps out the irrelevant information yielding better accuracy. Naseer et al.
30
proposed a hybrid approach using ant colony optimization (ACO) and multi-classification techniques. This hybrid approach used a filter-based classifier to enhance the accuracy prediction. The experiment was conducted using four different classifiers over 11 data sets and then the hybrid method results were compared to the PSO and GA results. The evaluation results appear to be similar to the PSO method with 95.27% and 95.99% accuracy, respectively. Sakri et al.
31
proposed a PSO-feature selection method which is based on three classifiers such as
The authors Reddy et al. 32 proposed a novel approach – deep neural network and support value (DNNS) for the prediction of breast cancer using large-scale data sets form a reputed hospital in India. The accuracy, precision and recall values resulting from the proposed methodology were compared with the state of the art techniques. The accuracy (97.21%) of the DNNS-based approach, although was better than the other traditional approaches but was not extremely promising. Ramadan et al. 33 proposed a computer-aided diagnosis (CAD) system for the detection of breast cancer. The framework involved the use of mammogram data in which were classified for the purpose of disease prediction. The study highlighted the various features and factors contributing towards detection of breast cancer using CAD systems. The comparisons of the various CAD methods are conducted and the receiver operating characteristic (ROC) is calculated. However, the CAD results have not been found reliable enough to be confidently considered as a standalone technique for breast cancer diagnosis. The study finally indicates the need of deep learning and similar approaches for enhancing the performances of CAD systems in order to generate more accurate detection results.
The study by Mohammed et al. 34 analysed breast cancer data using machine learning techniques, namely, KNN, SVMs, NB and various other classification methods. The results of the classifier were validated and compared using two popular data sets – Wisconsin Breast Cancer (WBC) and the publicly available Breast Cancer data set. The study primarily emphasized on issues pertaining to handling of imbalanced data sets and resampling of the data was performed to resolve the issues. To evaluate the approach, 10-fold cross-validation was also performed and the efficiency of the classifiers was gauged using the true positive and false positive values, ROC, standard deviation and accuracy metrics. The comparative analysis identified sequential minimal optimization (SMO) as a better classifier after conducting data resampling on the WBC data set. In case of Breast cancer data set, the J48 algorithm generated better results after resampling was conducted. The study by Hou et al. 35 performed the evaluation of four machine learning algorithm in predicting breast cancer among Chinese women. The data set included breast cancer cases and healthy patient data, considered as control for the modelling, training and testing of the machine learning models. The metrics used for evaluation were namely – area under the curve (AUC), sensitivity, specificity and accuracy. The results justified the superiority of XGBoost algorithm in comparison to the other approaches. The various classification techniques, namely, PSO, GA, ACO and ant colony optimization classifier ensemble (ACO-CE) techniques and the relevant classifier accuracy results are depicted in Table 2.13,30
Classification accuracy with various techniques.

PSO: particle swarm optimization; GA: genetic algorithm; ACO: ant colony optimization; ACO-CE: ant colony optimization classifier ensemble; KNN:
PSO using non-dominating method
The main drawbacks of the previous methods as shown in Table 2 are that, it does not use multi-classifiers which enhances the possibility of high error and does not include re-verification of predicted results. The study consists of PSO, NDS and multi-classifier techniques such as
The multi-classification technique is used to increase the accuracy in different directions. The non-dominating method is used to rank the selection features based on good points. Bayes’ theorem is used to verify the results with a high degree of belief. The proposed model of PSO-NDS is depicted in Figure 2. The PSO method has three parts to it, such as the input, processing and the output.

Diagrammatic representation of PSO-NDS method.
The proposed method utilizes a non-linear method, and hence training samples ((


Equation (2) is used to train the data in multi-directional ways and is used in feature selection and multi-classifications.
PSO
PSO is used to find the objectives, position and velocity based on the timing


where
NDS
Population and objective of the function are calculated based on non-dominating objects. 28 The NDS technique is used to evaluate each subset of the data. Based on the features, if the subset of data is tidy, it is passed to evaluate and each subset data is assigned fitness values. In addition, an initial distance is used to calculate the feature subset. The crowding distance is calculated to find out how close the objects are to their neighbours. The large average data or the resultant cording distance value produces enhanced diversity. The population selection is based on ranking and crowding distances. Hence, the decision is taken based on the crowding distance. The selected distance generates (gen) crossover and mutation operators. The objective of the function with current cancer objects are sorted based on non-domination with N individuals’ selection. N is the population size or objective function size. The final population size depends on the crowd distance pertaining to the feature subset in the cancer cell. The overall operation and flow representation of NDS techniques are shown in Figure 3. The sharing of distance and non-dominating object sharing are derived in equation (5)

where
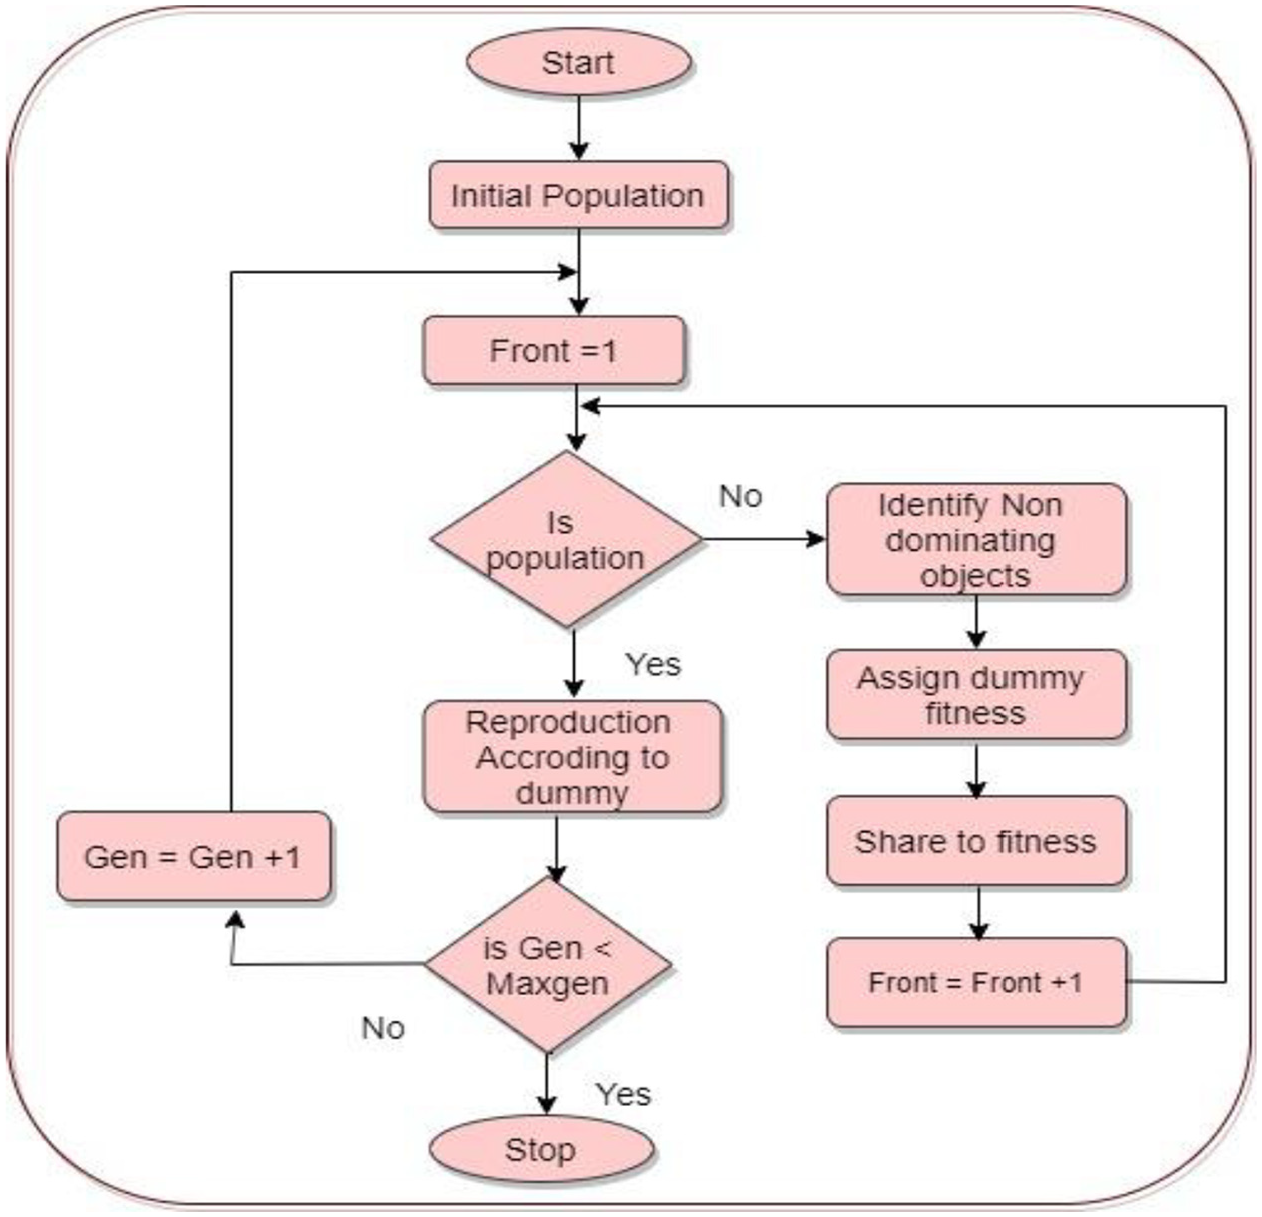
Flow representation of non-dominating sorting.
Multi-classification
The multi-classification method, also termed as multinomial classification is used to test the accuracy on a given data set with different identifications and labels. The multi-classifier uses different classifiers wherein each classifier uses different features for its prediction. Each feature of the data sets usually has different instances or sub-features. When multi-classifiers are used, these sub-features are also analysed which enhances the prediction results and also the prediction rate. The advantage of using a multi-classifier thus lies in the improvement of prediction rate and prediction results. However, it also has its associated challenges pertaining to increase in time complexity involved in the process of analysing the various features at different levels.
The classification is based on various instances and steps involved in multi-classification are as follows:
Step 1: loading the test data.
Step 2: labelling the data set into test and training.
Step 3: training KNN classifier, fast decision classifier and kernel density classifier.
Step 4: using the classification to predict the test data.
Step 5: measuring the accuracy.
KNN classifier
KNN algorithm is a non-parametric classification and regression technique mentioned by Sakri et al.
30
In this study,
Fast decision tree
Fast decision tree classification is used for decision-making from large data sets as mentioned by Manapragada et al. 36 The algorithms help in decision-making37–46 without compromising on the accuracy and to top it up increases the space complexity. This study implements fast decision tree with conditional independence. The conditional independency information gaining (IG) is defined as

where

Kernel density classifier
Sheikhpour et al.
13
proposed the kernel density method which focuses on identifying past conditions similar to the prediction time. This method directly estimates the density of data without any assumption. Considering {

where
This multi-classification technique increases the accuracy of the prediction as the prediction rate is measured in different scenarios. The first type of multi-classifier is
Bayes’ theorem
The main usage of Bayes’ theorem is updating the prediction probability and increasing the belief rate using predicted results of affected cells. Mathematically, Bayes’ theorem is represented as follows

For proposition
In this work,

In the proposed work,
Working and processing of PSO-NDS preprocessing
WBCD 47 and WDBC48,49 data sets are used in this study for learning and analysis of the data set. WDBC presents 569 instances with 30 features and WBCD presents 699 instances. The data are collected from various cases, images of human breast tissues which are digitalized. The various parameters are analysed using predefined parameters used such as velocity, starting point and objective function. The analysis and preprocessing technique followed is based on PSO-KDE approach 13 described in the following section.
Processing of PSO-NDS
The proposed multi-model consists of non-dominated sorting, PSO and multi-classification. Bayes’ theorem is used for analysing the various factors. The processing steps of PSO-NDS are mentioned as follows:
Step 1: parameters of PSO and instance of particles are first conserved.
Step 2: particle position and velocity of search space are initiated.
Step 3: object function of particle is calculated using PSO-NDS.
Step 4: using PSO-NDS, the various objective function is updated and individual performance of objects is updated.
Step 5: velocity and position of the particles are updated.
Step 6: if the desired number of iterations is not reached, the return to Step 3.
Step 7: the features and accuracy are presented.
The algorithm of PSO using NDS with multi features is shown in Algorithm 1.

NDS: non-dominating sorting.
The PSO-NDS with multi-classification simulation determines the accuracy and Bayes’ theorem is used to make the relevant factors to maximize the objective function and features subset. This helps to maximize the accuracy of the prediction enhancing the accuracy rate. In PSO using NDS, the particles
Step 1: initialize the parameter.
Step 2: initialize the population.
Step 3: objective function is calculated using PSO-NDS.
Step 4: selection, mutation and crossover selected over particle.
Step 5: accuracy is calculated using multi-classification techniques.
Step 6: using Bayes’ theorem, supporting factors are calculated.
Step 7: satisfied objective function is generated.
Results and discussion
The proposed PSO-NDS model was used for the prediction of breast cancer. For experimentation purposes, WBCD and WDBC data sets were used. For the performance evaluation purpose, various parameters such as number of iterations, velocity and initial position of particles are used and considered for experimentation. The WBCD and WDCD data sets are randomly divided into subsets and used for training. The number of iterations is set as 20. The experiment is conducted on the above parameters with 20 iterations. The justification on the superiority of PSO-non-dominating method against the traditional methods is prominent from the generated results. The PSO-non-dominating method produces better results in identifying the benign and malignant features or sub-features. The predictions are also more accurate and computed considering each feature as per the dominant properties. Finally, the computation of the study results of PSO-NDS is compared with PSO-KDE 13 and GA-KDE. 29 The experiment is validated using accuracy, specificity and sensitivity were validated and performed.
The performance of PSO-NDS, PSO-KDE and GA-KDE experiment is analysed on training data sets to gain the ideal feature subset and classification. The accuracy of PSO-KDE and GA-KDE were almost similar but yielded inferior accuracies when compared to the proposed methods. Razieh et al. 13 proposed a PSO-KDE for breast cancer detection. The main intent of this method was to increase the accuracy, thereby reducing errors. The method produced optimal accuracy level using only one classifier which had possibilities of generating erroneous predictions in comparison to other popular methods. It is thus observed from the related research work that majority of the studies conducted using the PSO feature selection method produced optimal results compared to the other methods. However, there exist associated challenges pertaining to its application on linear methods. In case of GA-KDE, the GA and non-parametric KDE–based classifier are hybridized to compute the optimal bandwidth and also the subset of features.
The experiment is conducted using various trails and average accuracy is calculated. Table 3 and Figure 4 show the accuracy of PSO-NDS in comparison to other stated of the art methods with relevant features mentioned.
Accuracy comparison between various methods (GA-KDE, PSO-KDE, PSO-NDS).

PSO: particle swarm optimization; NDS: non-dominating sorting; KDE: kernel density estimation.

Accuracy of WBCD and WDBC.
The PSO-NDS achieved 98.28% and 98.8% accuracy for features between 5–6 and 15–20, respectively, as shown in the figure for WBCD and WDCD data sets. The proposed work obviously improved the accuracy compared to other studies conducted. The accuracy of the prediction of WBCD and WDCD data sets is generally high. But, in a real world scenario, when data sets with huge amounts of data are subjected to scanning and prediction, the prediction rate and accuracy of the prediction decrease as a natural effect. However, in the present work, the Bayes theorem is implemented to elevate the accuracy. The supporting factors and evidence are verified using revised mechanism, and the false positive prediction is easily reduced using the Bayes theorem. The increase in prediction accuracy is achieved by reducing the number of features, considering the most relevant ones in the analysis as shown in Table 4.
Performance comparison between various methods (GA-KDE, PSO-KDE, PSO-NDS).

PSO: particle swarm optimization; NDS: non-dominating sorting; KDE: kernel density estimation.
The average sensitivity of PSO-NDS is also compared with PSO-KDE and GA-KDE. The performance evaluations are shown in Table 4 and Figure 5. Similarly, Table 4 and Figure 6 show the comparative values of specificity wherein the performance of the proposed method proves to be better.

Sensitivity of WBCD and WDBC.

Specificity of WBCD and WDCD.
In Figure 5 and Table 4, the sensitivity of prediction is increased in both WBCD and WDCD data sets. In these data sets, minimum eight features are considered for predictions. But in the 12, 18 and 24 features, the false positive will increase. In Figures 4 and 5, if the features are not selected, that particular feature not used for prediction and that particular features are not affected.
In the data set used, as well as in case of real-time data, the number of the features decreases automatically and positive test cases increase with prediction rate decreasing otherwise. Figure 6 shows similar decrease in specificity (correctly generated negative).
Table 5 shows the error rate of WBCD and WDCD of data set computation. The error ranges are less than 1.0. So for the predicted results, both sensitivity and specificity are achieved in the maximum 12 features of proposed work. But the number of prediction factors or features is more in the WDBC data sets, and in case of huge real data sets, the error rate may be increased.
Error range.

PSO: particle swarm optimization; NDS: non-dominating sorting.
The other factors that help to achieve the accuracy are the supporting factors such as objective function of particles, multi-classification prediction parameter and accuracy, all of which are considered for prediction of results. For the supporting rate and evidence of belief around 10 factors are considered and based on the 10 factors, the results and prediction are supported to achieve the prediction results for breast cancer as shown in Table 6. In Bayes’ theorem, the probability measures the ‘degree of belief’. Also the prediction is based either on a single features, collected evidence or conditional probability which updates the belief evidence. It basically shows how a ‘degree of belief’ when expressed as a probability changes realistically based on the account of available evidence.
Supporting factor rate and evidence of belief (10).

Conclusion
The proposed work emphasizes on predicting breast cancer with optimal level of performance measures using a multi-modal model. The data set used in the study is WBCD and WDCD which are popularly available for the purpose of conducting research. The proposed multi-modal classification model consists of various techniques, namely, NDS method, multi-classifier and Bayes’ theorem to accurately classify the breast cancer data sets. The proposed multi-modal classification model is called PSO-NDS. The error factors were reduced using supporting factors with evidence of various factors. The proposed work is applied into an