
Abstract
Introduction
Different types of insecticides are widely used in pest management throughout the world, and they exert toxic effects on animals and humans. Increased application of pesticides normally causes dangerous problems and health hazards. Nowadays, its varied application in agriculture is causing serious problem on human health. Synthetic pyrethroid type II pesticide (cypermethrin) is extensively used due to its low toxicity to animals. Marei et al 1 reported that cypermethrin is metabolized easily but gets accumulated in fatty tissue, adipose tissue, brain, and liver. Pesticides affect fetus in pregnant woman. Prenatal treatment to mixed pesticides containing cypermethrin and methyl parathion could cause neural DNA damage. 2
Higher inflammation may induce cell death then the expression will be much more severe. Oxidative stress induced by generation of reactive oxygen species has been concerned in the toxicity of pesticides. Cypermethrin-induced cell death has been shown to occur when ROS are produced faster than they can be removed by antioxidant defense mechanisms. High levels of ROS in a cellular system may induce to fragmentation of cellular DNA, proteins, lipids, and carbohydrates. It is the reason for cellular and molecular changes that result in cell toxicity and cell death. 3 It is reported for first time in our study that human hepatocarcinoma (HepG2) cells exposed to cypermethrin have significantly enhanced ROS levels, consequently leading to increased DNA strand breaks and decreased cell viability in HepG2cells. In the present study, we evaluated the acute cytotoxic effects of cypermethrin as well as the mechanism of cypermethrin-induced cell death in HepG2 cells.
Material and Methods
Chemicals and Consumables
Cypermethrin, fetal bovine serum, antibiotic–antimycotic solution, trypsin, 3-(4, 5-dimethylthiozolyl-2)-2,5-diphenyl tetrazolium bromide (MTT), acridine orange (AO), ethidium bromide, phosphate-buffered saline (PBS), and propidium iodide were purchased from Fluka (Sigma-Aldrich, St Louis, Missouri). Other consumables and culture wares were procured from Thermo Fisher Scientific (Waltham, Massachusetts).
Working Solution of Test Compound and Morphology of HepG2 cells
The stock solution of cypermethrin (100 mmol/L) was prepared in ethanol and stored at 4°C. Working solutions were prepared by dissolving appropriate stock solution in the culture medium. We exposed HepG2 cells to different concentrations (0, 5, 15, 40 ng/mL) of cypermethrin for 24 and 28 hours to determine its toxic effects.
The HepG2 cells were cultured in DMEM with FBS (10%) and 1% to 2% antibiotic–antimycotic solution in CO2 (5%) incubator with 95% humidity at 37°C. After exposure to cypermethrin for 24 and 48 hours, the morphological changes in the HepG2 cells were observed using an inverted microscope (Leica DMILLeica, Wetzlar, Germany).
MTT Assay
The viability of cells was determined by quantification of formed formazan salt. Briefly, HepG2 cells (2 × 10⁵ cells) were seeded in 96-well plates. Later 24 h, the culture solution was removed and fresh medium containing different concentrations (0, 5, 15, 40 ng/mL) of cypermethrin and solvent (ethanol) were added for 24 and 48 h. MTT (50 µg/mL) was added to each well. After 4 h incubation at 37 °C, the old solution was discarded and formed formazan crystals was dissolved in DMSO (100 µL). The color developed was measured at 570 nm using a multiplate reader (Synergy HT, Bio-Tek, Winooski, Vermont).
Lactate Dehydrogenase Assay
Cytotoxicity was estimated by measurement of lactate dehydrogenase (LDH) efflux from damaged cells into the medium. The HepG2 cells at 1 × 10⁵ cells/mL were treated with different concentrations of cypermethrin (0, 5, 15, 40 ng/mL) for 24 and 48 hours, at 37°C in 5% CO2. The LDH efflux released from HepG2 cells, which represents cell death (necrosis), was determined using an LDH kit (In vitro Toxicology Assay Kit Lactate Dehydrogenase Based; Sigma, St Louis, Missouri) according to the manufacturer’s instructions.
Cytotoxicity was calculated using the following formula:

where
Measurement of ROS
Production of intracellular ROS was determined using H2DCFDA stain. Cells were plated in black 96-well plates. The HepG2 cells were exposed to different doses of cypermethrin for 24 and 48 hours in the presence of (100 mmol/L) H2DCFDA. Finally, the cells were washed with PBS, and relative fluorescence intensity was determined by spectrofluorometer at 480 nm excitation and 530 nm emission wavelengths.
A similar experiment (1 × 10⁴ cells/well in 96 well plate) was observed for ROS production by using fluorescent microscope (Nikon Eclipse 80i Tokyo, Japan).
Mitochondrial Membrane Potential Test
The uptake of the cationic fluorescent dye rhodamine-123 has been used for the estimation of mitochondrial membrane. 5 In this experiment, the seeded cells in 96-well culture plates were exposed to cypermethrin for 24 hours; then, the cells were washed with PBS, and 100 µL of rhodamine-123 (1 µmol/L) in PBS was replaced on the plates. Cells were put in the incubator (37°C, 5% CO2) for 15 minutes. Then, the supernatant PBS (containing unuptaked rhodamine-123) was removed and replaced by fresh PBS. Then, fluorescence intensity of rhodamine-123 was measured using upright fluorescence microscope by capturing the images at 40× magnification (Nikon Eclipse equipped; Nikon, Tokyo, Japan).
Preparation of Cell Extract and Oxidative Stress
The HepG2 cell lines were exposed to different concentrations of cypermethrin (0, 5, 15, 40 ng/mL) in 75-cm2 flasks for 24 and 48 hours. After exposure, cells was removed by trypsinization and centrifuged at 1000 g for 5 min. The pellet of cell was rinsed with PBS, and suspended in lysing solution (500 µL) (250 mM sucrose, 12 mM Tris-HCl, 0.1 mM DTT, pH 7.4). The cell extract was centrifuged (10000 g, 10 min, 4ºC) and supernatant was used for oxidative stress assays such as lipid peroxidation (LPO), glutathione (GSH), superoxide dismutase (SOD), and catalase. Protein concentration in the cell extract was estimated by the Bradford method. 6
Thiobarbituric Acid Assay
The thiobarbituric acid (TBA) assay was used to determine the malondialdehyde (MDA) content. 7
Glutathione
The GSH was estimated by the method of Saldak and Lindsay. 8
Superoxide Dismutase
The SOD activity was determined according to the method of Kono 9 using Nitro blue tetrazolium (NBT) in the presence of riboflavin.
Catalase
Catalase activity was measured using the method described by Aebi. 10
Caspase-3 activity and Hoechst 33342 Staining for Chromosome Condensations
Caspase-3 activity was observed from the cleavage of the N-acetyl-DEVD-
The qualitative analysis of normal and condensed chromatin in cells was performed through the Hoechst 33342 staining test, and it is based on apoptosis convinced typically nuclear fragmentation and condensation. After exposure to cypermethrin for 24 hours, the cells were incubated with a mixture of Hoechst 33342 (10 µL). After 30 minutes of incubation, the cells were washed 3 times with normal PBS. The condensed chromosome was observed using fluorescence imaging in the upright microscope (Nikon Eclipse equipped).
Single-cell gel electrophoresis Assay
The single-cell gel electrophoresis assay was done according the method of Singh et al. 11 Cells were cultured in 6-well plates. After 24 hours of incubation, cells were treated with cypermethrin (0, 5, 15, 40 ng/mL) for 24 and 48 hours. The base slide with 1% normal melting agarose was prepared and dried for 30 minutes; after that 1% low melting agarose (80 µL) with a cell suspension (20 µL) was added and spread with cover slip kept at 4°C for hardening. The third layer was prepared using 0.5% low melting point agarose (LMA) (80 µL) spread kept at 4°C for hardening, and the cover slip was removed. All slides were dipped in lysis solution overnight at 4°C. Further, electrophoresis was performed at 24 mV for 30 minutes. The slides were neutralized with buffer for 5 minutes and stained with EtBr. Olive tail moment (OTM) and percentage tail (%) DNA were used to measure DNA damage in the cells. Images from 50 random cells (25 from each replicate slide) were analyzed for each experiment using Comet Software (Komet-5.5, Kinetic Imaging Andor Technology, Nottingham, UK) attached to a fluorescent microscope (Leica) equipped with appropriate filters.
Western Blot Analysis
HepG2 cells (5 × 10⁵) were seeded in per well of plate (six well) for 24 h. HepG2 cells were exposed to cypermethrin (40 ng/mL) for 48 h. The cells was scrapped and rinsed thrice with chilled PBS and PI. The quantity of protein was examined by using Bradford method. 6 The separation of sample protein was done by SDS-polyacrylamide gel electrophoresis (10%), allocated on poly vinylidine fluoride membrane and nonspecific points was blocked with dry fat free milk for 60 mn. The selected primary antibodies were diluted (1:1500) as the manufacturer’s information and put membrane 24 h at 4ºC. Later the membrane was rinsed triple times with Tris Buffered Saline Tween-20 and secondary antibodies (horseradish peroxidase) was mixed (1:20000) and put for 120 mn. Later the incubated membrane was rinsed with PBS and protein bands are observed using an immobilon chemiluminescent HRP substrate (Millipore Trinidad and Tobago - Western Scientific Co. Ltd).
Statistical Analysis
The one-way analysis of variance (ANOVA) was used to analyze the average significance of data between control and exposure concentration within duration and the differences were noted (
Results
The HepG2 Cells
The morphological changes in HepG2 cells after exposure to cypermethrin for 24 and 48 hours were observed under an inverted microscope (Innovation Way, Carlsbad, California). The cells were normal spindle shape at lower concentration, but they became round shape at a higher concentration at 48 hours (Figure 1).
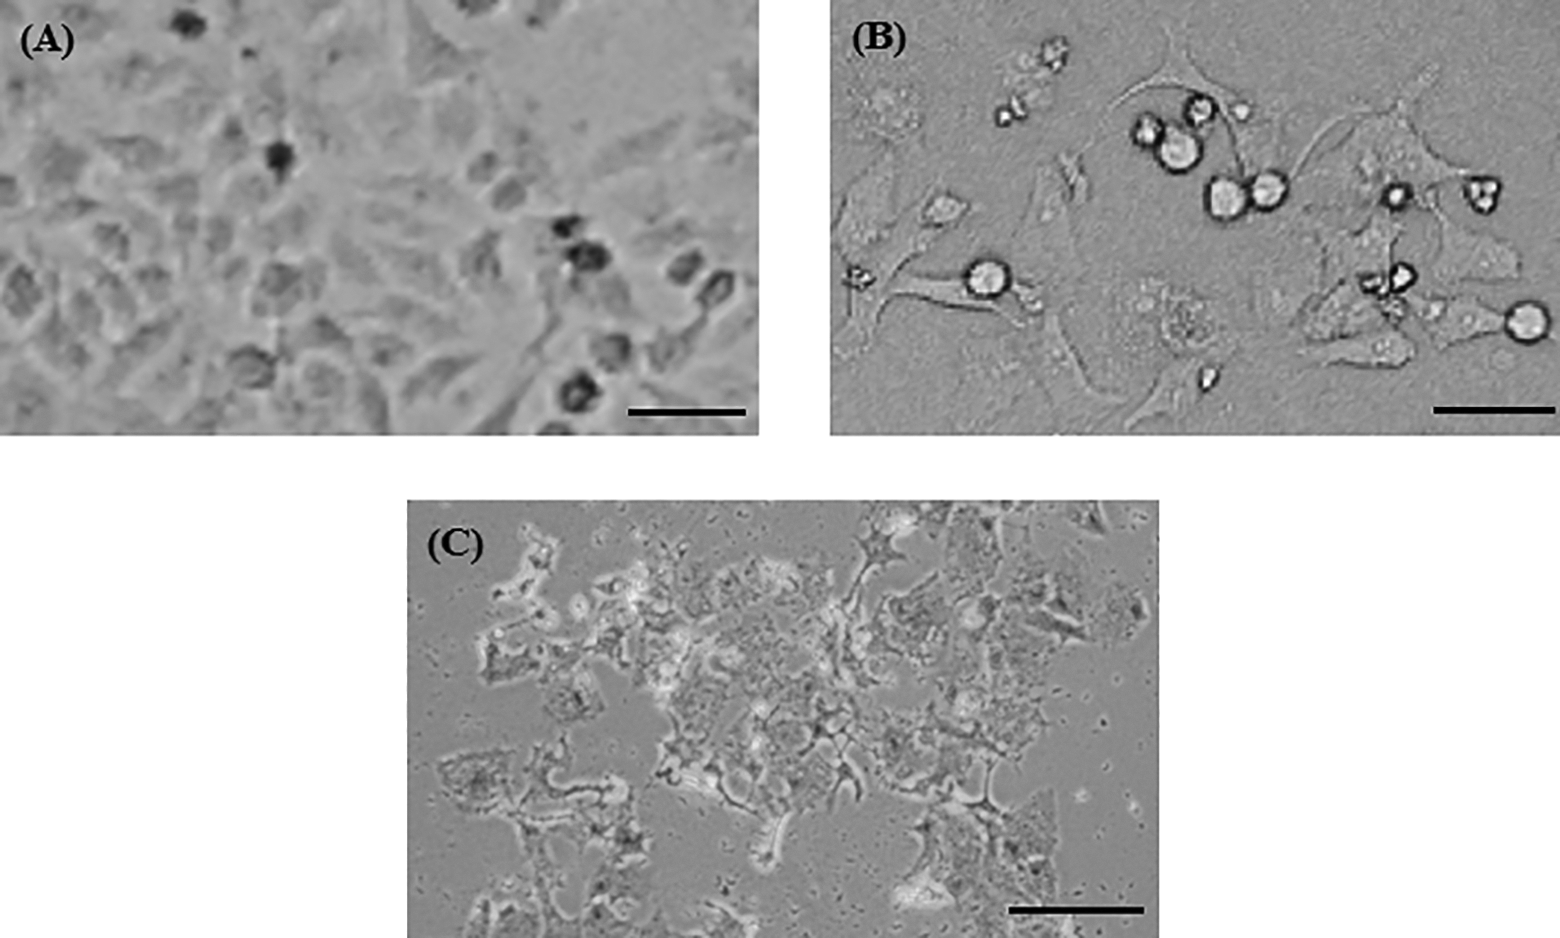
Alteration in morphology of human hepatocarcinoma (HepG2) cells. A, Control. B, At 40 ng/mL of cypermethrin for 24 hours. C, At 40 ng/mL of cypermethrin for 48 hours.
Cytotoxicity
Figure 2A shows percentage cell viability in HepG2 cell line through MTT test. The toxic effect of cypermethrin at different concentrations (0, 5, 15, 40 ng/mL) was noted as percentage cell viability. The highest toxicity of cypermethrin was observed at 40 ng/mL for 48 hours, and cell viability dropped up to 57.8% (

Cytotoxicity of cypermethrin in human hepatocarcinoma (HepG2) cells for 24 and 48 hours, as measured by (A) MTT and (B) LDH assays. Each value represents the mean ± standard error (SE) of 3 experiments. *
Intracellular ROS generation, MMP, and Oxidative Stress
Cypermethrin-exposed HepG2 cells showed a significant enhancement in the generation of ROS in terms of DCF florescence intensity. Florescence intensity increased to 87% at 24 hours and 160% at 48 hours at 40 ng/mL cypermethrin exposure compared to control (Figure 3A–C).

Cypermethrin induced ROS in human hepatocarcinoma (HepG2) cells. A, Control. B, At 40 ng/mL of cypermethrin for 48 hours. C, ROS generation (%) in HepG2 cells. Images were snapped in phase-contrast cum fluorescence microscope (Nikon, model 80i). Each value represents the mean ± standard error (SE) of 3 experiments. *
Rhodamine-123 is widely used to make dynamic measurements of MMP both in vitro and in situ because MMP is proportional to uptake of rhodamine-123, 11 and its changes are always associated with the cell apoptosis. After cypermethrin (0, 5, 15, and 40 ng/mL) exposure to cells, a dose-dependent decrease in MMP was observed, indicating that mitochondria were depolarized (Figure 4).

Cypermethrin-induced mitochondrial membrane potential in human hepatocarcinoma (HepG2) cells. Images of 3 qualitative analyses in fluorescence microscope. Scale bar is 200 µm.
Cypermethrin-induced oxidative stress was determined using 4.84 nmol/L TBARS (MDA) in HepG2 cells at 40 ng/mL exposure for 48 hours (Figure 5A). The level of GSH declined in a dose- and time-dependent manner due to cypermethrin exposure (Figure 5B). In cells treated with cypermethrin, there was an increase in SOD and CAT activity compared to the untreated cells (Figure 5C and D).

Levels of (A) LPO, (B) GSH, (C) SOD, and (D) catalase activity in human hepatocarcinoma (HepG2) cells after exposure to cypermethrin for 24 and 48 hours. Each value represents the mean ± SE of 3 experiments. *
Chromosome Condensation and Caspase-3 Activity
Later treatment of cypermethrin showed enhanced apoptosis which was measured by caspase-3 activity and Hoechst 33342 staining assays in HepG2 cells (Figure 6). The assays are based on enzyme activity and nuclear condensation and specific for apoptosis. The live cells exhibited normal intact nuclear chromatin with blue fluorescence, but apoptotic cells have fragmented chromatin. Cypermethrin treatment illustrated a significant number of apoptotic cells when compared to control.

Chromosomal condensation and induction of caspase-3 activity in human hepatocarcinoma (HepG2) cells after exposure to cypermethrin. A, Control. B, At 40 ng/mL cypermethrin for 48 hours. C, Caspase-3 activity. Each value represents the mean ± standard error (SE) of 3 experiments. *
DNA Damage
Cypermethrin induced a significant increase in DNA damage in hepatic carcinoma cells in a dose- and time-dependent basis. In terms of percentage, the group exposed to 40 ng/mL showed an increase of 29.87% for 24 hours and 41.45% for 48 hours compared to control (Figure 7).

DNA strand breakage in human hepatocarcinoma (HepG2) cells due to cypermethrin. A, Tail DNA (%). B, Olive tail moment. C, Control cell. D, At 40 ng/mL of cypermethrin 48 hours. Each value represents the mean ± standard error (SE) of 3 experiments. *
Western Blot Analysis
The result of Western blot data showed that there is a significant increase in the expression of Bax–bcl2 ratio in cypermethrin-exposed cells compared the control group. Further, significant increase in the expression level of caspase-3 was found in cypermethrin-expressed cells than the controls. Furthermore, the cytochrome c level compared to control confirms mitochondrial-mediated apoptotic cell death in HepG2 cells (Figure 8).

Western blot analysis of the protein involved in apoptosis due to cypermethrin for 48-hour exposure. A, Bax, Bcl2, cytochrome–c (Cyto-C), caspase-3 activation. β-actin was used as internal control to normalize result. B, Relative quantification of protein expression levels. Results represent average ± standard error (SE) of triplicate experiments. *
Discussion
The concern of toxicity with reference to pesticides has been one of the key dilemmas in human health in the past few decades. However, pesticides were developed to control pests for more and safe production, but several pesticides have presented prospective risks to human health and the environment. Kavvalakis et al 12 have reported residue of cypermethrin metabolites in rabbit hair. Nevertheless, only a few of these compounds are tested for molecular toxicity and carcinogenicity prior to their use. In this study, we have observed toxic mechanism of cypermethrin in HepG2 cells. The data of the present experiment revealed that the cell viability of HepG2 cells was decreased due to cypermethrin exposure. The reduction in viability of cells might happen due to increase in necrosis or apoptosis. The treatment of cypermethrin was induced cell death as evidence from cell viability assay. The viability of cells was reduced due to cypermethrin exposure for 24 and 48 h. The harmful effect of cypermethrin on HepG2 cells further confirmed by the raised LDH activity. Baracca et al. 13 and Kmetic et al., 14 has reported reduction of growth of CHO-K1 cell line and human fibroblast (DET 551) cells due to cypermethrin treatment, respectively. Oxidative stress is the result of the redox deficiency in the organism and can cause damage to biomolecules, such as DNA, lipids, and/or proteins (Kouretas et al). 15
Researchers have reported that various ways of toxicity that lead to prevention of growth of cells. We hypothesized that one of a probable clarification for the reduction of viability of HepG2 cells might be the exposure of cypermethrin, which was inducing apoptosis in hepatic cells. To, confirm our hypothesis, we have observed that cypermethrin exposed cells displayed more DNA damage and number of HepG2 cells with apoptotic and necrotic morphology as evidence of fragmentation of nucleus and condensation of chromatin. Further we have examined the activity of caspase-3 enzyme to confirm role of cypermethrin in apoptotic HepG2 cells. The data showed that caspase-3 activity was increased 1.3 fold in cypermethrin exposed HepG2 cells as compared with control.
For robust understand the molecular mechanism of HepG2 cell death after exposure of cypermethrin, we have observed its oxidative damage. The data of current observation indicate that treatment of cypermethrin induced significant production of ROS and oxidative stress as proved in increased lipid peroxide and reduced glutathione. These observations are in agreement with earlier findings of Taju et al 16 that cypermethrin affects fish cell lines. On the other hand, we have observed that SOD and CAT levels increased to minimize cypermethrin cell toxicity.
We found that cypermethrin induced ROS generation and decreased the expression of bcl-2. Molecular markers of cell death, bax–bcl2 ratio, cyt-c, and caspases-3, showed an increase in apoptosis compared to control upon the treatment with cypermethrin, and the exposed cells showed significant DNA damage (% tail and OTM), a characteristic of apoptosis. The induction of genotoxicity and oxidative stress as observed in our study is in accordance with the observations of Vardavas et al 17,18 in liver cells of male rabbit for cypermethrin and piperonyl butoxide.
In addition, the expression of proteins involved in apoptotic pathways was upregulated following cypermethrin treatment. Both Bax/bcl-2 and casp-3 and mitochondrial factor cytochrome c induced intrinsic/extrinsic pathway of apoptosis. 19 Our results in Figure 8B indicate that cypermethrin induced caspase-3 activity and cytochrome c protein expressions. These data imply that ROS-mediated mitochondrial-dependent pathways are involved in cypermethrin-induced apoptosis.
On the basis of these observation in the present study, we hypothesized that cypermethrin changed the Bcl-2 proteins level and then it regulates a progressive of mitochondria-mediated downstream molecular events resulting in the activation of caspase-3.
Conclusion
Our experiments shows that cypermethrin induces nuclear condensation and a number of apoptotic cells induced. Our acute exposure study of induction of apoptotic response of cypermethrin will be needed to further explore and confirm whether long-term exposure consequences may exist for cypermethrin application.