
Abstract
Introduction
Metal 3D printing is a rapidly advancing manufacturing technology that enables the production of complex lattice structures with high precision and accuracy. 1 Lattice structures offer unique mechanical properties, including high strength-to-weight ratios, energy absorption, and improved heat transfer, making them ideal for a variety of applications in industries such as aerospace, biomedical, and automotive.2,3 In this process, a high-powered laser beam is used to selectively melt and fuse metal powders, layer by layer, until the final lattice structure is formed. The manufacturing process parameters such as laser power, scan speed, layer thickness, and powder characteristics play a crucial role in determining the final properties of the lattice structure. 4 Overall, metal 3D printing is a promising manufacturing technology that has the potential to revolutionize the design and production of lattice structures. 5
Recent studies have investigated the mechanical properties of lattice structures fabricated using metal 3D printing. Guo et al. 6 highlighted the importance of lattice geometry, material selection, and processing parameters in achieving desirable mechanical properties. Yu et al. 7 found that hierarchical honeycomb lattice structures exhibited high specific strength and stiffness, as well as good energy absorption capability. Wu et al. 8 reported that hierarchical lattice structures exhibited superior mechanical properties, including high specific strength, good energy absorption capacity, and excellent fatigue resistance. Siddique et al. 9 investigated the mechanical performance of hierarchical honeycomb lattice structures fabricated using direct metal laser sintering and found that they exhibited excellent mechanical properties, including high specific strength and stiffness, good energy absorption capacity, and good fatigue resistance.
However, despite the growing interest in the mechanical properties of lattice structures, there is still a need for further investigation into the behavior of different lattice structures under different loading and heat treatment conditions. In this study, the aim is to investigate the mechanical properties of three different lattice structures, namely face-centered cubic (FCC), body-centered cubic (BCC), and octet truss (OT), with different strut and cell size and fabricated using metal 3D printing. The lattice structures will be tested under tensile and compression loading conditions to evaluate their strength and stiffness with different heat treatment conditions. The specimens were modeled and simulated using a software called nTopology. The findings of this study will contribute to the understanding of the mechanical behavior of different lattice structures fabricated using metal 3D printing and their potential for use in various engineering applications.
Thus, with this study it is of the author’s interest to bring another angle of understanding on how someone may be able to adjust the structural performance of these lattice topologies by means of manipulating the matrix material properties via heat treatments. In other words, we hope to find out if the performance of the same topology could be altered and applied to different situations by simply implementing a different heat treatment procedure, rather than trying to find a completely different topology all together for the application.
Materials and methods
Materials, fabrication, and lattice geometry
The lattice structures were designed using computer-aided design (CAD) software nTopology and fabricated using the direct metal laser sintering (DMLS) technique. The machine used in this process is EOSINT M280 as shown in Figure 1(a). The DMLS process parameters were optimized to achieve high-quality lattice structures with minimal defects. The material used in this process is a high-strength metal alloy, maraging steel (EOS MS1), to ensure sufficient mechanical strength. The properties of the steel are listed in Table 1, which come from the manufacturer’s datasheet

Metal 3D printing system and SEM and image of maraging steel powder: (a) EOSINT M280 machine, (b) SEM imagery of EOS MS1, (c) SCIOS_2 SEM.
Maraging steel powder’s material data sheet.

Maraging 300 is a type of maraging steel manufactured by that is commonly used in metal 3D printing applications due to its excellent mechanical properties and high strength. It is composed of 18% Nickel, 8% Molybdenum, 5% Titanium, and 0.7% Aluminum, with the remainder being Iron. The alloy is heat-treated to form a martensitic microstructure, which results in high strength and excellent toughness.10,11 Maraging Steel is broadly used in the aerospace industry for its weldability, high ductility and easy to machine. 12 Its property and wide range of applications creates an interest in most researchers in metal 3D printing.
The powder exhibits particle sizes range from 10 to 50 μm, with a mean particle size of 23 μm as depicted in Figure 1(b). Table 1 provides an overview of the mechanical and thermal properties of the EOS MS1 powder, alongside its composition and characterization.1,13 A ThermoFisher Scientific SCIOS DualBeam Scanning Electron Microscope (SEM) was utilized to magnify the image of the metal powder, as illustrated in Figure 1(c).
The lattice geometry selected for this study are Body Centered Cubic (BCC), Face Centered Cubic (FCC), and Octet Trust (OT). The lattice structures were designed and printed in three different topologies, consisting of BCC, FCC, and OT. These lattice structures have been studied for different mechanical properties and applications.13–15 Moreover, Regarding the topologies of BCC, FCC, and OT were decided based on their compatibility with minimum build angle and their proven manufacturability.16–18 Table 2 provides the labeling guidelines for the structures and Figure 2 shows the specimens used for mechanical testing. Figure 2(a) shows the nTopology sample designed for tensile and compression testing. Each of the lattice samples were designed to have a unit cell size of 1, 1.5, and 2 mm, as shown in Figure 2(b). Two strut sizes were used of 0.25 mm denoting
Sample labeling guidelines.

Design and fabrication of lattice samples: (a) compression and tensile CAD model, (b) unit cells design of three different lattice structures, (c) 3D printed sample arrangement on build plate.
Post-processing and heat treatment
Post processing
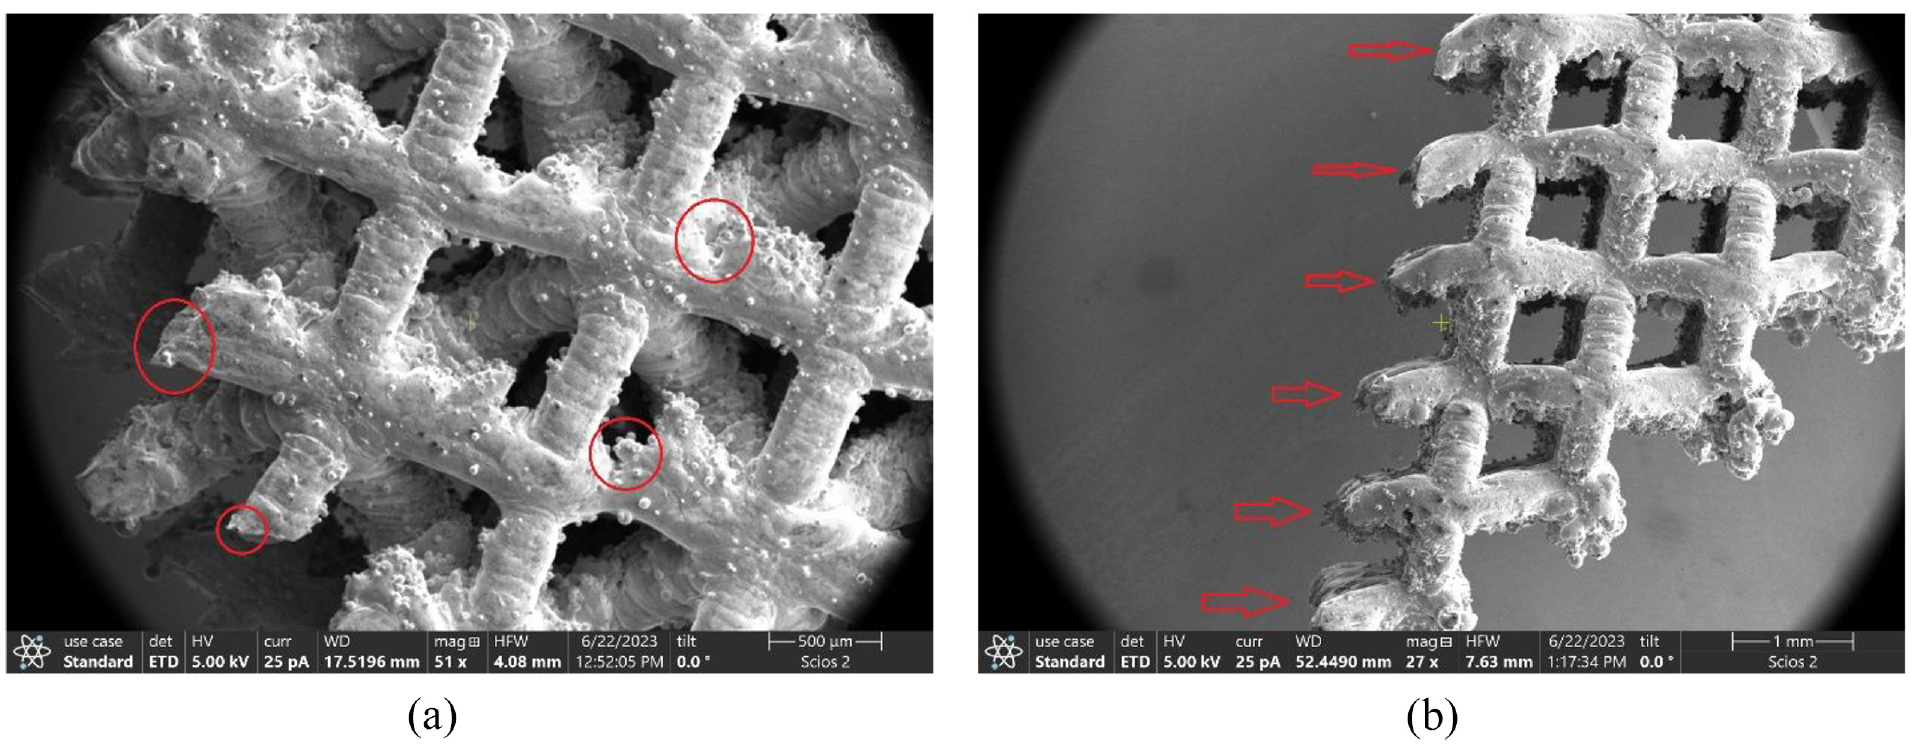
The post-processing of the specimens commenced by gently dislodging them from the build platen using a mallet and a towel to ensure the parts remained undamaged. After removal, a straightforward grinding process was conducted on the support surface to eliminate any remaining material, thereby ensuring that the integrity of the testing results remained unaffected. The part produced was examined using SEM SCIOS DualBeam. It was noted that the thickness of the manufactured part was nearly double the intended design, as depicted in Figure 3(a). To remove debris and residual unmelted metal powder, a Chempolishing (CP) process was carried out. Prior to the CP process, the sample underwent cleaning intervals using digital ultrasonic cleaner with acetone, isopropyl alcohol, and deionized water. For the CP process, the chemical bath consisted of 10%–30% phosphoric acid, 1%–10% hydrochloric acid, 1%–10% nitric acid, and 1%–10% proprietary surfactants. Maintaining the optimum bath temperature at 75°C throughout the process was crucial. Any temperature increase could trigger an exothermic reaction, leading to contamination of the bath and unnecessarily accelerating the polishing rate. Effective agitation, facilitated by a 20 mm magnetic stirrer operating between 200 and 220 rpm, played a vital role in dispersing localized heat and ensuring uniform heat distribution, thus expediting the removal process. After 60 min of dissolution, the sample underwent rinsing with distilled water and drying with hot pressurized air. The outcome of this process is illustrated in Figure 3(b). This experimentation highlighted the possibility of achieving the desired strut thickness by optimizing the duration of the CP process.

SEM image of metal 3D printed BCC large (L) strut size lattice structure: (a) measured as manufactured, (b) measured after 1 h of Chem-polishing.
Heat treatment
The samples manufactured underwent different heat treatment processes to achieve desired material properties. The processes included annealing, normalizing, age hardening, and carburizing heat treatment. The heat treatment process utilized an Evenheat device with a power rating of 4320 W.
In the age hardening process, the material underwent heating to 550°C for a duration of 6 h, followed by cooling in the oven. This method serves to bolster the material’s strength by causing alloying elements to precipitate out of the solid solution, thereby dispersing them more finely throughout the material. Carburizing was done by placing the specimens inside a container of activated charcoal and a fractional amount of sodium bicarbonate to act as an accelerator for the carbon atoms to defuse into the specimen. The specimen was then heated at 938°C and soaked for 4 h. Once time was up, specimens were then oil quenched in 5W-30 motor oil and patted dry once room temperature was reached.
During annealing heat treatment, specimens were gradually heated to 835°C, held at this temperature for 1 h, and subsequently cooled in the oven until reaching room temperature. For the normalizing process, specimens were gradually heated to 835°C, soaked for 1 h, and then cooled in air. This procedure has similar results and concepts to annealing but has a faster rate of cooling which can save time.
A more thorough analysis of how these heat treatments effect maraging steel 300 can be found in a previous work done by the authors. 19
Methodology
Tensile and compression testing
Tensile and Compression testing was performed by preparing the samples based on ASTM E8 and E9 standards for testing metallic materials respectively.20,21 The tensile specimens adhere to sub sized dimensions called out in E8 and the compression specimens are dimensioned at 13 mm in diameter and 25 mm in height. The rate of positional change for both tests happened at 0.4 mm/mm/min on the Admet Expert 2653 50 kN tension/compression machine shown in Figure 4.

ADMET Expert 2653 tensile and compression testing machine.
This procedure was performed to determine mechanical properties, including ultimate strength, yield strength, modulus of elasticity, and energy absorption capacity. The test results will be compared with each other with respect to lattice structure, strut size and types of heat treatment to determine how these configurations impact the tensile performance of the test samples potentially affecting stress distribution, strain rate sensitivity, and fracture mechanisms. The heat-treated specimens were compared with the control group for the mechanical properties to assess the effectiveness of lattice structures in improving the mechanical performance of materials. Studies show that heat treatment of 3D printed maraging steel, aluminum, or titanium lattice structures exhibits microstructural changes and alters mechanical properties significantly.22–24
The objective of this study is to investigate the mechanical properties of three different lattice structures, namely BCC, FCC, and OT fabricated using metal 3D printing. The lattice structures were heat treated and tested under tensile and compression loading conditions to evaluate their strength and stiffness and compared with the control group which is without heat treatment.
Meshing and simulation in ANSYS mechanical
Furthermore, tensile pull simulations were also carried out in ANSYS Mechanical. The geometries of OL, FL, and BL were simulated under the conditions and results that they experienced during the tensile test. The meshes for this simulation were created using nTopology and were designed to have a high node density, ranging from 500,000 to 2,000,000 nodes depending on the topology, Meshes were then exported as a .inp file into ANSYS, and were simulated with material properties and displacement values obtained in previous experimental data gathered for maraging steel and tensile test data respectively.
Simulation results were then charted using Von Mises and the sum of the elastic and plastic strain values. This output was created by using mechanical property data previously obtained from a previous work done by the authors 19 to obtain plastic deformation behavior of the material such that these structures could be simulated to failure.
Results and discussions
Morphometry analysis
Morphometry analysis was performed using SCANCO_MEDICAL µCT 100 shown in Figure 5. The main purpose of this scanning is to determine the connectivity and porosity of the lattice structure. The printing parameters were laser power of 400 W, scanning speed of 700 mm/s and laser beam diameter of 70 µm. To observe the inside feature of the 3D printed part µCT Xray scan was done, and the results were analyzed.

SCANCO MEDICAL µCT 100.
This analysis explored three distinct lattice structures, large strut sizes labeled as BL, FL and OL. MicroCT parameters for metallic components usually are 90 KVp, 155 µA, and 14 W. The analysis was done for the 2 mm thickness of the given 3D printed cylindrical metallic part of diameter 13 mm. Table 3 shows the summary of the Morphometry analysis. MicroCT measured total volume of different lattice structures are varied due to the selection in the process.
MicroCT volume morphometry analysis.

Comparing the results of the ratio of IOV/MTV and MOV/MTV the change is clearly shown that after 3D printing the size I significantly increased up to 13%. As shown in Figure 6 the comparison clearly shows that after printing the size increased. To bring the percentage of change to an agreeable point the research must be improved to optimize the process parameter.

Percentage of change of volume of ideal versus 3D printed.
The thickness significantly increased for face centered and Oct strut lattice structure. AS shown in Figures 7(a) and 8(a). For the FL the scanned parameter had a design thickness of 0.3 but it came out to be 0.46 mm and for OL the struct size was 0.25 mm and the measured amount was 0.28 mm. This significantly changes the overall volume. The 3D image taken by the MicroCT for BL is shown in Figure 9. In this reading the total 3D image, the thickness is supposed to be 0.3 mm but after the print it becomes 0.57 mm as shown in Figure 9(b). This result is also reflected in Table 3. The spacing shown in Figure 9(c) is the negative image of the object space shown in Figure 9(a). With this analysis, since the dimensions of these struts found in the topologies varies from the designed specimens, it would influence the overall stress experienced by this structure.

Large strut size of face centered lattice structure: (a) 3D scan, (b) thickness, (c) spacing.

Oct strut lattice structure: (a) 3D scan, (b) thickness, (c) spacing.

Large strut size of body centered lattice structure: (a) 3D scan, (b) thickness, (c) spacing.
Mechanical testing
One of the research’s objectives was to investigate the mechanical property of different lattice structures. To accomplish this two different destructive testing methods were conducted. The tensile and compressive testing result shows significant characteristics of lattice structures.
Tensile testing
To get the tensile effect of each struct throughout the lattice structure length the part was designed in a unique way using nTopology CAD software. At the grip area of the lattice surface was covered by 1 mm thick solid material as shown in Figure 10. This design was suggested to avoid distortion and damage to the grip area of the lattice structure. The outcome shows that the design was prone to any unwanted results, and it allows the neck formation to be in the desired area.

Specific design of a tensile specimen.
Tests were done using ADMET tensile testing machine for different lattice topology, strut size and different heat treatment. Accordingly, the data were collected and analyzed. The comparative graph of different lattice samples of different topologies subjected to different heat treatment are shown in Figure 11. The results consistently reveal higher strength and toughness for the OT topology compared to the same strut size and unit cell of the BCC and FCC specimens. All Figures share the same scale so that the direct comparison of magnitude between different heat treatments and different topology are showing clear result to understand the performance of the lattice structure at different heat treatment condition.

Tensile test of different topology and different heat treatment from top to bottom: (a) age hardening performance of the different topologies, (b) annealing performance, (c) normalizing performance, (d) carburizing performance.
The tensile test of the BCC lattice structure reveals consistent fracture phenomena across all conditions. A shear line is consistently observed at a 45° angle. As depicted in Figure 12, the fracture regions of the tensile test specimen of the BCC lattice structure align with the von Mises stress distribution. Fracture precisely occurs along the 45° shear plane due to sequential failure in the strut joint regions, as illustrated in Figure 12(a), owing to the accumulation of stress concentrations. This observation is consistent with findings from other studies on BCC lattice structures.13,25

Fracture analysis of tensile test and SEM image showing line of fracture: (a) tensile test results, (b) SEM image of BCC topology for age hardening.
For a closer examination of the fracture mechanism, Figure 12(b) displays the fracture line of the BCC lattice structure after age-hardened heat treatment. The SEM image reveals a straight-line fracture, indicating a sudden and brittle fracture. This observation is specific to the age-hardened heat-treated part, where no elongation or neck formation is evident on any strut, further confirming the brittle nature of the failure.
The control group in this experiment is for a part without any heat treatment process. Hence all strut size and lattice topology were subjected to the same amount of tensile force as that of the previous heat-treated part. Figure 13 shows the experimental data from the control group. It is worth mentioning that the cross-sectional area of the Octet group is significantly larger than the other two cell topologies due to its design. As a result, the octet lattice has a larger area under the curve (toughness) but does not achieve the peak stress observed in BCC and FCC samples.

Tensile test for control group.
The maximum stress for the control group was achieved at 1359 MPa, whereas the age-hardened group achieved a maximum stress of 1989 MPa. The tensile results also indicate that larger strut sizes correspond to higher tolerable stresses, which is logical since stronger and more robust building blocks can withstand greater loads. The fracture analysis of SEM image shown in Figure 14 illustrates for the control group without heat treatment, displaying a neck formation at different point. In the case of OT topology shown if Figure 14(a) shows elongation and fracture points at different strut. More neck formation for BCC topology is shown in Figure 14(b) and the line of fracture at 45° shear line shows elongation of struts at different points.
Fracture analysis SEM image of control group: (a) OT topology; (b) BCC topology.
Taking the aggregate data collected, the FCC lattice displayed a yield strength nearly twice that of the BCC topology, reaching 6521 newtons of force. In contrast, the BCC lattice had a lower yield strength, with a maximum force of 2831 newtons. However, it should be noted that the BCC lattice topology exhibited greater ductility than the other two lattices, stretching by 0.472 mm before failure.
In comparison, the age-hardened specimen exhibited the poorest ductility among the three lattices, stretching only 0.23 mm before failure. The body-centered cubic lattice demonstrated slightly better ductility, stretching by 0.32 mm. These results emphasize the significance of considering both strength and ductility when selecting the appropriate lattice topology for a specific application.
The tensile behavior of the result obtained differs from what is reflected by other researchers. In the presented studies13,26 the tensile behavior of these strut-based lattices reflects similar elastic performance, but the ones presented in the peer papers have significantly more plastic deformation before failure. It is to be noted that the strut thicknesses for the specimens in this research work are much larger than ours by an order of magnitude. This may be the reason our struts failed sooner due to the increase in stress concentrations for the smaller geometries, which could make it less tolerant to plastic deformation.
Compression test
The topology and strut size of compression specimens are the same as tensile specimens. The compression test performed was only for two types of heat treatment processes, age hardening, and annealing. Figure 15 graphically represents the compression data gathered for the age-hardened and annealed specimens for different topologies and strut sizes.

Compression test of age hardening and annealing heat treatment: (a) age hardening, (b) annealing.
The compression data exhibits greater variability in results compared to the tensile data. As seen in Figure 15, the BM and FL structures exhibit a wavy signature in their graphs during compression, indicating that different cells failed throughout the process. In contrast, the age-hardened BL specimen failed all at once with a 45° shear plane.
The control group compression result shown in Figure 16 the deformation of BCC structure is uniform, and the lattice structure bulged outside. This will cause 45° shear plane deformation, but the FCC topology deformation shows strength on the external boundary line due to its inherent cell shape. These findings suggest that if toughness is the primary desired attribute, then age hardening is the preferred method to apply. However, if a higher energy absorption capacity and a more ductile material are required, an alternative heat treatment or sticking with the BCC or FCC group may be more appropriate.

Compression deformation close-up of BCC and FCC topologies: (a) BCC topology, (b) FCC topology.
Comparing the age-hardening compression test result with the control group it is evident that the control group allows for greater elongation, producing a more ductile product, as shown in Figure 17. The BM specimen achieved a strain of 0.34 mm/mm for both the control and age-hardened groups. However, the curve for the control group exhibits a more linear and nearly horizontal pattern, suggesting a more consistent response to the applied stress. Conversely, the age-hardened group presents peaks and valleys in the curve, indicative of the cells in the structure breaking independently. This behavior could be attributed to the changes in the material’s microstructure due to the age-hardening process, leading to increased brittleness and reduced ductility. The difference in the stress-strain behavior between the control and age-hardened groups highlights the importance of considering the trade-offs between strength, toughness, and ductility when selecting the appropriate heat treatment method for a particular application. Unlike the control and age hardened result the annealing shows smooth curve resembles basic stress strain curve of steel material. This is a clear indication of rearrangement of microstructure of the control group through annealing heat treatment.

Compression test control group.
Other research was explored on the compressive properties and performance of graded strut-based. 27 In the research, the compressive behavior closely matches our specimens by the fact it experiences a similar elastic region early in the test, followed by yielding, plastic deformation, and densification of the cells as they collapse onto each other.
Simulation results
To further analyze the results of the tensile test, the authors ran simulations via nTopology to better gage where stress and strain concentrations are occurring in the geometry of the lattice. The samples that underwent simulation are BL and FL. When examining these topologies, it was necessary to consider the stress and strain values at failure from the experimental result. Once these values are recorded, they can be entered into nTopology’s software, which will then visualize the stress and strain distributions corresponding to those values. Figure 18 below illustrates the interface within nTopology used to adjust the analyzed values. Additionally, a simulated plot for the BCC unit cell for tensile behavior was implemented using ANSYS to help compare between simulated and experimental data’s mechanical properties.

Table of input values which change the color map superimposed on the lattice geometry.
Examining the BL topology revealed that the failure occurred along a 45° shear plane, as depicted in Figure 12. Analyzing the strain value at the failure point and utilizing simulation software via nTopology has yielded valuable insights into the locations of these failures within the geometry. Accordingly, Figure 19 illustrates the outcome of tensile loading, with stress concentration highlighted by red points indicating the fracture point.

Image shows the areas where the geometry has reached the critical strain value for failure based on the mechanical testing with the associated color map.
As seen, the areas which are red appear near the node point of the lattices. It’s additionally on the tension side of the strut as the specimen is loaded. This shows that the specimen is experiencing bending until it yields, which then transitions to pure tensile loading as the specimen approaches the critical strain value that occurs at fracture. And the associated stress at fracture is calculated to be roughly 886 MPa when you consider the minimum CSA of 2.031 mm2.The details are shown in Figure 20.

Image showing the strain value color map alongside the whole specimen.
Looking at FL, this structure had a flat fracture surface perpendicular to the loading direction. With the face-centered cubic structure, the struts at the faces help with the rigidity of the structure and with its deformation and load bearing capabilities. Below in Figure 21 shows the strain concentrations:

Cross-sectional view of the strain concentration center and a front view showcasing the horizontal face struts.
As seen, the strain concentrations align quite well. They align perpendicular to the loading direction, which aids in the visualization of where these failure points and stress concentrations are located, as shown in Figure 21(a). Also, the struts located at the horizontal faces have little stress distributions. This is likely since they are perpendicular to the loading direction. This also means they’re acting to rigidify the specimen or “harden” the specimen. This fact may contribute to the flat fracture surface since less of the energy was put into deforming the specimen, and more so to breaking the node, see Figure 21(b). The fracture stress of the FL sample was 1157 MPa with a minimum CSA OD of 3.64 mm2.
To compare between the two, it seems that BL elongated slightly less than FL, but the amount of deformation that occurred would be more since the struts would bend more so than that of FL. This makes sense because there are no horizontal face struts acting to rigidify the structure. The addition of the vertical face struts found in FL played a part in increasing the maximum fracture stress from 886 to 1157 MPa. This is also not considering that the minimum cross-sectional area for FL is also more than BL. Additionally, the distribution of stress found in the FL sample is better than that of BL since there are more struts to spread the load to more members. This is a contributing factor to the increase in fracture strength. Overall, FL performed better mechanically than BL in both experimental and simulated regimes.
The simulated and measured data sets differ quite a bit visually, for example the straining in the simulated data shown in Figure 22 is far more extreme than that of the measured data, Figure 23. This is mainly due to the difficulty of modeling failure behavior in ANSYS. Thus, the software will simply pull this specimen indefinitely. Though, it can be found that between the two data sets, the values of the experienced stress in the cells are quite similar, where the point of yielding in the simulated data charts a stress of 1248 MPa, and the control group stress value just before failure is 1260 MPa. Though, in the measured data there is not a plastically deforming region, and the BL specimen seems to fail in more of a brittle means.

Simulation stress-strain curve for the BL topology.

Tensile behavior of the BL topologies with different heat treatments.
Additionally, the simulated results have a much steeper elastic region than the measured data. The simulated results have a calculated Youngs Modulus of 152 GPa, whereas the experimental data’s is calculated at 28 GPa. This is likely caused by the rapid onset of deformation in the experimental data as the cells elongate under loading, as well as the material model for the simulated data being that of maraging steel. The standard followed for mechanical testing of these cellular structures is based on ASTM E8 to test the structures.
Conclusions
In summary, this study explored the additive fabrication of lattice structures using Maraging Steel material through the DMLS technique. Various cell topologies and strut thicknesses were tested to investigate their impact on the mechanical performance of the lattice structures. The mechanical behavior of the different cell topologies was experimentally evaluated through tensile and compressive tests, conducted in accordance with ASTM E8 and ASTM E9 standards, respectively. The findings of this study provide valuable insights into the design and fabrication of lattice structures using DMLS, with potential applications in various industries such as aerospace, automotive, and biomedical engineering. Furthermore, the use of Maraging Steel in this study offers promising possibilities for the development of high-performance lattice structures with superior mechanical properties.
In this study, the ultimate tensile and compression strength of lattice samples with different topologies were compared. The results indicate that octet topology lattices showed the highest strength due to having a significantly larger number of struts per unit cell compared to BCC and FCC lattices. It is worth noting that the FCC lattices demonstrated intermediate strength levels between the other two topologies. On the other hand, the BCC lattices exhibited the lowest ultimate strength and toughness, but showcased better ductility, making them suitable for applications that require significant stretching before failure. Overall, these findings highlight the importance of considering the type of topology in the design of lattice structures, as each topology has unique strengths and weaknesses that need to be considered for different applications.