
Abstract

Introduction
Dyes have a significant impact on the environment and human health. To combat this, many methods such as biological, chemical, and physical processes are used to treat dye wastewater.1,2 Among them, adsorption is cost-effective but traditionally involves toxic solvents. With an emphasis on sustainability, researchers are now focusing on using by-products to create environmentally friendly materials. Over the past decade, this approach has gained traction, reflecting the shift toward green technology. Fe2O3 (iron III oxide) synthesized by a green chemistry method using fruit peel extract represents a major step forward in the research of sustainable materials. This method is not only environmentally friendly but also uses by-products, contributing to minimizing negative impacts on the environment. Fruit peel extract contains biological compounds with strong reducing ability, which help to create Fe2O3 nanoparticles with uniform size and shape.
Iron(III) oxide (Fe2O3) materials synthesized by green chemistry methods were still quite limited. In Saima Noreen’s study, extracts from Fan palm, Dombeya wallichii, and Pyrus comminis leaves were used to synthesize iron oxide NPs. The results showed that the reactive blue dye was adsorbed at a capacity of 21 mg g−1 in 90 min. It can be seen that the dye removal efficiency was recorded as 90%. 3 Similar studies were performed by Saima on the pigment direct golden yellow. 4 In addition, Tugce Aydogan used citrus extracts to synthesize Fe3O4 and Fe2O3 to remove Congo red pigment. The colorant removal process only reached 36.5% (0.09126 mg g−1). 5 Psidium guajava leaf extract was used to synthesize γ-Fe2O3 for the purpose of removing methylene blue. The results showed that the adsorption capacity was recorded as 91.74 mg g−1 at a temperature of 40 °C. 6 This shows the potential of the material for dye removal adsorption applications. However, the removal efficiency is still quite low and the removal time is too long. This makes it difficult to apply the material to wastewater treatment systems. This is the highlight that allows researchers to expand the research direction and improve the adsorption capacity of the material.
In this study, the extract ethanol from orange peel (OP) by-product was used as a green solvent for the synthesis process. Taking advantage of green solvents helps the synthesis process avoid creating substances of new pollution. Orange is a fruit of the family Rutaceae, genus Citrus.7,8 Orange varieties have been bred and grown in many parts of the world, of which the sub-equatorial and equatorial regions are the places with the largest orange growing areas and orange production. 9 According to the Food and Agriculture Organization of the United Nations, Vietnam is also one of the countries with orange growing area accounting for 1.9% compared with the world and 4.7% compared with countries in Asia. Vietnam’s orange production accounts for 2.1% of the world’s orange production. The amount of orange by-products discharged into the environment is quite large, accounting for 44% of the total fruit output after harvest. 9 OP contains many natural compounds such as flavonoids, limonoids, alkaloids, essential oils, pectin, and organic acids, 10 in which organic acid ingredients such as limonene, 1-octanol, 3,7-dimethyl-1,6-octadien-3-ol (β-linalool), α-Terpineol, 3,7-dimethyl-6-octen-1-ol (cis-geraniol, β-citral, guariol (lemonol), and (E)-3,7-dimethyl-2,6-octadienal can be found. 11 The components in OP all contain free functional groups such as β-linalool; 1-octanol contains OH group; limonene, α-terpineol contains CH3 and CH2 group; guariol contains CH3 and OH group; β-citral contains CH=O and CH3 group; (E)-3,7-dimethyl-2; and 6-octadienal contains CH3 group and =O bond. These compounds contribute as reducing agents in the synthesis of Fe2O3. After synthesis, Fe2O3 is used to evaluate the ability to adsorb or remove organic dyes. In addition, factors affecting the adsorption process are also evaluated at the level of influence and optimal adsorption conditions for the material. Adsorption kinetic and isotherm models were also conducted to predict the adsorption process or mechanism that may occur when the adsorbed material and dye molecules exist in water.
Materials and methods
Pretreatment and chemicals
After collecting, OP was washed to remove dirt and damaged parts. It was dried at 50 °C for 48 h to remove water. Afterwards, OP was fine crushed into powder. Sodium hydroxide (NaOH), iron(III) chloride hexahydrate (FeCl3.6H2O), and ethanol (⩾ 95% purity) were obtained from Xilong scientific Co., Ltd. Methyl blue (MB), brilliant green (BG), Congo red (CR), and methyl red (MR) were obtained from Sigma-Aldrich Co, Switzerland.
Preparation of extracted OP and synthesis γ-Fe2O3
The extraction method used to extract OP was the maceration method. 1 g of OP powder was added to 15 mL of 70% ethanol in Erlenmeyer for 24 h, at 30 °C. The extracted solution was filtered in a Buchner flask to remove OP powder. The OP extract was maintained in tube samples in a refrigerator at 10 °C ± 5 °C. The synthesis of gamma ferric oxide (γ-Fe2O3) nanoparticles was based on Mohsan Bashir and Brajesh Kumar’s research with some modifications, as shown in Figure 1. 12

γ-Fe2O3 material synthesis process.
FeCl3.6H2O was added to 100 mL of deionized water at a concentration of 0.1 M and stirred at 70 °C for 60 min; 100 mL of OP extract was slowly added to the Fe3+ solution and stirred at 70 °C for 60 min; 50 mL (1 mM) of NaOH was slowly added to the solution every 30 min. The solution during this process will change from yellow brown to brown (added extract) and then turn black (added NaOH), indicating the formation of colloidal iron oxide nanoparticles. The sample was centrifuged to collect the solids and washed several times with deionized water and ethanol to remove residual iron and residual extract from the sample. After washing, the sample was dried at 70 °C for 24 h and fine crushed to obtain pretreatment γ-Fe2O3 powder. The overall reaction mechanism is explained in equations (1)–(7) based on the research of Mohsan Bashir 12


Characterization
The surface morphology and element of γ-Fe2O3 were examined by energy dispersive X-ray spectroscopy (EDX) and scanning electron microscopy (SEM) using Hitachi S-4800 system, Japan. The functional groups of the γ-Fe2O3 were analyzed in the range of 4000 cm−1–400 cm−1 coated with KBr powder by a Nicolet 6700 Spectrometer (Fourier Transform Infrared Spectroscopy (FTIR)). Crystallinity and structure were determined via X-ray diffraction (XRD) at a scan rate of 2°min−1 (2θ) with CuK radiation (1.5406 Å) using a Siemens D5000 diffractometer. The surface area and pore size of γ-Fe2O3 were analyzed by static volumetric gas adsorption (SVGA) using N2 gas adsorption/desorption with 1 g (cm3)−1 degas at 150 °C for 12 h and tested in the Micro Active for TriStar II Plus 2.03 (high throughput surface area and porosity analyzer). Ultraviolet–visible spectrophotometry (UV-Vis) (Metash UV-5100 spectrophotometer) was used to analyze dye concentrations in solution samples.
Adsorption experiment
Adsorption evaluation experiments were performed based on the procedure performed in previous studies with some changes:13 –15 0.05 g of γ-Fe2O3 nanoparticles and 50 mL of dye solution (concentration of 25 mg L−1, pH 6) were added to 250 mL Erlenmeyer. Then, the sample was shaken in an incubator shaker (JEOTECH IST-4075R—Korean) at 30 °C for 2 h. The sample mixture was centrifuged at 6000 rpm to recover the color solution after adsorption. Adsorption capacity (qe) and adsorption efficiency (H%) were calculated by applying formulas (8) and (9) in which the initial dye concentration (Co) and the equilibrium dye concentration (Cf) were determined by a UV-Vis spectrophotometer


In the adsorption process, conditions such as time, pH, temperature, concentration, and dosage were changed. The time was tested from 0 to 240 min. The temperature was tested from 30 °C to 60 °C. The concentration was tested from 0 to 500 mg L−1. The dosage was tested from 0.2 to 4 mmol L−1. The pH in solution was tested from pH2 to pH10. The pH values were determined using a pH meter and adjusted with 0.01 M NaOH and HCl solutions.
The acids/bases surface and zeta potential measurement
The pH point zero charge (pHpzc) was tested by the method reported in Thuan and Bich’s study.16,17 0.1-g γ-Fe2O3 nanoparticles and 100 mL KCl solution (0.1 mol L−1) were added in Erlenmeyer with pH from pH2 to pH10 values (adjust with KOH and HCl concentrations of 0.1 and 0.01 M). The samples were shaken for 3 h and stabilized for 24 h at room temperature. The initial pH (pHi) and pH final (pHf) values were recorded by using a Hanna Instruments HI2210-02 bench machine pH meter. pHpzc was determined at crosspoint between pHi and pHf on the pH value chart.18 –20
Adsorption kinetics and isotherm model
The adsorption mechanism helps explain the interaction between γ-Fe2O3 nanoparticles and dye through prediction from models. Kinetic and isothermal models were executed from the equations in the form of nonlinear models based on Quyen’s research. 14 The model’s coefficients with the adjusted R2 coefficient were calculated based on the formulas and are presented in Table 1.
Equations of kinetic and isothermal models.

Results and discussion
Structural characteristics of γ-Fe2O3 nanoparticles
The morphology of γ-Fe2O3 nanoparticles synthesized with OP extract was analyzed by SEM and transmission electron microscopy (TEM). SEM and TEM results are shown in Figure 2 with proportions of 1 µm and 50 nm. Nanoparticles of small, spherical and nonuniform size were recorded over the total imaging domain scope. Nanoparticles were superimposed in an unorganized manner, creating pores on the surface as shown in the image. The morphology of γ-Fe2O3 nanoparticles was found to be similar to Sharanabasava’s study. 21 In Sithara’s research, this morphology was thought to be the interaction of phytochemicals in the OP extract with the precursor material. For TEM image results, Sithara’s work also showed that the nanoparticles were spherical and the average size usually ranged from 25 to 80 nm. 22

SEM and TEM images of γ-Fe2O3 nanoparticles of size (a) 1 µm and (b) 50 nm.
The particle size distribution histogram of Fe2O3 is shown in Figure 3. Size measurements of 60 randomly selected particles were taken. Fitting it to a log-normal curve resulted in an average diameter of 65–75 nm with a standard deviation of about 9.5%. It can be seen that the particles were prepared with less accumulation. The studies of Majid Farahmandjou, Miryam Rincón Joya, and Faruruwa also showed that iron oxide particles have sizes ranging from 50 to 100 nm.23 –26 Belal J. Abu Tarboush’s study showed that the average hydrodynamic diameter obtained by dynamic light scattering (DLS) was larger than that measured by SEM. DLS is believed to measure the agglomerated nanoparticle clusters in aqueous solutions. 27

Particle size distribution histogram of γ-Fe2O3 nanoparticles.
The γ-Fe2O3 crystal structure was also clearly determined by X-ray diffraction (XRD) and is shown in Figure 4. XRD spectrum clearly shows the crystalline phases of γ-Fe2O3, in which 2θ = 30.25° (220), 31.71° (221), 35.68° (311), 43.34° (400), 53.39° (422), and 57.36° (511), 63.03° (440). High and narrow peaks were observed and identify the well crystalline structure of γ-Fe2O3 of green chemical synthesis. 28 The diffraction peaks show the hexagonal crystal characteristics of γ-Fe2O3 and were similarly demonstrated in Bashir’s research. 12 The crystal size calculated is 56.66 nm using Debye Scherrer’s formula. 29 The EDX spectrum showed that the elemental compositions of the nanoparticles included Fe (iron), O (oxygen), Cl (chlorine), and C (carbon), in which the mass ratio of iron and oxygen in the samples was 55.66% and 36.86%, respectively. In addition, carbon and other impurities were 7.48%. The presence of carbon in the sample was believed to be the binding of γ-Fe2O3 to some phytochemicals in the extract.

(a) XRD patterns and (b) EDX spectrum of γ-Fe2O3 nanoparticles.
The results of Fourier Transform Infrared Spectroscopy (FTIR) spectroscopy were used to identify the functional groups and are shown in Figure 5. FTIR spectrum of γ-Fe2O3 nanoparticles was shown to be of several characteristic bands. The peaks at 636, 554, 480, and 422 cm−1 were attributed to the existence of the metallic oxygen (M–O) band. 30 Similar results were also announced by the Sithara team for Fe2O3 nanoparticles from OP extract. 22 The peak at 3420 cm−1 characterizes the stretching vibration of the O–H group. The peaks at 1627 cm−1, and 696 cm−1 represent the bending vibration of the C=C group. This functional group OH and C=C was thought to be the presence of water molecules and some phytochemicals in the extract remaining in the sample. The presence of these bioactive derivatives can act as a reducing agent, which is a necessary step in the synthesis of the material. 22 This was also demonstrated in the study of Kumar, which showed that the involvement of flavonoids/organic acids/carotenoids present in the extract contributed to the reduction and synthesis of iron oxide nanoparticles.25,31 It can be seen that the production of iron oxide nanoparticles using OP extract has potential.

FTIR spectrum of γ-Fe2O3 nanoparticles at (a) 4000–400 cm–1 and (b) 1000–400 cm–1 wavenumber.
Multilayer adsorption method (BET) was used to determine the pore structure on the surface of γ-Fe2O3. The surface area was also recorded as 41.488 m2 g−1, pore size as 34.90482 nm, and pore volume as 0.362033 cm³ g−1. The isotherm of the material at a pressure difference from 0.4 to 0.9 proves that the material has an arrangement to form pores as shown in Figure 6. According to the International Union of Pure and Applied Chemistry (IUPAC) classification, γ-Fe2O3 nanoparticles had an adsorption isotherm of type IV with a hysteresis loop of type H1. 32 A characteristic of the Type IV isotherm is that capillary condensation occurs in pores. The initial part of the type IV isotherm is attributed to monolayer–multilayer adsorption similar to the type II isotherm. 33 The hysteresis appearing in the multilayer range of the adsorption isotherm represents capillary condensation. H1 was typical for porous materials with a cubic shape and a narrow pore size distribution. 32 In Karolina Gdula’s research, similar results were obtained for γ-Fe2O3. 34 This shows that γ-Fe2O3 has the formation of pores and the material has the potential to study the adsorption process to remove organic pigments.

N2 adsorption–desorption isotherms of γ-Fe2O3 nanoparticles.
Evaluate the adsorption ability
The adsorption capacity was evaluated on cationic (MB, brilliant green) and anionic (CR, MR) groups. The conditions for adsorption process were γ-Fe2O3 dosage (0.05 g), dye volume (50 mL), dye concentration (25 mg L−1), temperature (30 °C), and time (120 min). The results in Figure 7 show that the γ-Fe2O3 nanoparticles had the adsorption capacity with valve flow coefficient (CV) of 2 mg g−1 < MB of 8.3 mg g−1 < MR of 8.4 mg g−1 < CR of 18 mg g−1. This was shown for adsorption for the anionic group better than the cationic group. In the anionic group, γ-Fe2O3 nanoparticles had adsorption best with CR with an adsorption capacity of 18 mg g−1. In the cationic group, γ-Fe2O3 nanoparticles had adsorption best with MB with an adsorption capacity of 8.3 mg g−1. Therefore, CR was chosen to evaluate the factors affecting the adsorption process as well as predict the adsorption mechanism of γ-Fe2O3 nanoparticles.

The adsorption capacity of cationic and anionic dyes.
Effect of adsorption condition
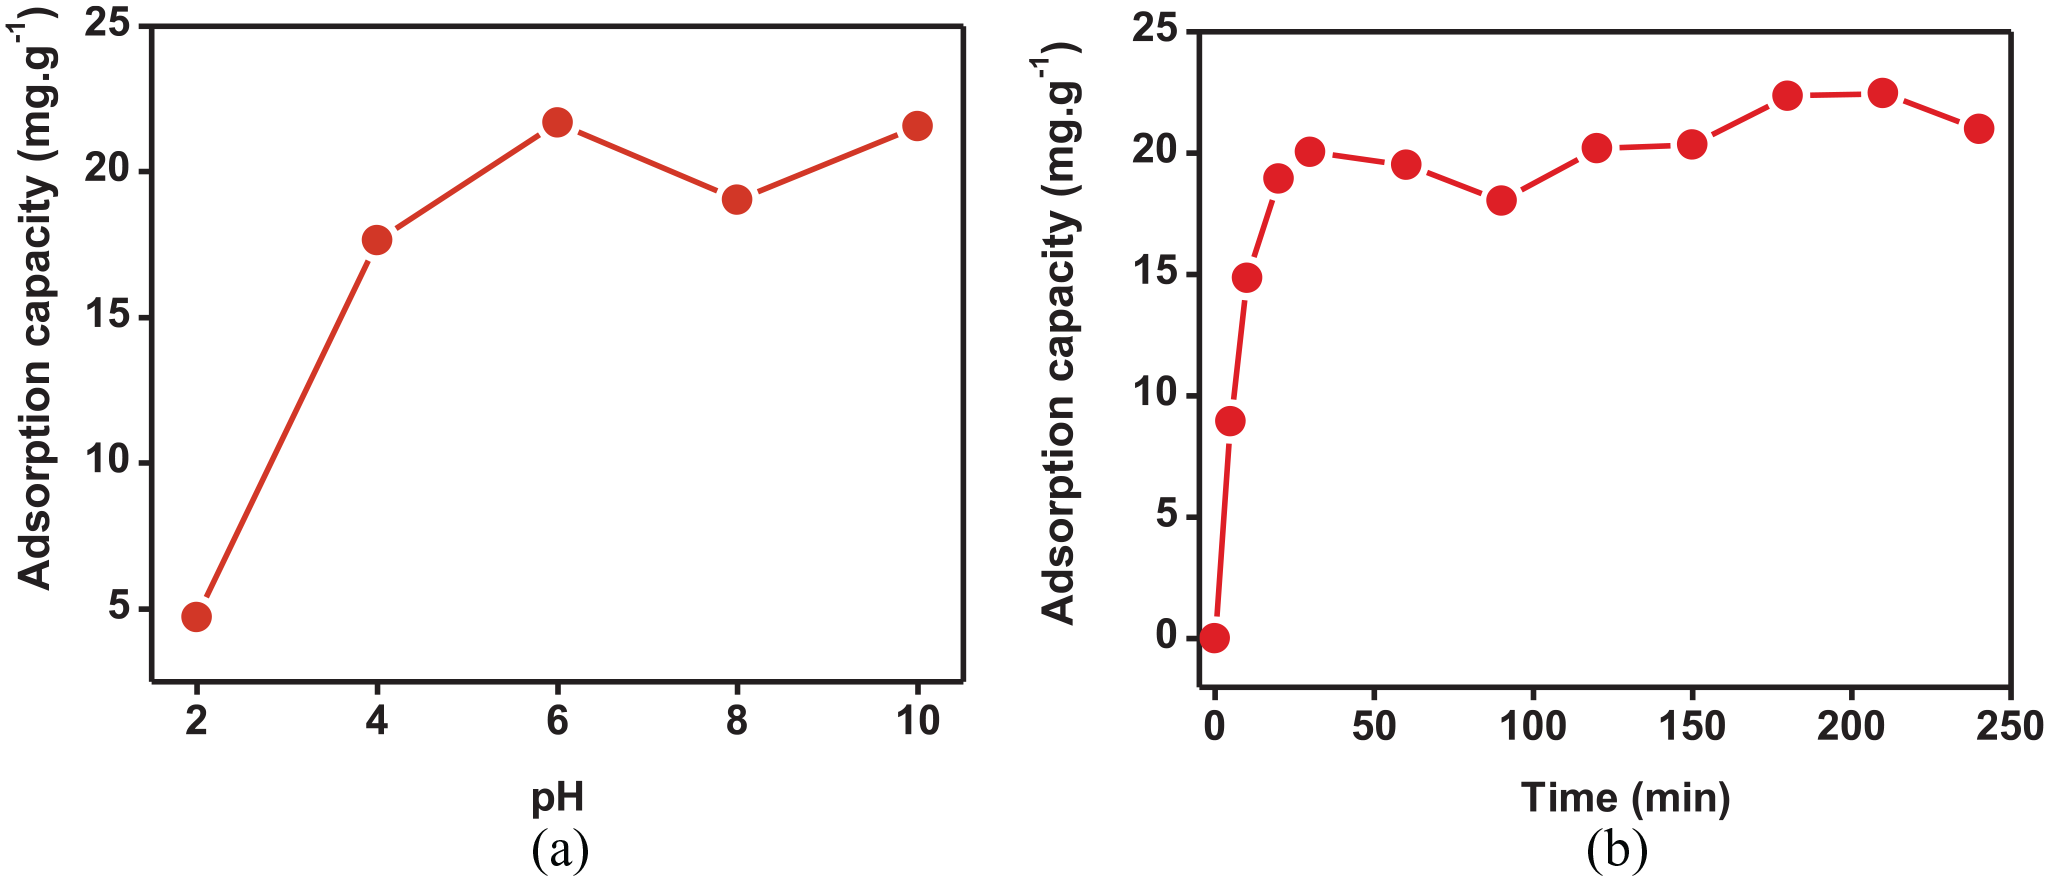
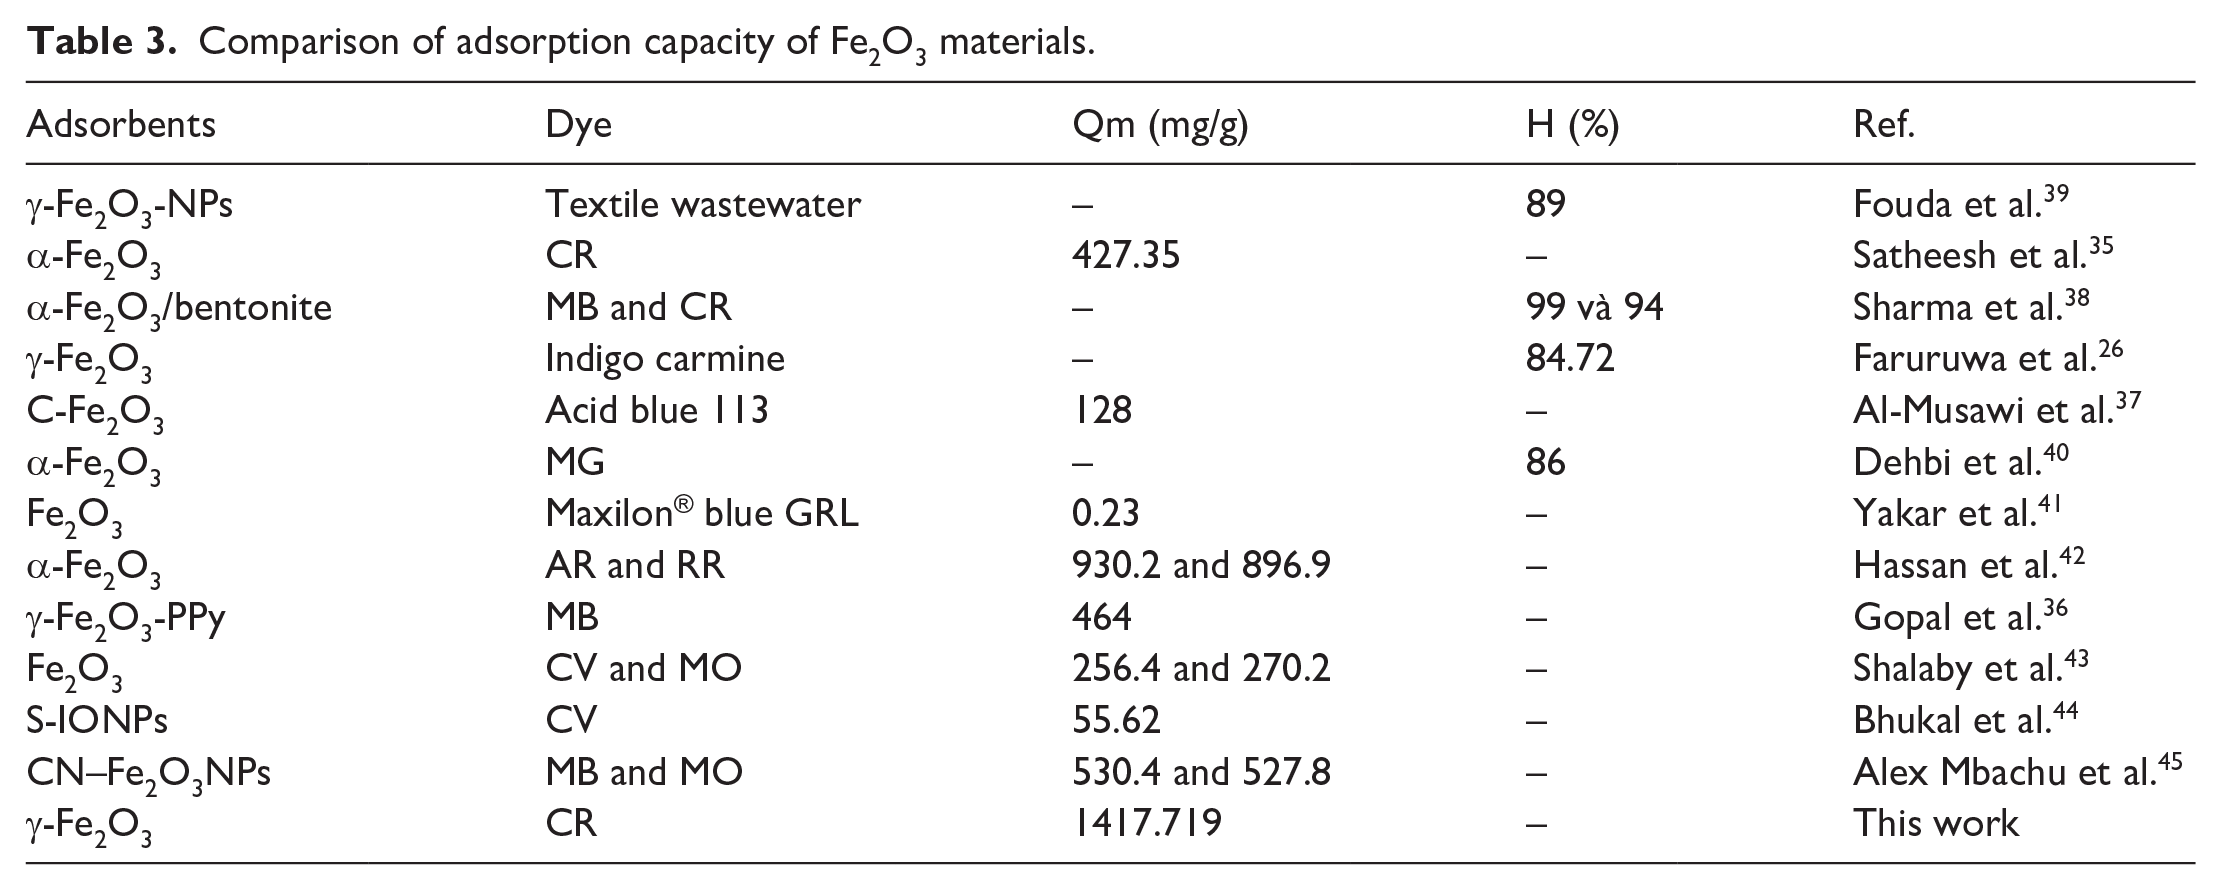
The pH of the solution can affect the adsorption process by complexation reactions and electrostatic interactions between CR and the γ-Fe2O3 nanoparticles. According to Figure 8, the solution pH of CR dye recorded the highest adsorption capacity at pH 6 (22 mg g−1). The adsorption efficiency was achieved at 99% at pH 6 with the highest adsorption capacity. In the work of Satheesh, γ-Fe2O3 nanoparticles were shown to have good adsorption capacity in a basic environment (pH >6). This was explained by the fact that at low pH the increase in H+ ion concentration in solution promotes the accumulation of H+ ions on the protonated γ-Fe2O3 nanoparticles and CR surfaces. This increase in protons was caused by a strong repulsion between H+ ions on the γ-Fe2O3 surface, causing CR removal to be inhibited. At alkaline pH, excess OHˉ ions could accumulate on the γ-Fe2O3 surface, causing electrostatic repulsion between the negative charge on the adsorbent surface and the anionic CR molecule to increase. 35 Therefore, pH 6 was chosen as the best pH value to evaluate the next factors. The effect of time on the adsorption capacity of γ-Fe2O3 to CR was conducted sequentially with time intervals from 0 to 240 min. According to the results in Figure 6, the adsorption capacity of γ-Fe2O3 with CR dye increased from 0 to 20 mg g−1 in the first period from 0 to 30 min; 30–90 min show that the adsorption capacity decreases slightly from 20 to 18 mg g−1; 90–210 min show that the adsorption capacity continues to increase from 18 to 22 mg g−1 and is more unchanged. It can be said that the adsorption process had reached an equilibrium state. Therefore, the adsorption time chosen as the optimal value for subsequent experiments with CR dye was 30 min.
The effects of (a) pH and (b) time.
The effect results of temperature on the adsorption capacity of γ-Fe2O3 are presented in Figure 9. Temperature was one of the affected factors in the adsorption process. When the temperature increased, the molecules in the solution were also disturbed. Therefore, the temperature factor was evaluated at different temperature ranges (30, 40, 50, 60 °C). The adsorption process was recorded to gradually increase at temperatures from 30 °C (24.8 mg g−1) to 50 °C (25.7 mg g−1). At a temperature of 60 °C, the adsorption capacity decreased to 24 mg g−1. This was thought to be the prompt disorder of molecules that hindered the adsorption process. In Satheesh’s work, the adsorption process was spontaneous and endothermic, based on a thermodynamic model. The increasing temperature factor hindered the spontaneous adsorption process when the adsorption capacity decreased at a temperature range of 60 °C. 35 Therefore, the temperature value of 50 °C was chosen to evaluate the next factors. When the γ-Fe2O3 dosage increases, the adsorption capacity will decrease. This was explained through the formula for calculating the adsorption capacity (formula 8). The adsorption efficiency was calculated to choose the γ-Fe2O3 dosage to get the best conditions. According to Figure 6(d), the adsorption efficiency increased from 40% to 72% when the γ-Fe2O3 dosage increased from 0.1 to 0.5 mmol L−1. It can be seen that the adsorption efficiency was improved and the capacity was also strongly reduced. However, when the dosage increased from 1 to 3 mmol L−1, the adsorption efficiency ranged from 72% to 92%, and the adsorption capacity was unchanged. It can be seen that the mass ratio of 3 mmol L−1 has the best adsorption efficiency. But to save raw materials, the content ratio of 1 mmol L−1 is chosen to evaluate the next factors based on both the adsorption capacity and adsorption efficiency.

The effects of (a) temperature and (b) dosage.
The effect results of CR concentration on the adsorption capacity of γ-Fe2O3 are presented in Figure 10. CR concentration was evaluated from 10 to 400 mg L−1. In the concentration range from 10 to 100 mg L−1, the adsorption capacity increased from 8.7 to 82 mg g−1. The adsorption process still increases steadily when the concentration increases to 400 mg L−1. The adsorption capacity is less at concentrations from 400 to 500 mg L−1. It can be seen that the adsorption capacity was balanced. In summary, the best adsorption capacity of γ-Fe2O3 was recorded with CR dye at time 30 min, temperature 50 °C, pH 6, content 0.05 mmol L−1, and concentration 400 mg L−1. This is the best adsorption condition chosen to predict the adsorption mechanism based on mathematical models.

The effects of dye concentration.
Adsorption kinetics and isotherm models
The adsorption kinetic model was used to predict the adsorption process through parameters in the adsorption process such as adsorption rate and adsorption capacity. The parameters obtained from the adsorption kinetic model of γ-Fe2O3 with CR dye are summarized in Table 2. The pseudo-first-order, pseudo-second-order, Elovich and Bangham kinetics are presented in Figure 11(a). The pseudo-first-order and pseudo-second-order were suitable for the adsorption process of the material with high correlation coefficients of 0.965 and 0.956, respectively. The results show that the adsorption capacity of CR on γ-Fe2O3 is mainly controlled by physical and chemical interactions. The published results were similar to Ramu Adam Gopal regarding the adsorption mechanism of γ-Fe2O3. The interactions mainly include electrostatic interactions, hydrogen bonds, and chemical bonding interactions between the dye and γ-Fe2O3. 36
Adsorption kinetics and isotherm parameters of γ-Fe2O3..


(a) Adsorption kinetics and (b) isotherm of γ-Fe2O3.
The adsorption isotherm model was used to determine the adsorption capacity, the mechanism and the interaction between CR molecules and the adsorbent. The Langmuir, Freundlich, Temkin and D–R adsorption isotherm models are presented in Figure 11(b). The parameters obtained from the adsorption isotherm model of γ-Fe2O3 with CR dye are summarized in Table 2. It can be seen that the Freundlich isotherm model and the D–R isotherm model suitably describe the CR adsorption process on γ-Fe2O3 with correlation coefficients of 0.974 and 0.929, respectively. The results show that the γ-Fe2O3 adsorption process is multilayer adsorption with heterogeneous electrostatic interaction force on the surface with Gaussian energy distribution. The D–R isotherm model is considered based on the adsorbent size < micropore and the adsorption equilibrium relationship occurs based on the interaction between the adsorbent and adsorbent. The above adsorption mechanisms were also similarly predicted for Fe2O3 in Tariq’s study. 37 Besides, Pratibha Sharma’s study also showed that CR dye was adsorbed by Fe2O3 by following the Freundlich model. 38
Comparison with other adsorbents
Fe2O3 materials have been applied to remove various dyes such as Acid Red 57 (AR), Remazol red (RR), MB, methyl orange (MO), crystal violet (CV), malachite green (MG), acid blue 113, and Maxilon® blue GRL and are shown in Table 3. The results show that the adsorption capacity of Fe2O3 materials for negative dyes was higher than that of positive dyes. In the study of Yakar, Fe2O3 materials were synthesized and could remove AR and RR dyes of 930.2 and 896.9 mg g−1, respectively. In this study, the maximum adsorption capacity of Fe2O3 materials was 1417.719 mg g−1 according to the Langmuir model. This shows that the adsorption capacity is improved compared with previous studies. In addition, the study showed the potential of Fe2O3 synthesized from OP extract in organic dye removal application.
Comparison of adsorption capacity of Fe2O3 materials.
Conclusion
In this study, γ-Fe2O3 nanoparticles were synthesized using the green chemical method using OP extract. Through SEM, FTIR, XRD, and BET analysis methods, it is shown that the object has a small spherical shape and the particles are unevenly distributed. The material was determined and ferric oxygen was determined by determining the elements of iron and oxygen at ratios of 55.66% and 36.86%. Together with the peaks 2θ = 30.25° (220), 35.68° (311), 43.34° (400), 53.39° (422), 57.36° (511), and 63.03° (440), the material is determined to be α-Fe2O3 with a characteristic hexagonal crystal structure. The crystal size calculated using Debye Scherrer’s formula is 56.66 nm. The peaks at 636, 554, 480, and 422 cm−1 are attributed to the existence of a clearly defined metallic oxygen (M–O) band. In addition, OH and C=C groups are attributed to the presence of OP extracts. The best ability to remove CR organic pigments occurs under the following conditions: time 30 min, temperature 50 °C, pH 6, content 0.05 mmol L−1, and concentration 400 mg L−1. The pseudo-first-order and pseudo-second-order were suitable for the adsorption process of the material with high correlation coefficients of 0.965 and 0.956, respectively. The adsorption process fits pseudo-first-order and pseudo-second-order kinetics and were mainly controlled by physical and chemical interactions. The Freundlich and D–R adsorption isotherm were mainly controlled by multilayer adsorption with heterogeneous electrostatic interaction force on the surface with Gaussian energy distribution. This is a point that requires further in-depth research. In summary, γ-Fe2O3 nanoparticles from green chemistry are potential material to replace materials synthesized from conventional chemical methods. It has good adsorption capacity which reduces production costs and disposal problems.