
Abstract
Keywords
Introduction
The benefits of attending quality early childhood education (ECE) programs have been well-established for children from low socio-economic and ethnically diverse backgrounds (Krieg et al., 2015; Yoshikawa et al., 2013; Zaslow et al., 2016) and also for the general population (D’Souza et al., 2023; Melhuish et al., 2015; Meloy et al., 2019). Studies have also confirmed that educational benefits accrue from attending a 2-year program beginning from age 3 years (Balladares & Kankaraš, 2020; Infurna & Montes, 2020; Sammons et al., 2002) for between 15 to 30 hours (h) per week (Gilley et al., 2015; Laurin et al., 2015; Loeb et al., 2007). Currently, in Australia, national policy aims to “strengthen the delivery of preschool and better prepare children for the first year of school” through Commonwealth funding for “delivery of 15 hours of preschool a week - 600 hours a year 1 for all children in the year before they start school”, typically at age 4-years (Australian Government Department of Education, 2022). As a reform focused on universal access to affordable quality ECE programs for all children, these provisions stipulate delivery by a degree qualified early childhood teacher, irrespective of setting (preschool/kindergarten or long day care centre), with additional focus on improving participation and outcomes for Aboriginal and Torres Strait Islander children and disadvantaged children (Federal Financial Relations, 2021).
Further to the national reforms, two States, New South Wales (NSW) and Victoria, have proposed to extend the recommended dosage of 600 h for universal ECE programs by increasing hours of attendance up to 30 h per week and hours of operation of preschools beyond 7.5 h per day in areas of greater need and greater disadvantage (NSW Government Department of Education, 2022; Victorian Government, 2023). These new policy directions align with evidence from intervention studies and randomised control trials conducted in Australia (Fordham, 2016; Tseng et al., 2019), Canada (Pascal, 2009), the United Kingdom (Melhuish et al., 2009), and the United States (Atteberry et al., 2019; Infurna & Montes, 2020; Lee et al., 2014) that show positive outcomes of a full-time ECE program for 3- to 5-year-old children growing up in circumstances of disadvantage.
The attendance gap
Despite Australia’s increased focus on universal ECE services for disadvantaged children and families, barriers remain (Beatson et al., 2022; Skattebol et al., 2014), with many examples of vulnerable children and families not initiating or sustaining engagement with ECE programs. An analysis undertaken by the Re-Stacking the Odds project (Molloy et al., 2022, p. 13) reported that “just 56% of 4-year-old children enrolled in ECE receive the recommended dose of at least 15 hours per week.” In an analysis of two waves of the Australian Early Development Census (AEDC), O’Connor et al. (2016, p. 31) found that across Australia, “children from non-English speaking and Indigenous backgrounds and children living in disadvantaged communities all had substantially higher odds of not attending preschool in both 2008 and 2011.” Also drawing on national data, Wong et al. (2014) examined 3,615 families’ use of ECE (preschool and long day care) in relation to a Disadvantage Index (DI), created from three child-related indicators of disadvantage (disability/health concern; non-English-speaking background; Aboriginal/Torres Strait Islander background) and six family-related indictors (low socio-economic position, maternal/paternal health condition; maternal/paternal mental ill-health; drug/alcohol problem). Analyses showed that as the DI increased to three or more indicators, children were significantly less likely to be attending ECE. Further, Wong et al.’s analyses showed this was due to families’ reduced use of preschool. Their analyses showed no effect of higher levels for DI on families’ use of long day care centres.
Smaller State-based studies also point to lower-than-expected levels of ECE participation in disadvantaged communities. Krieg et al. (2015), for example, collected attendance records for 99 children in their early weeks of attending 10 Department of Education funded integrated ECE services in metropolitan areas of South Australia. Results showed that 40% of children attended for less than 15 h per week. Elek et al. (2021) collaborated with a local Aboriginal community in the Northern Territory to evaluate an ECE program for 45 children aged 6-to-36-months who were not already accessing ECE services. Over a year of data collection, the maximum number of children attending on any one day was 34 (maximum attendance rate = 76%) and the median was 21 children (average attendance rate = 47%). Overall, only 30% of children attended regularly, defined as “more than 40% of the time” (Elek et al., 2021 p. 584). Another longitudinal study of 20 children in a metropolitan area of West Australia found that, while pre-primary attendance rates varied considerably (from 3% to 61% of absences over the school year), “Aboriginal children were disproportionally represented among the consistent non-attenders” (Taylor, 2010, p. 684).
These findings align with international comparisons indicating Australia lags behind other OECD member and non-member countries. An OECD analyses of data from 54 countries by Balladares and Kankaraš (2020) identified two concerns in relation to Australian children’s uptake of ECE: A higher proportion (15%) of Australian children attend ECE for less than one year compared to a much lower proportion (2% or less) in the majority of OECD countries; and, on average, only 35% of Australian children from low SES backgrounds attend preschool, compared to an average of 40% and above for most other countries (Balladares & Kankaraš, 2020, Figures 1 and 3, pp. 10–13). In this light, ensuring that all Australian children receive (at least) 600 h of ECE in the year before school seems a modest goal. But concerns about lower than OECD averages for at least one year of ECE before school, and lower rates of attendance for children from low SES backgrounds, require sustainable, cost-effective and socially relevant solutions. We also note that addressing the problem of low rates of participation among more disadvantaged communities requires a sophisticated understanding of the factors that influence behaviour and behavioural change, as well as a more nuanced appreciation of current patterns of enrolment and attendance in ECE. Project excel file format for individual child’s attendance records. 
Investing in ECE participation in areas of community disadvantage
While government and community initiatives that provide access to ECE for families at no cost or with reduced fees have been shown to promote children’s attendance (e.g., Elek et al., 2021; Krieg et al., 2015), affordability is not the only barrier to ECE participation (Molloy et al., 2022). Behavioural economics (‘nudge’) theory (Darnton & Thorne, 2013) identifies three contexts, individual, social, and materi!al, that can be applied to the challenge of achieving ECE participation by all children. The
“Nudge” theory formed the basis of a response by the authors of this paper to a NSW Department of Education (2018, pp. 4–5) research tender to “better understand and improve the participation of children from low SES backgrounds” and “build the evidence base and support future policy making on efficient and sustainable improvement” through gathering evidence on the measurable impact of non-fee intervention(s) on participation rates. Our design for the Supporting Participation in ECE (SPiECE) for children from low SES backgrounds
In this paper, we describe a key feature of the research design: the collection, analysis and tracking of children’s attendance before and during the delivery of the SPiECE intervention program 2 .
ECE participation: Children’s enrolment and attendance
Despite international recognition of the importance of including attendance in studies of the impact of ECE on children’s educational and developmental outcomes, most studies rely on limited evidence. A key concern, as noted by Lim et al. (2022), is that attendance tends to be quantified by whether a child attends or not, and the duration of time (as years) spent in ECE. For example, large-scale population-based datasets, such as the Australian Early Development Census (AEDC) (O’Connor et al., 2016), the Program for International Student Assessment (PISA) (Ballandares & Kankaraš, 2020) and the UNICEF Cluster Survey (Sosu & Pimenta, 2023) use a simple yes/no response as to whether the child attended preschool and at what age. Studies conducted over several years such as the Longitudinal Study of Australian Children (Wong et al., 2014) and E4Kids (Gilley et al., 2015) include annual collections of parent-reported weekly hours of ECE attendance. The Effective Provision of Preschool Education study recorded the number of months children attended ECE (Sammons et al., 2002). Small case studies have tracked attendance in greater detail but have tended to focus on percent attendance as the outcome measure (Elek et al., 2021; Tayler, 2018).
To our knowledge, there are no examples of research that draw on ECE enrolment and attendance records to calculate rates of daily attendance and hours attended, although this has been recommended by the Re-Stacking the Odds research team (Molloy et al., 2022, p. 21) who note the potential for utilising “administrative information from all ECE services . . . to be explored with reliable data at local, state, and national levels”. In Australia, ECE preschools, long day care centres, and schools are required to record each child’s arrival and departure time for each day attended. In designing the SPiECE evaluation, our expectation was that these records of children’s enrolment and attendance could be provided by or accessed from the participating centres and schools for the full year of the project.
Aim
A key aim of the SPiECE intervention project was to gather and analyse children’s enrolment and weekly attendance from the beginning of the preschool year through to the end. We utilised graphic and statistical analytic techniques to track and explore patterns of enrolment and attendance over the four terms of a preschool year. A further aim was to compare patterns of enrolment and attendance for children attending a preschool versus a long day care setting, both of which meet expectations for the provision of an educational program taught by a degree-qualified early childhood teacher for children in the year before school.
Method
Ethics approval for the research design and the collection of children’s daily attendance records, with parent opt-out assent, was obtained from the Macquarie University Human Research Ethics Committee with approval granted in May 2019 (Reference No: 5201949777427). We also applied for and received consent for centres/schools that were managed by large organisations or the NSW Dept of Education. Each centre/school and all children’s attendance records were de-identified, as explained in the Method, for analysis purposes.
Selection and recruitment of ECE centres/schools
Given the focus of the NSW Department of Education (2018) tender was on children from low SES backgrounds, we used the 2019 AEDC Data Explorer (AEDC, n.d.) tables to identify one regional and two metropolitan communities that had higher than average rates of childhood developmental vulnerability and high levels of socioeconomic disadvantage (based on SEIFA rankings 3 ). The AEDC Data Explorer maps were used to locate all centre-based early learning services (preschools and long day care) in the AEDC-identified areas within these three communities that met the selection criteria. This process identified 43 centres that were contacted by telephone and invited to submit an Expression of Interest (EOI) to participate in the research. We also approached NSW Department of Education schools in these communities that included a preschool.
Centres/schools were asked to submit their EOIs via an online Qualtrix link. Reminder emails were sent if needed, and phone calls were made by members of the research team to explain the project and encourage submission of an EOI. A total of 21 EOIs were received, with 20 centres/schools providing signed consent forms. One centre commenced the project but withdrew in the first term.
The study sample comprised 15 long day care centres, 2 preschools and 2 school-based preschools. These 19 ECE programs were managed by a mix of provider organisations, including state or local council governments (
Data collection
Attendance records were requested from each participating centre/school for all children who were expected to start school (Kindergarten in NSW) the following year. To achieve consistency across long day care and preschool settings, we requested that attendance records for each of the four 10-week terms be provided sequentially, at the end of each term, one term at a time. For the 4th Term, records were requested one week before the end of the school year acknowledging that some centres/school close after the final week of term for the 6-week summer school holiday period.
In most of the participating centres, the typical approach to collecting ECE attendance records, was online, via a commercial software program. If needed, centre/school Directors and administrators were offered support by the project Research Assistants to access daily attendance records from their software program. Preschools were more likely to be using paper sign-in/sign-out sheets, and all centres/schools used paper records when the software systems broke down. These records were scanned and provided electronically to the research team.
Data management
Attendance records were de-identified and transferred from their original format to a project-designed excel file with a pre-set calendar with a 24-h clock, and pre-set formulae for calculating daily and weekly hours (see Figure 1). To ensure confidentiality of the data, each centre/school was allocated a 3-digit numeric code, based on location and the order of recruitment. Each child who was enrolled was also allocated a unique code based on the centre code and the number of enrolled children. For example, for centre 133, the child codes were 13301, 13302, 13303, etc. The data set consisted of one excel workbook per centre/school, and within that workbook, one worksheet (or page) per child.
Each child’s attendance records were entered manually (from paper records) or copied and pasted (from downloaded software files) into the study excel file in ‘long format’, i.e., one row per child per day. Arrival (time in) and departure (time out) were entered for each day attended. If a child was absent on an enrolled day, this was entered manually. Total hours attended for the day and the week were calculated automatically to two decimal points, through creating formulas in the excel file. A formula was also used to record attendance (see Figure 1, column 8, 1 = present), with additional formulas created to generate the number of days attended, per week, per term, and for the school year. For example, in the week of Jan. 28 to Feb. 4, child 13301 was enrolled Tuesday and Wednesday (2 days) and attended for 2 days and a total of 16.38 h.
Attendance records were checked for errors and missing data and, where needed, the centre/school was contacted and requested to provide these additional data. In cases where the arrival or departure time was missing, times were inserted based on the child’s arrival or departure time for the next attended day. All children were retained in the data file, including those who only attended the centre/school for a short period of time.
Data analysis – Descriptive statistics
Simple computations were applied to the raw data records for each child to generate summary scores for each child’s enrolment and attendance for Terms 1, 2, 3, and 4. Enrolment was based on the child’s recorded enrolled days. Attendance was based on two indicators: - -
The data set for analysis was then created in a sequence of steps. First, children’s records for each centre/school were merged to generate overall summary scores for the number of enrolled days, the percentage of days attended, and the number of hours attended for Terms 1, 2, 3, and 4. We combined centre/school summary scores by type of ECE to organise the data into two groups: Preschool and Long Day Care.
Descriptive analyses (Mean, Standard Deviation,
Data analysis – Predictive statistics
Univariate analysis of variance (ANOVA) tests and repeated measures regression analyses were used to examine the effects of type of ECE on children’s attendance. ANOVA tests were used to compare overall means for
Results
Number of children enrolled and attendance records collected by type of ECE.
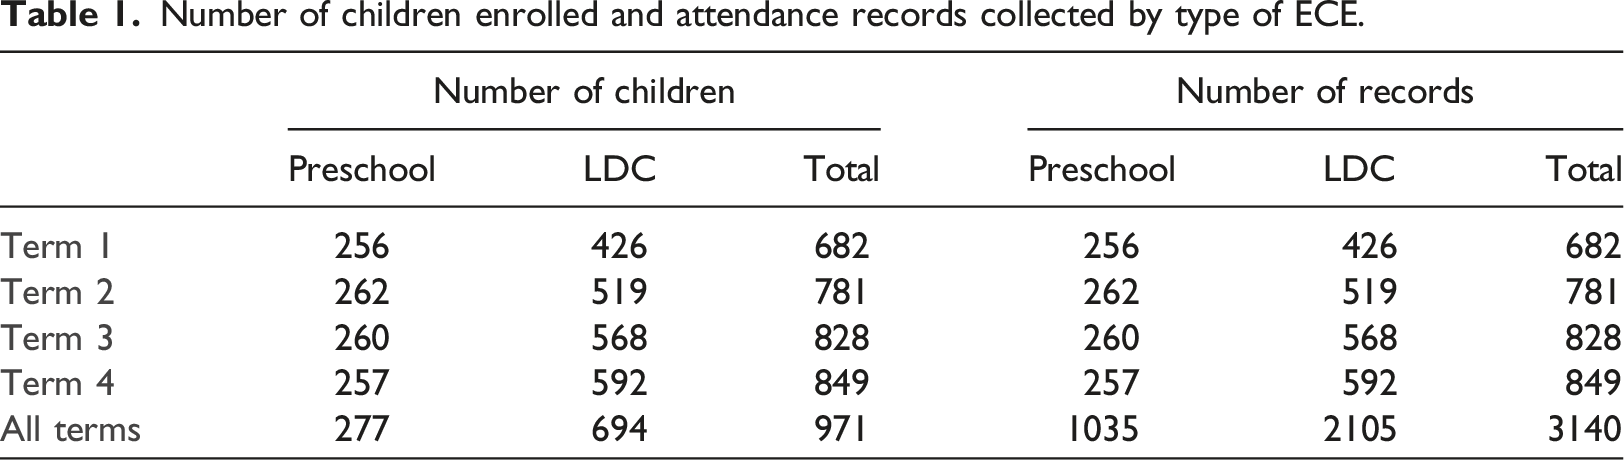
Enrolment
We examined the summary data for enrolment (Table 1) term by term for each individual child to understand how individual enrolment patterns changed over the school year (see Figure 2). The majority of children ( Enrolment stability/instability for preschool versus long day care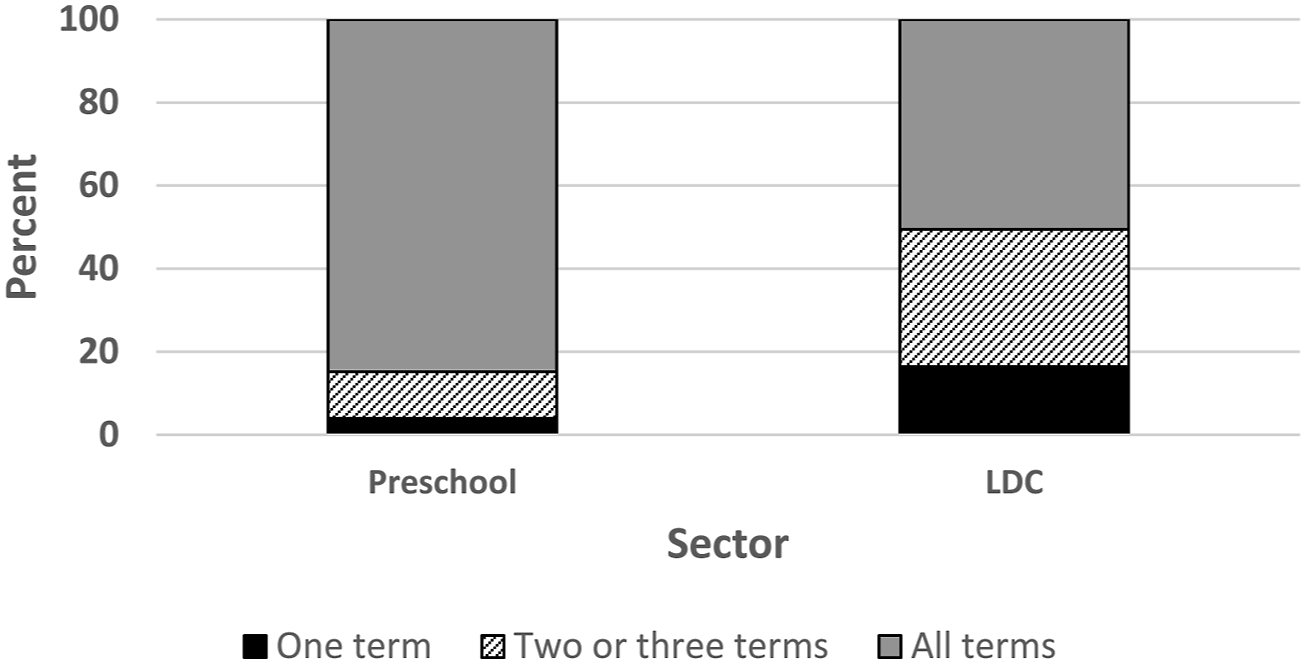
The distribution shown in Figure 2 shows a much higher proportion (percent) of children in the stable group (grey shading) for preschool (84.8%) compared to long day care (50.6%). Enrolments for a single term (black shading) were higher in long day care (16.4%) than preschool (4.0%). The third pattern, enrolment for two to three terms (black/white diagonal lines), was also substantially higher in long day care (33.0%) than preschool (10.2%).
Attendance
We used two measures to assess attendance outcomes:
Percent attendance
Total sample: number of enrolled and attended days and percentage of attended days.

arecords collected for 9 weeks.
Enrolled days and percentage of attended days by type of ECE (Preschool vs. Long Day Care).

arecords collected for 9 weeks.

Variations in percent attendance from Term 1 through 4 for preschool and long day care
The results presented in Table 2 suggested that attendance also varied by type of ECE over the school year. Findings illustrated in Figure 3 showed that the difference between preschool and long day care was most evident in the drop in attendance from Term 1 to Term 2, which was greater for children attending preschool than those in long day care. Although preschool attendance rose in Term 3 and 4, it remained lower than long day care attendance.
Total hours attended
Total hours attended per term by type of ECE (Preschool vs Long Day Care).

aadjusted to reflect the 10 week term using a multiplier of 1.1111 for 9 week records.
Hours attended for each term, illustrated in Figure 4, provide a complementary picture to the pattern in Figure 3. While there is a dip in hours attendance from Term 1 to Term 2, and an increase from Term 2 to Term 3, there is a further increase in the number of hours attended by preschool children in Term 4. Long day care hours, in comparison, had minimal change in Term 4. Variations in hours attended from Term 1 through 4 for preschool and long day care. Note: Hours for Term 4 (9-week records) were adjusted to 10 weeks using a multiplier of 1.1111.
Next, we used the full dataset to map hours attended by days attended to explore the observed differences for preschool and long day care settings in relation to the expectation that children would receive 150 h of ECE per term. Results are presented in Figure 5. The x-axis shows the number of days attended for the 10-week term ranged from 1 to 51 (50 is equivalent to 5 days per week). The y-axis shows the number of hours attended for the 10-week terms, which ranged from 2 to 498. The expected 150 h per term is shown by the horizontal line. The circles represent each of the children who attended a long day care centre. The triangles represent children who attended a preschool. The regression lines (grey for long day care, black for preschool) show the point at which attendance achieves the expected 150 h per term. Attendance patterns above and below 150 hours per Term for preschool and long day care
For long day care, the regression line show that 150 h was met when attendance was about 18 days per term (an average of less than 2 days per week). The distribution of circles shows the wide variation in the number of hours and days attended, with most children attending for ≥20 days per term and >150 h. In contrast, the regression line for preschool shows that 150 h was met when attendance was about 25 days per term (2.5 days per week). The distribution of triangles showed that most children were attending for <25 days and <150 h per term.
Discussion
Children’s daily attendance records are key to understanding participation in ECE, but few studies or government reports have examined this information in fine-grained detail. Our review of literature found only three studies of children’s participation in ECE in the year before school that measured dosage in terms of days or hours attended week-by week over the school year (Elek et al., 2021; Krieg et al., 2015; Taylor, 2010). In most studies, the focus has been on broad summary measures such as the number of years attended (Infurna & Montes, 2020; Zaslow et al., 2016) or on the benefits of full-time attendance examined in highly controlled randomised control trials or intervention programs (Atteberry et al., 2019; Pascal, 2009; Tseng et al., 2019). As noted by Molloy et al., (2022, p. 21), systematic collection of enrolment and attendance records in Australian ECE services offers the potential for addressing “questions about enrolment and attendance together with child risk factors … with reliable data at local, state, and national levels” through data linkage. In the present study, we sought to explore local issues affecting enrolment and attendance in three disadvantaged communities in NSW.
With the cooperation of ECE centre directors and administrators, we were able to generate a large and detailed attendance dataset (
The results of our analyses highlight important features of ECE participation in low SES communities that have not been previously explored. First, we found that attendance was more stable for children who attended a centre- or school-based preschool than children who attended a long day care centre: 85% of children attended the same preschool centre/school for all four terms compared to 51% of children enrolled in long day care centres. One -third (33%) of children enrolled in long day care centres attended for two or three terms, and one-sixth (16%) attended for only one term. These figures suggest that 49% of children in low SES communities may be attending an ECE program for less than one year before the start of school. Over half of the single-term attenders started in Term 4 which suggests families may have wanted their child to experience a formal ECE program before starting school the following year. However, there may have been other reasons for these limited patterns of attendance. Studies have shown that, families may stop and start ECE in different settings for a variety of reasons, and more changes may be associated with higher levels of advantage (Claessens & Chen, 2013) or disadvantage, particularly for families receiving childcare subsidies (Ha et al., 2012).
One of the first largescale Australian studies of change in children’s childcare arrangements found that one-quarter of families had either increased or decreased the number of arrangements in a 12-month period (Bowes, et al., 2003). The most common reasons for change were a more convenient location, the arrangement was no longer available, and better quality care. Moran (2020, p. 9) also reported that children were moved to “an arrangement with a higher perceived educational value” in interviews with low-income families in the United States. Some studies have shown that changes of ECE setting can support children’s learning outcomes, particularly if moving to a school-based educational setting (Ansari & Winsler, 2013); however, much of the research has tended to underscore the benefits of stability of ECE arrangements in the years before school (Claessens & Chen, 2013; Morrissey, 2009).
Although stability of attendance over the four terms was a positive feature for children attending a preschool centre/school, we found that attendance rates were lower for children in preschool than for children attending a long day care centre. Preschool attendance dropped from 89% in Term 1–80% in Term 2 and steadied at 84% in Terms 3 and 4. In contrast, attendance rates were significantly higher for long day care in Term 1 (91%), dropped slightly in Term 2 (89%), and stayed high for Terms 3 and 4 (90%). Total hours were also higher for children attending long day care (from 169 to 177 hours/term; M = 173) compared to children attending preschool (ranging from 101 to 119 hours/term; M = 111). Whilst results showed that children attending a preschool increased their attendance in Term 4 M =119 h (reflecting an earlier arrival time), on average, they were less likely to receive the 150 h per term ‘dosage’ of ECE than children attending a long day care centre. The reasons for lower attendance rates in preschool are difficult to explain; however, this may be related to current government policy to provide universal fee-free access to 15 h of preschool. Anecdotal evidence suggests that ‘no payment’ may be a disincentive; parents may place less value on ECE if they don’t have to contribute to the cost. We understand that some ECE provider organisations recommend that a small parental contribution is requested as an incentive for their child to attend.
The marked differences between preschool and long day care were also illuminated by the spread of hours attended in relation to days attended in Figure 5. The majority of preschool children (triangles) attended between 15 to 25 days per term, which corresponded to between 70 and 150 h, while most of the long day care children (circles) attended from 15 to 30 days per term, which corresponded to 150–250 h. The findings suggest that preschool enrolment patterns of fewer days per week and fewer hours per day combined to restrict weekly hours of attendance. Long day care enrolments tend to be flexible, accommodating families’ needs to extend the hours and days attended. This is much less likely in preschools which are impacted by government funding and tend to offer a fixed pattern of hours and days per week, or per fortnight. As a group, our results suggest that the children attending preschool settings were not attending enough days to achieve the expected 600 h of ECE in the year before school.
Limitations
While this study has illustrated the benefits of using routinely collected administrative records of children’s attendance in their ECE setting for the purpose of research, the available data was limited to children’s enrolled day and their arrival and departure times. We did not ask for, or have ethics arrangements, to collect any personal information for the children, such as age, gender, home language, developmental delay/disability status. We also did not have access to information about children’s participation in any other ECE settings. As such, the reported hours per week of ECE may be an under-estimate for some children.
We also note that, while participating settings in each of the three communities were selected based on similar levels of neighbourhood disadvantage (as indicated by AEDC SEIFA ratings for areas), there is likely to be substantial variation within these cohorts. We did not have access to, or request, personal information about family disadvantage, and although the centres were recruited from low socio-economic areas this did not guarantee similarity of income status across the families accessing ECE. We also were not able to account for other family circumstances that may have affected attendance, or community needs that may have affected centre viability and/or opening hours.
Further research
This study has highlighted the potential for research in utilising ECE enrolment and attendance records to systematically examine children’s experiences of ECE in the year before school. As recommended by Molloy et al. (2022), further research should consider expansion of this type of study through ECE administrative data infrastructure. There is also potential for augmentation by seeking information from families about the choices they make regarding ECE and from centre/school staff regarding the challenge of ensuring children receive a quality education that is stable and supportive of their educational and social needs. Future studies should also seek to include information about individual child and family characteristics to contextualise the circumstances that influence children’s early learning outcomes.