
Abstract
Introduction
Data mining is a widely spread approach for analyzing large data repositories to extract necessary or useful information. The goal of data mining application is to extract hidden data patterns and to detect relationships between parameters in a vast amount of data. The exploration of data in education using data mining techniques is commonly known as educational data mining. 1 Different educational data are stored in large databases. This is especially true for online programs, for the support of teaching processes and in which student learning behaviors can be recorded and stored. The most common type of such information systems is learning management system. 2 Many educational institutions evaluate the performance of their students based on final grades which depend on a course structure assessment and learning objectives to achieve an effective and consistent learning process. 3
In this article, cluster analysis and decision tree technique are used to analyze student behavior for a real e-course during one semester. The data used for analysis are event logs downloaded from an e-learning system for one e-course at a higher education institution in Croatia for a student generation in 2017/2018. The file in which information system records are stored is called a log file and the data in it are called event logs. 4
Cluster analysis is a technique for creating organized collections of patterns into groups based on their similarity of some property or action. 5 Because of the fact that cluster analysis is used for different purposes in educational data mining, one of the most interesting areas of its application is for grouping the students to identify typical patterns of behavior. 6
The purpose of decision trees is to identify specific object classes. Decision trees use different object attributes to classify different object subsets and do not use just one attribute or a fixed set of attributes. 7 The attractiveness of decision trees is in their easiness for understandability and interpretability.
The aim of this article is to investigate which recorded elements of student behavior in the e-learning system could contribute to successful passing of exams in the observed e-course. The research questions this article is trying to answer are as follows: Which student information can be extracted from event logs of an e-learning system? Which variable values have a significant influence on grouping students with regard to their behavior in the e-learning system?
The motivation for writing this article comes from finding a course that is interesting to analyze due to its variety of student activities based on which advanced data mining techniques can be applied to improve content management in that course. The quality of e-course execution at higher education institutions in Croatia reflects the quality of teaching according to which higher education institutions are ranked.
In the literature review, an analysis of the existing literature is conducted. In this chapter, educational data mining, application of logs, cluster analysis, and decision tree technique are researched. Further on, research methodology of this article is presented with the aim of introduction on research data and research technique. Methodology is followed by a description of the results obtained by cluster analysis and decision tree technique. Article ends with final discussion remarks on perceived knowledge and future work.
Literature review
Logs could contain a wide range of information about process executions. 8 Data mining shares some characteristics with automatic process discovery techniques, and in data mining, “meaningful information is extracted from fine-granular data, so that these techniques of automatic process discovery are subsumed to the research area of process mining.” 4
Data mining is the process of extracting useful information and knowledge from a large set of data warehouses. It involves the application of data analytics tools to detect unknown patterns and relationships in large data sets. 1 “Data mining is a multidisciplinary area in which several computing paradigms converge: decision tree construction, rule induction, artificial neural networks, instance-based learning, Bayesian learning, logic programming, statistical algorithms, etc.” 9 In addition, some of the most useful data mining tasks and methods are statistics, visualization, clustering, classification, and association rule mining. These methods reveal new, interesting, and useful knowledge based on the available information. 9
The application of data mining techniques on educational data is called educational data mining. 6 The primary goal of using data mining techniques in the field of education is to develop models by which we can predict the overall performance of students in selected courses. 1
The steps to improve the level of education are as follows:
Creating data sources of predictive variables.
Identification of different characteristics or factors that influence student learning performance during academic life.
Construction of a predictive model using classification data mining techniques based on predictive variables.
Validation of a model that was developed according to students’ performance while learning. 10
As there are many databases containing students’ information, it is possible to operate with large repositories of data reflecting how students learn. 11 Folino et al. were investigating the usage of external-memory decision tree induction approach to deal efficiently with large logs. 8 Data mining techniques economically provide adjustable education, effectively improve the system, and reduce the costs of an educational process. 10 Higher education institutions are concerned about the quality of education and use a variety of ways to analyze and advance understanding of student achievements. 3 In the context of teaching and learning, student data can be used to create and construct predictive models through which student performance can be identified. 3 “By extracting information from data, it is possible to generate process models representing various process scenarios in education.” 11 Asif et al. state that the aim of forecasting in educational data mining is to predict students’ educational outcomes. 6 Examples of data mining techniques usage in the e-learning process are assessing student learning performance, ensuring course adjustment, and generating learning recommendations based on student behavior while learning, evaluating teaching materials and educational courses, providing feedback to teachers and students, and discovering atypical student behavior while learning. 9
Márquez-Vera et al. present a method for predicting student success, which consists of the following commonly used steps in educational data mining:
Various data mining techniques such as classification and clustering are applied to reveal hidden knowledge from educational data. 6 Clustering is used by pattern analysis, decision-making, and machine learning, which includes data mining, document retrieval, image segmentation, and pattern classification. 5 Various pieces of information stored for each event can be used for clustering, correlating, and finding causal relationships in the event logs. 4 Using cluster analysis, we separate students into groups, so that students in the same group share the same progression within the group. 6 Data clustering used with k-means algorithm enables teachers to predict student performance and associate learning styles of different learner types and their behavior with the aim of collectively improving institutional performance. 13 K-means is the most popular and the simplest partitional algorithm used for clustering. 14 “Measuring the similarity of two objects is done by calculating a distance measure such as the Euclidean Distance attributes having numerical values.” 6
Several methods have been developed to solve classification problems. Among all these methods, decision tree is recognized as suitable, because it is considered to be one of the most commonly used methods in the supervised learning approach. 15
Decision tree is a classification algorithm that is displayed in the form of a tree in which two different types of nodes are connected by branches. 3 The induction of the decision tree is done through a supervised knowledge discovery process in which prior class knowledge was used to channel new knowledge. 16 The tree consists of internal nodes that match the logical attribute test and the connecting branches which represent the test outcomes. 6 The decision tree classifies instances by sorting them down the tree from the root to the leaf nodes. 2 The decision tree is considered to be a procedure that decides whether a particular value will be accepted or rejected, uses IF-THEN rule, and ensures that the current state is mapped to a future state to make a different decision. 3 IF-THEN rule is one of the most popular forms of knowledge representation because it is easy to understand and interpret by nonexpert users and can be directly applied in the decision-making process. 12 The nodes and the branches form a consecutive path through the decision tree that reaches the leaves, and it represents a specific mark. All the nodes in the tree correspond to a subset of data. Ideally, the leaf is clean, which means that all elements in the leaf have an equal chance of being a target variable or a class. 6 In the context of learning through the decision tree, the target variables refer to attributes. Each attribute node splits a set of instances into two or more subsets. The root of the tree corresponds to all instances. 17
Decision trees are easy to understand and well adapted to the classification problems. They suffer from a sensitivity of the data used in their construction and they are a less natural model for regression. The advantage of decision trees is that there is a large number of efficient algorithms, which can find approximately optimal tree architectures. 18 In addition, decision trees are able to break down the complex problem of decision-making into several simpler ones. 15
The steps in decision tree building are as follows: Suppose Suppose We use attribute values to divide the set of objects We create a child node in the tree for each attribute of the For each child node, we recursively call the procedure over the subset
Decision nodes are usually represented as squares and child nodes are drawn to the right of their parents. 19 The decision tree can be used to predict and classify new students depending on their activities and decisions made, because the attributes and values, which are used for classification, are also represented in the form of a tree. 9 According to knowledge from the data associated with the execution of numerous traces, the aim is to build a decision tree model for use to predict membership into the clusters for forthcoming enactments. 8 In comparison with other data-driven approaches, decision trees are easy to understand and their application does not include complex computer knowledge. 20
Methodology
In this paragraph, research methodology used for conducting the analysis will be presented. First, the proposed model for educational data mining using cluster analysis and decision tree technique is presented. Then, the data source and the data type are described.
Educational data mining model
According to the literature researched in the previous stage, the activities shown in Figure 1 are recognized as some of the most important ones in educational data mining using cluster analysis and decision tree technique.

Educational data mining process using cluster analysis and decision tree technique.
First, the analyst needs to select a data set to analyze, that is, to select the targeted e-course. After selecting an e-course, log files from an e-learning environment need to be downloaded. On the basis of the downloaded event logs, the next phase of the educational data mining process can be provided. When the data are downloaded and stored, data cleaning activity can be launched. In this activity, the data analyst performs unnecessary data cleaning and data separation of information that are not relevant for the analysis. After data cleaning activity, data partitioning is performed. This means that the relevant data are extracted and combined for further analysis. This activity depends on data mining techniques and the outcome of the analysis. Once there are manageable data, the application of cluster analysis can be performed to create groups of students similar within the group and different to another group.
According to these groups, it is possible to apply another data mining technique over the obtained data, for example, decision tree technique. In other words, after having the obtained data from cluster analysis, the same could be exported and prepared for decision tree technique implementation. When there is a model resulted from the previous activities, the model validation can be performed. The analyst should be informed in a way of controlling the correctness of the resulting model. After confirming the model validation, the obtained model can be interpreted according to the results.
Data description
The data used for the analysis are event logs downloaded from an e-learning system for one e-course of a higher education institution in Croatia for a student generation in the 2017/2018 academic year. The time span in which the data were observed was from February 2018 to June 2018. Originally, there were 62,985 records, and after data cleaning and removing around 3000 records about course administrations and teachers, 59,605 records remained for analysis. These records represented the raw data which consisted of access date and time, student names, context (e.g. lecture materials), component (e.g. “record”), activity description, source (e.g. “web”), and the IP address of the student who accessed the e-course.
The data cleaning included removing information about the activity of system administrators and teachers because only students’ behavior in the e-learning system was interesting for this analysis. In addition, due to the sensibility of the data and privacy, only a subset of anonymized data was extracted for further analysis. In total, there were 185 students participating in the e-course during the semester. There were two mid-term exams which were performed in April 2018 and in June the same year. Each mid-term exam had 40 points at maximum, and there was no threshold for the required minimum points. The results of the mid-term exams were assigned for each student individually in the e-learning system.
As stated in previous research,
11
the following variables were recognized as significant for cluster formation: “Context” from the event logs that provides information about the e-content type. A description of the activity that relates the activity with the unique student identification label.
Previous research aimed to find groups of students according to their behavior in the e-learning system but another generation. By applying the same variables on another data set (the generation 2017/2018 in this case), the usefulness of the context variables is tested. To further analyze and understand student behavior, this study takes a deeper approach and applies additional decision tree technique on data.
The values of the variable “Context” were as follows: access to lecture materials, access to auditory materials, access to laboratory materials, and access to forums. Lecture materials were available to students each week when the teaching topic was processed. Before or after the lectures, students were able to download the teaching materials from the e-learning system. Before auditory exercises (AEs), students were able to download and print teaching materials so they could easily follow the class. On average, it took about five clicks to download each material. Laboratory exercises (LEs) were held in laboratory classes at a higher education institution where students were asked to show independency in solving the assignments. During the class, students were required to download e-learning materials, which also required approximately five clicks. The forums consisted of a Discussion Forum, where students were able to ask questions about the e-course and communicate mutually, and a News Forum that contained news related to the e-course and teacher consultations, which were addressed by the teachers themselves.
After data cleaning, a pivot table was created, containing information about frequency of access for each student according to his or her recorded identification label. Frequency of access to the e-content shows the popularity of the content, and the “popularity” can be measured by how many times requests are made for the e-content during the semester. 21 By the frequency of access to the e-content in the e-course, it is possible to determine which e-content students recognized as relevant for passing the mid-term exams and whether the frequencies of the access influenced the final outcome of the exams. 11 So, the pivot table contained student identification labels in a form of numbers and numerical frequencies of access to materials from lectures, AEs, LEs, and forums for each student. This table was imported into RapidMiner 22 tool that has been used for performing the next data mining techniques: cluster analysis and decision tree. These data mining techniques were selected because, according to the literature, 12 data mining uses a more direct approach, such as the percentage usage of well-classified data, while statistical techniques are usually used as a quality criterion for the veracity of the data given model. Besides, data mining techniques work well with very large amounts of data, while the statistics does not work well in large databases with high dimensionality.
The tool settings for the cluster analysis were the applied algorithm was k-means, the number of groups was 3 (according to testing, it was considered to be the best value with promising results), the grouping variable was student’s ID, the method chosen for normalization was Z-transformation, measure types for grouping were numerical measures, and chosen numerical measure was Euclidean distance. Finally, the selected influential variables on grouping were frequencies of access to materials from lectures, AEs and LEs, and forums.
The tool settings for the performance of decision tree technique were respectively: the target variable whose outcome was intended to be predicted is the number of students’ points achieved in two mid-term exams where both mid-term exams amounted to 80 points in total. Student’s points are the variable that yields the highest information gain. Further on, the method chosen for normalization was Z-transformation, the criterion by which the decision trees were created was the least square, maximal depth of the trees was 10, minimal leaf size was 2, minimal size for split was 4, and a number of prepruning alternatives was 3. These settings were applied to all decision trees which resulted from this research. The difference was in the size of the minimal gain, and it was as follows:
For the decision tree of the cluster number 0: 0.105.
For the decision tree of the cluster number 1: 0.081.
For the decision tree of the cluster number 2: 0.08.
These values were chosen considering the best resulted branching of the trees and the acceptability of the results for interpretation according to previously obtained clustering models.
Results
The educational data mining analysis, conducted in this research, resulted with one model by cluster analysis showing groups of students according to their behavior in the e-learning system and three models of decision tree made according to previously conducted cluster analysis. The following section describes the results of the grouping analysis and decision tree. In addition, a box plot diagram made by points of the students from the mid-term exams is presented to show the verification of gained models by student’s success.
Interpretation of the grouping results
The aim of grouping the students was to find groups of students who were similar to each other within the group and different in respect to the other groups. The similarity depends on the behavior of the students in an e-learning system during the semester. Behavioral intention is an important predictor of student behavior that varies between different behavioral, control, and normative beliefs on the desired behavior. 23 The application of the k-means method over the data which contained information about 185 students in one e-course, at a higher education institution, resulted with the following three groups:
Group 0 contained 84 students.
Group 1 contained 82 students.
Group 2 contained 19 students.
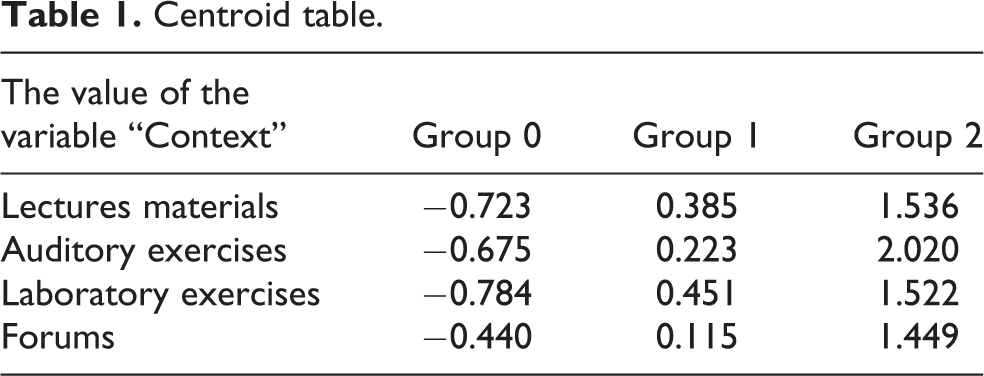
Figure 2 represents the groups of the students in a form of a tree, while Figure 3 represents the plot with the movements of the value of the variable “Context” according to the range of the centroid values.

Groups of students.

Movements of the groups according to “Context.”
Figure 2 shows the groups of students in a form of a tree. According to Table 1, which is a centroid table, group 0 contains the students who had the lowest access to the content in the e-course. This group shows weekly downloading activity of materials from LEs and lectures. Group 1 contains students who had a medium frequency of access to e-content. They mostly accessed materials from LEs and lectures. The least accessed set of materials for this group is related to forums. In group 2, there are 19 students who had a high frequency of access to materials from AEs, lectures, and LEs. Figure 3 represents a plot diagram showing the movement of groups by the value of the variable “Context” and the range of the centroid values. According to this analysis, group 0 contains the students with the lowest frequency of access to the content in the e-course, and group 2 contains the students with the highest frequency of access to materials from the e-learning system.
Centroid table.
Interpretation of the results obtained by the decision tree technique
After conducting a cluster analysis, which resulted with one model showing three groups of students, three decision trees were created based on these groups. Each decision tree model represents the behavior of one group of the students. Figure 4 represents the decision tree demonstrating the behavior of the students from group 0, Figure 5 represents the behavior of the students from group 1, and finally, Figure 6 represents the decision tree showing the behavior of the students from group 2. The variable that gives the highest information gain is the student’s points from the mid-term exams. The nodes represent the contents of the e-course or the value of the variable “Context,” and the values on the arcs represent the frequencies of access to the e-contents.

Decision tree for group 0 from the cluster analysis.

Decision tree for group 1 from the cluster analysis.

Decision tree for group 2 from the cluster analysis.
Figure 4 represents the decision tree model for group 0 from the grouping method. The model shows that there were only a few students for whom the highest frequency of access to materials from lectures meant the highest frequency of access to other e-contents. Many students in this group had low frequency of access to lecture materials. However, those students who attended the lecture materials mostly accessed the forums. Frequent access to forums did not mean frequent access to other e-contents. Low access to forums also led to low access to materials from AEs. Low access to materials from AEs also led to low access to materials from LEs. Students with greater points in mid-term exams combined frequent access to materials from lectures with frequent access to materials from LEs.
The model from Figure 5 represents the decision tree for group 1 by cluster analysis. The more often students accessed materials from lectures, the more they accessed forums. Low frequency of access to lecture materials resulted with poor results in the mid-term exams. There were many students in this group who mostly applied the combination of accessing lecture materials and materials from AEs. Students in this group with the highest number of points in mid-term exams seemed to recognize the importance of accessing the combination of materials from lectures, AEs, and LEs. The more often they accessed lecture materials and materials from AEs, the more likely they were to score better points in the mid-term exams. Unlike group 0, group 1 consisted mostly of students who had medium frequency of access to all e-contents.
Finally, the third decision tree model in Figure 6 represents the behavior of the students from group 2. This group was the smallest and contained 19 students who had the highest frequency of access to the contents from the e-learning system. According to Figure 6, low frequency of access to materials from AEs and LEs indicated lower score on the mid-term exams. Higher frequency of access to materials from LEs and AEs, as well as more frequent retrieval of lecture materials, provided better points at the mid-term exams. Many students in this group combined all of these three elements and they achieved very good results at the mid-term exams.
This analysis indicates that, from the teacher perspective, content management in the form of focusing on the quality of theory-oriented materials is crucial due to the fact that, without a well-presented theoretical background, students cannot successfully complete the course.
Analysis of students’ achievement through mid-term exams
There were two mid-term exams in the e-course through which the students could pass the exam. Each mid-term exam contained a maximum of 40 points. The mid-term exams included two types of questions: theory oriented (mainly from lecture materials) and practical assignments (mainly from materials from AEs and LEs). 11 No minimum number of points from the first mid-term exam was required to access the second mid-term exam. Figure 7 represents the points from both exams in total for all the students in the e-course. Cluster 0 represents the points of those students who by cluster analysis on Figure 2 in this article belong to group 0. Cluster 1 contains the points from the exams of those students who by cluster analysis on Figure 2 belong to group 1. Finally, cluster 2 demonstrates the points from those students who by cluster analysis belong to group 2. As can be seen from Figure 7, cluster 0 contains the points of the students whose behavior can be described as the one with the least attention to downloading learning materials continuously from the e-learning system. Besides, the students in this group gained the lowest points at the mid-term exams. Cluster 1 contains the points of the students who had medium frequency of access to e-learning materials, and their points vary. Some students achieved low points (e.g. less than 10 of 80), and some achieved a high number of points (e.g. more than 70). Cluster 2 contains the points of the students who had the highest frequency of access to the e-learning materials. These points are globally the highest points in the e-course. According to the data on created groups and the most accessed contents by these groups, the content-related variable of behavior that makes the difference between the points achieved by the students is found in the behavior of accessing the lecture materials. Students who accessed materials from the lectures more often achieved better results at the mid-term exams.

The points of the students from the mid-term exams by the groups they belong.
Conclusion
In this article, educational data mining field was explored. This field became very popular in recent years due to the emergence of big data stored in databases containing records about students’ behavior in e-courses of higher education institutions. The quality of study programs is very important due to the competition between the higher education institutions and because of the knowledge students bring with them to the job market after graduation. Educational data mining is a part of data mining field and therefore cluster analysis and decision tree technique have been applied in the research conducted in this article. The cluster analysis resulted with groups of students according to the frequencies of access to the e-contents, confirming author’s previous research. The decision tree technique was applied to the grouping results to enable a deeper analysis of student behavior in teaching and learning processes. Based on the knowledge acquired by educational data mining, course teachers can identify the content of the e-course that is worth putting more attention to emphasize its importance and select more suitable motivating techniques to encourage students to use that content while preparing for the exams. The following research could focus on collecting data from other generations and conducting similar analysis on other courses with similar process scenarios for the purpose of revealing differences between the behaviors of students’ generations or differences that are related to course management.