
Abstract
Keywords
Introduction
In terrorist attacks in Germany and Europe, ”low-tech” tactics such as using vehicles to run over pedestrians in public spaces have been increasingly used and therefore access control is part of the ”Action Plan to Support the Protection of Public Spaces” of the European Commission (2017). By preventing unauthorized vehicle access, VSB play a crucial role to protect pedestrians and critical infrastructure from potential threats. To mitigate the risk related to vehicles running over barriers, it is necessary for site security managers to have a better understanding of their behavior. Unfortunately, the data currently available is still very limited. Most times, a single test result according to IWA 14-1:2013 ISO (2014), PAS 68:2013 BSI (2013), ASTM F2656 ASTM International (2007), Technical Guideline (TR) Mobile Vehicle Security Barriers PTI (2019), or DIN-SPEC 91414-1 DIN (2021) is available to those responsible, providing the penetration depth for one configuration. It is obvious that the performance of the barriers cannot be tested experimentally in all application conditions, which may differ significantly from the certification test conditions. However, for the barriers to be used correctly and not just to suggest safety, it is necessary to provide this knowledge in another way. One way to acquire this knowledge is by using finite element analysis (FEA). FEA allows for the examination and evaluation of various impact and site parameters of bollards, providing valuable insights into their performance and effectiveness.
By using FEA, site security managers can more accurately assess the capabilities and limitations of VSBs, gaining a comprehensive understanding of how these structures respond to different impact scenarios. This knowledge enables informed decision-making regarding the selection, placement, and design of bollards, ultimately enhancing the overall security and protection of crowded places, temporary events and iconic sites.
Several studies are devoted to numerical simulation of VSB, mainly Bjorkman and Harris (1998); Itoh et al. (2007); Ferrer et al. (2010); Tran et al. (2018); Apak et al. (2022); Reese et al. (2016). Additionally, Chen et al. (2015) derive a simplified two-mass spring-damper system, from simulations and tests of a truck colliding with a concrete-filled steel tube, to simulate the structural demands and impact forces for this collision process. Based on a parameter study, Hu et al. (2014) propose the minimum height of the barrier during impact as a performance criterion, as the height is important to prevent the truck to run over the barrier. They propose this performance criteria as an alternative to the total rotation of the barrier and foundation as used in PAS 68:2007 BSI (2013). Hu and Li (2016) also compare the new maximum force model with two other available models for orthogonal truck impacts, using four tests and 63 FE analyses. An assessment of current maximum impact force models for trucks crashing into fixed VSB is presented by Hu (2017). Deviating installation conditions to the ASTM standard certification test are numerically investigated with LS-Dyna by Liu et al. (2008). The study shows that a fixed VSB can fail with deviating site condition, even if this kind of barrier has passed the crash tests.
In all cases, the research is focused on the design of vehicle barriers and is thus primarily relevant to manufacturers. Except for Mára et al. (2020), the studies are focused on fixed VSB. The variation of different impact scenarios is not fully investigated. Goel and Pawar (2017) analyse two VSB designs under different vehicular impact speeds. Karlos et al. (2020) present a detailed guideline with analytical procedures for selecting the right VSB for specific scenarios. A numerical framework to study the impact of vehicles on VSB and numerical results with different impact configurations is presented by Valsamos et al. (2020). They suggest to use validated numerical models to certify alternative impacting scenarios. It is relevant for site security managers to demonstrate the fulfillment of the intended function of VSBs under conditions that are far from the certification test scenario. This work presents a numerical analysis procedure to determine the penetration depth of vehicles running over VSB for numerous conditions. Numerical simulations can accurately represent crash processes and thus can provide missing knowledge for hostile vehicle mitigation concepts. To exploit the FE model for this purpose, it is verified against the certification crash test by comparing the vehicle’s maximum penetration distance, the velocity-displacement curve and the motion sequence of the barrier and the truck. Based on this verified model, a sensitivity analysis is conducted, taking into account the input parameters impact speed and impact angle. The input parameters are varied using the Latin hypercube sampling method (McKay et al. (1979); Iman and Conover (1982)). Finally, a hazard area is approximated behind the VSB using the moving least squares method (Lancaster and Salkauskas (1981)) showing the penetration distance for the whole input parameter space. This method therefore enables site security managers to place the barriers with a sufficiently large protection zone behind the barrier.
Finite element analysis models
The studies of the vehicle impact use explicit time integration finite element analysis code implemented in LS-DYNA version R13-1-0 LSTC (2020a).
Barrier in physical crash test
In this paper a mobile vehicle security barrier is considered as a benchmark, the barrier is not fixed to the ground. This type of barrier stops the threat vehicle by wedging under the vehicle. Vehicles running over mobile barriers tend to penetrate farther into the protective zone because the barrier moves for some distance with the vehicle until the whole system stands still. This “smoother” deceleration is accompanied by a smaller degree of vehicle disintegration and therefore less debris dispersion. In contrast to fixed barriers, the impact energy is dissipated mainly by friction, carving the asphalt pavement and by converting horizontal to vertical movement energy. The study object in this paper is the CitySafe barrier developed by the Silbitz Group (Figure 1). The barrier is a cast component made of spheroidal graphite cast iron (EN-GJS-400-15) and has a mass of 865 kg. It consists of a baseplate with three pillars, the pillars are hollow in the lower half and solid in the upper half (see also Figure 2(b)). The solid section in the upper half of the pillars rises the center of mass to a height of 366 mm above the ground and results in better tipping behavior. A vehicle colliding into the barrier, pushes the barrier in the direction of movement until the friction resistance from the baseplate to the ground tips the barrier. Due to the manufacturing process of iron casting, the pillars are conical towards the top and the barrier has smooth edges except the edge of the baseplate and the top of the pillars. During the crash, these points are in contact with the ground and therefore ensure a better carving behavior. To move the barrier around, the middle pillar of the CitySafe has two recesses where a pallet truck or forklift can transport it. CitySafe barrier dimensions. Discretization of the CitySafe VSB FE model and section view. (a) Discretization of the CitySafe VSB. (b) Section view of the CitySafe barrer to show solid column tops.

FE-model of barrier
The CAD barrier model was supported by the manufacturer as a 3D model and was simplified regarding better discretization. The logo of CitySafe on the middle pillar (Figure 1) was removed because of the complex geometry of the letters. Also, on the top of the pillars, some complex edges were simplified. All other geometries and properties are used as in the original. The discretization was done in Hypermesh using 28,220 solid tetra elements with 8699 nodes and is shown in Figure 2(a). In Figure 3(b) the solid tops of the pillars are shown. A full-scale crash test run by the DEKRA Automobil GmbH (2017) is used to validate the FE analysis. Video material of different view angles is available in addition to the test report. Since, according to the test report and as shown in Figure 3, the barriers do not show any major damage after the crash test, the barrier is modeled with the *MAT_RIGID_020 in LS-Dyna LSTC (2020b) with a density of CitySafe barrier after the crashing DEKRA Automobil GmbH (2017).
Impacting vehicle in physical crash test
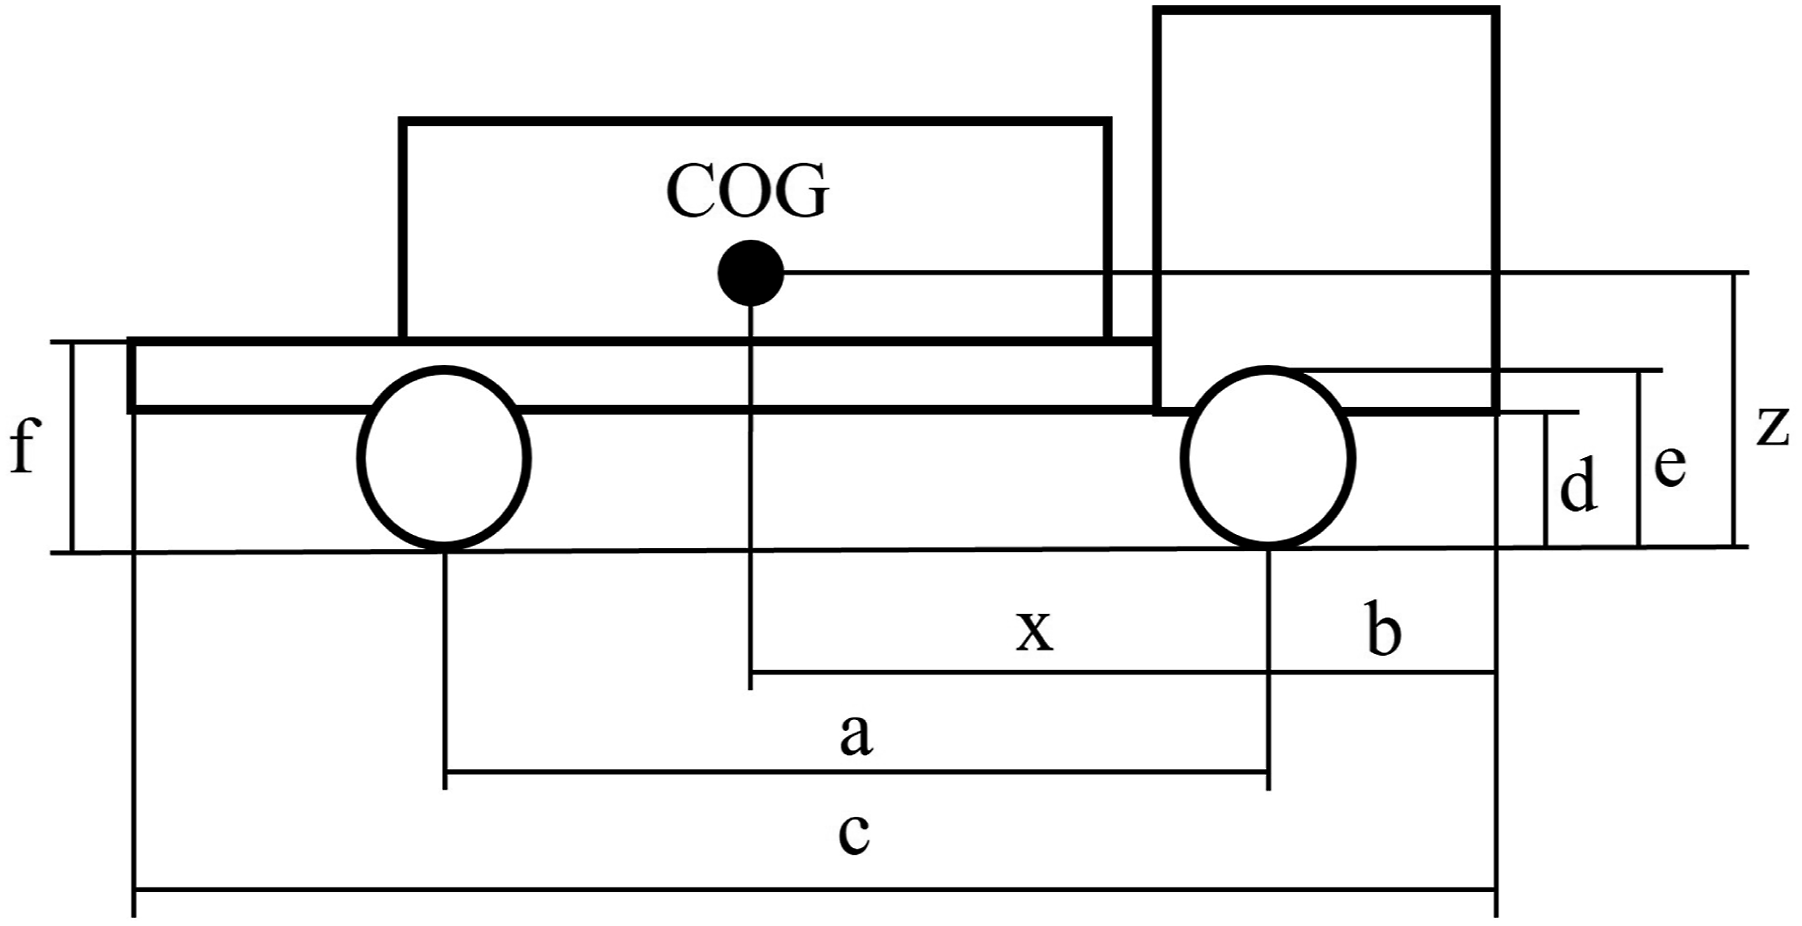
Truck comparison of the center of mass and general dimensions between experimental truck and F800 FE truck.

FE-model of impacting vehicle
The FE model of the Ford F800 single unit truck is used for the analysis (Figure 4). The truck model was developed at the FHWA/NHTSA National Crash Analysis Center (NCAC) at George Washington University as shown by Miele et al. (2005). The objective for developing this FE model was to use it as an impacting vehicle for various truck-vehicle collisions with highway infrastructure. Therefore, the model must meet the properties of an 8000S class vehicle, representing not a specific truck model rather than a class of vehicle Miele et al. (2005). The model is developed as an impacting vehicle for the computational evaluation of roadside infrastructure, therefore the complexity has been kept low for computational efficiency and to avoid structural failure in vehicle-type specific parts overshadowing the target response. The model consists of 144 individual parts with 35,193 elements and 38,711 nodes. As described by (Miele et al., 2005) the model was last updated in 2005 by improving discretization, suspension, material models, and contacts. Mohan et al. (2007) present the verification of the model against a full-scale crash test performed at the Federal Highway Administration (FHWA). The initial truck model has a mass of 8129 kg, which can be adjusted by changing the density of the ballast. For the benchmark simulation, the density of the ballast on the loading area was increased so that the total mass corresponds to the 10,196 kg total truck mass in the certification test. It can be seen that the center of mass of the F800 truck is 506 mm farther back than that of the test truck. The reason for this deviation is that the FEM model is an American long-haul truck and is therefore generally larger than the test truck, a comparison of the dimensions is given in Table 1 and Figure 5. The comparison of the dimensions shows a sufficiently good agreement between the FEM model and the test truck for the impact study. Exploded 3D view of the FHWA’s F800 FE truck model. Measured dimensions on the test truck and simulation truck.
Verification with benchmark case
The CitySafe barrier was tested as a triple combination as shown in Figure 6. To achieve the corresponding kinetic impact energy of 1185 kJ (7500 kg N2 truck with a velocity of 64 km/h) in the (PAS 68:2013, 2013) standard, the truck is loaded to 10,196 kg and accelerated to 55 km/h. Table 2 summarizes the main impact parameter of the specification, the test and the simulation. The test institute used a heavier truck than in the standards but used a lower impact speed to meet the kinetic energy of 1185 kJ. For the simulation the same specifications as in the physical test were used. One of the three barriers is positioned centrally in front of the other two barriers so that the truck strikes it before the others (Figure 6). The truck is accelerated with the help of a rope, which is released shortly before the impact (Figure 7(a)). Barrier arrangement for crash test. Comparison of specification, physical crash test and simulation. Benchmark slow motion sequence with time after impact. (a) 


The impact test resulted in a truck penetration depth of 18.1 m (farthest penetration in the direction of movement). Due to light rain, the asphalt pavement was wet while testing.
The high-speed camera shows that after the impact of the truck, the barrier tips forward in the direction of travel (Figure 7(b)). The asphalt pavement exhibits high slip resistance and serves as the pivot point for the barrier. Figure 7(c) shows a clear tearing of the asphalt surface through the edge of the ground plate immediately after the impact. The first barrier flips and pushes the truck with the baseplate upwards (Figure 8(b)). As the truck hits the front barrier first and knocks it over, the front barrier then falls into the rear two barriers and wedge altogether. At the time of 311 ms after the impact, the truck raises in the front and runs over the barriers at the front and the barriers wedge into the rear of the truck one more time (Figures 7(d) and 8(d)). At 640 ms, the wedging in the rear gives the truck a forward turning impulse and the front of the vehicle slams down (Figure 7(e)). The front hitting the pavement, instantaneous slows the truck down and causes the rear to rise, before the rear hits the ground again and the truck stands still (Figure 7(f)) DEKRA Automobil GmbH (2017). Benchmark motion sequence with time after impact from the side. (a) 
In LS-Dyna the truck has an initial velocity of 55 km/h, in that way the testing condition of a free traveling truck without further acceleration is met. The spinning of the tires was modeled in alignment to the tire size and velocity. In addition, the truck and the barriers are subjected to the acceleration due to gravity of 9.81
The ground is modeled as a rigid wall with a COF that equals Comparison of the deceleration of the simulation with different COF and certification test data.
This model is compared with the certification crash test by DEKRA Automobil GmbH (2017) using the slow motion sequence and the plot of velocity versus penetration depth. Figure 7 shows the key behavior of the vehicle barrier interaction and the simulation at the same time step. Figures 7(a) and 8(a) show the moment just before the truck collides with the barrier, which is referred to as time step zero. Figures 7(b) and 8(b) show a qualitative match of the simulation and the crash test in the same time step. The truck deforms at the front after the impact, and the barrier tips over. In the test and in the simulation, the baseplate wedges and lifts the truck upwards. It can also be observed in Figures 7(b) and 8(b) that the front barrier in the simulation also falls into the two rear barriers and becomes wedged together. The front barrier is rotated by around 160° and presses the two rear barriers with the pillars into the ground. Although the ground is modeled as a rigid wall and the barriers do not tear up the ground, the behavior of the barriers during impact is comparable. Figure 7(e) shows that the truck front in the simulation is hitting the ground at the same time. In comparison, the barriers in the simulation did not wedge under the truck once again, but in Figure 7(d) one barrier is wedging once again in the rear axis. With minor deviations, the simulation shows the same basic kinematics as the crash test.
Comparing the blue dotted line and the black test data line of the velocity-displacement plot in Figure 9, it can be seen that the truck experienced a similar deceleration. After a strong deceleration during the first few meters, a plateau follows and then after the landing of the front of the truck, the deceleration increases again. Overall, the deceleration is very similar and the penetration depth of 18.97 m in the simulation is only 0.87 m farther than in the test with 18.1 m. The benchmark test shows that the simulation slightly overestimates the penetration depth and is therefore on the safe side.
Figure 10 shows a comparison of the final position after the crash between test and simulation from the bird’s eye perspective. The image illustrates the high degree of correspondence between the final position of the truck in the simulation and the crash test carried out. Comparison of the truck end position. The orange line indicates the final truck position in experiment.
Sensitivity analysis
After verifying the simulation, various input parameters influencing the penetration depth into the protected area were identified. When a vehicle hits a mobile vehicle barrier, critical parameters such as vehicle speed, impact angle, vehicle type, associated mass, the surface of impact, ground surface, and the point of impact on the barrier come into play. The parameters vehicle speed and impact angle were selected for the demonstration of the method for the evaluation of vehicle barriers, as these are easy to change and have a high influence. In general, the method can be transferred to other input parameters. In evaluating the barrier’s performance concerning vehicle penetration, a Latin hypercube sampling algorithm McKay et al. (1979); Iman and Conover (1982) was used to create one hundred samples for different truck velocities and impact angles. The predefined limits for each input parameter are shown in Table 3.
Pre-defined input parameter limits for the sensitivity study.

To simplify the evaluation of the simulations, nodes were marked on the truck and the barrier to extract the coordinates, accelerations and velocities as time series. The node set for the output is shown in Figure 11. The nodes were chosen to best represent the corners of the truck and the barrier. Thus, the maximum penetration depth can be calculated with a Nodes used for history node set for the measurement of the penetration distance.
For each simulation, only the node with the highest resultant penetration was taken. The measurement method differs by using the resultant penetration distance from the IWA 14-1 ISO (2014) and PAS 68-2013 BSI (2013) guidelines, where the penetration in the direction of intended use of the barrier is measured. This corresponds to Impact point of the truck for sensitivity study.
Since this study aims to describe the hazard area for soft targets in more detail, the measurement of the penetration depth also deviates from the guidelines developed for hard targets with regard to the measuring points. While the loading area is important for hard targets because this is where a bomb could potentially be placed, it is the truck itself that poses the danger for soft targets. The guidelines measure the penetration of the reference point at the front of the loading area of the truck, whereas the node set mentioned above is used in the simulations. Measuring two directions leads to the phenomenon that the minimum penetration depth is half of the vehicle width, as the truck in all cases overcomes the reference line of the barrier. Figure 13 shows the 100 sample points of the FE analysis representing the maximum penetration depth, mirrored at 90°, in a polar plot. In this figure, the barrier stands at the center point.
Based on the dataset, a hazard area was generated by means of a moving least squares approximation introduced by Lancaster and Salkauskas (1981) following Habtemariam et al. (2018). In approximation, a local character of the regression is obtained by introducing position-dependent radial weighting functions. An arbitrary function Points of maximum truck penetration depth as a result of the FE analysis. MLS approximation of the truck in respect to impact speed and angle. (a) Penetration X-direction. (b) Penetration Y-direction.


The penetration in Y-direction also increases linearly for an increase in impact speed. Compared to the penetration depth in the X-direction, the penetration depth in the Y-direction and thus along the event boundary shows a sensitivity for shallow angles (Figure 14(b)). Comparing the data shown for the X- and Y-values, the importance of both values for the hazard zone becomes obvious.
Figure 15 shows the output of the MLS approximation for linear spacing in the boundaries defined in Table 3. By using colors changing from blue to red with increasing truck velocity, a hazard area can be identified near the barrier, as it also is affected with low impact velocity. Additionally, a visible sensitivity can be recognized at shallow impact angles, but overall the sensitivity is smaller than expected. The X- and Y-components of the penetration depth largely balance each other out in the resulting penetration depth, as shown in the approximation in Figure 14. Approximated penetration of the truck in respect to impact speed and angle.
Comparison to analytical method
A common method to estimate the effectiveness of vehicle security barriers is to calculate the kinetic energy of the threat vehicle based on its mass and achievable speed, as shown by Karlos et al. (2020).
(Karlos et al., 2020) show how the maximum speed of threat vehicles can be calculated for different approach routes and how the kinetic energy is calculated: Assumed speeds for the analytical method. (a) Impact at 90°. (b) Impact at low angles.

Normally, a decision whether the barrier is sufficient or not for a particular case would be made on this basis. A simple comparative calculation could also be made to calculate the penetration depth at different impact energies in relation to the test configuration. Thus, a simple approximation of the penetration depth in X-direction can be carried out with the normalization of the crash test data: Penetration in X-direction estimated with analytical method.

It is clear that no penetration depth in the Y-direction can result from equation (10) and thus Figure 17 shows both the penetration depth in the X-direction and the resulting penetration depth. The neglection of the Y-component leads to an incorrect safety prediction for shallow impact angles. The analytical approximation is therefore close to the approximation based on FE analysis of the penetration just in X-direction, as shown in Figure 14(a). Figure 18 shows a differential surface calculated by Error of analytical approach in comparison to FEM approach, shown in missing meters of penetration depth.
The plot clearly shows the insufficient penetration depth at shallow angles and at medium speeds, even just for the X-direction. This suggests that hazard zones should not be designed using such a simple analytical solution, or at least that the impact energy should not be artificially reduced for shallow impact angles. An approximation of the hazard area without artificial reduction of the kinetic energy is shown in Figure 19. For this purpose, the artificial reduction of the impact energy was eliminated, so equation (9) again becomes Proposal of approximation for analytical method.
A comparison of the two approximations clearly shows that, at least in the case of the CitySafe barrier, the analytical approximation without artificial reduction of the energy is more accurate. However, it should be noted that the penetration depth calculated with the analytical solution differs from the FE results and therefore represents a safety risk. Figure 20 shows a differential surface on how much the analytical solution differs from the FE solution. It is obvious that the analytical solution estimates lower penetration especially in the mid-range of the velocity and higher penetration for high impact speeds. This study shows that it is difficult to draw conclusions from a single crash test about crash behavior of VSB under different boundary conditions. Differential surface of analytical approximation and approximation based on FE-analysis.
Conclusions
The objective of this research was to develop a method to assist event planners and site security officers in identifying the hazard area behind VSBs through FE analysis. To accomplish this, a full-scale certification crash test was used to validate the accuracy of the FEA by comparing key features of the test. Subsequently, by varying the input parameters of the FE model, a parameter space study was conducted by using Latin hypercube sampling algorithm. To visualize patterns and trend in the parameter study the MLS method was introduced for the approximation of hazard areas and was demonstrated by using impact velocity and impact angle as input parameters. The approximated hazard area makes it possible to display the risk at each location behind the VSB caused by vehicles driving over the barrier in a single diagram. The fact that the diagram could be used in geo information systems makes it possible to apply those hazard areas directly to a map, enhancing site security officers a straight forward method of identifying site specific hazard areas.
The results of the stochastic analysis of the CitySafe VSB indicated that the penetration depth increases with higher velocity, while the impact angle has less effect on penetration depth, despite the biasing direction of the CitySafe VSB. The results thus show that a vehicle impact with a flat impact angle is just as dangerous for the protection zone as with steep impact angles. This finding is contrary to the generally used analytical solution, in which the impact energy is reduced with flat impact angles. The analytical calculation based on kinetic energy therefore tends to underestimate the hazard area for a large range of input parameters. Notably, shallow impact angles are shown to result in greater penetration depths, contrary to the analytical calculation’s assumption of reduced energy at such angles. The equation presented by Karlos et al. (2020) is intended for calculating the kinetic energy and decide if the VSB is capable to withstand a specific threat vehicle. The results of this study suggest that a more detailed analytical approach should be taken if the analytical approach is used to assess the penetration depth of threat vehicles.
Obviously the input parameters varied in this study do not cover all possible parameters. For instance, it is evident that vehicles would not always collide with the barrier at its center. It would be interesting to investigate the impact of varying the collision point along the barrier, as well as in height due to different vehicle types. Furthermore, unconventional barriers not covered by certification, such as large boulders or vehicles, which are commonly used but lack extensive knowledge of their impact behavior, could be a compelling area for future research. It is also unclear how the hazard area for a combination of barriers can be approximated together, as they would influence each other.