
Abstract
Introduction
On 22 October 2018, President Donald Trump tweeted:
Sadly, it looks like Mexico’s Police and Military are unable to stop the Caravan heading to the Southern Border of the United States. Criminals and unknown Middle Easterners are mixed in. I have alerted Border Patrol and Military that this is a National Emergy[sic]. Must change laws!
The infamous tweet, which falsely characterized the caravan of approximately 7000 immigrants heading northward from Guatemala towards the US–Mexico border, was a preliminary seed in what Shelton et al. (2014) have termed “data shadows”, those imperfect representations of the world gleaned from the digital production of everyday life. Trump’s polemical remark lit the fuse for a now well-known political fire around immigration, mobility, and border security. His tweets were well timed politically, coming just weeks ahead of the 2018 midterm elections. Given that immigration was a key issue in the 2016 presidential race, the social media outbursts were largely seen as an attempt to rouse Trump’s political base known for supporting hard line security policies. The reaction to the caravan 1 precipitated a series of plans to deploy troops to the southern border and deny Central Americans the opportunity to seek asylum (Washington Post, 2018). The message was a powerful tool in showcasing how the digital world can have exponential material effects. This brief example is yet another lesson that social media has become a political actor—a technological agent disrupting binary pairings of virtual/real and omit the material/representational.
Big Data has received significant attention in geography, largely under the rubric of digital geographies (cf. Ash and Simpson, 2016; Kitchin, 2013). Critical approaches to Big Data have stressed the potentialities of the field while noting important methodological and epistemological shifts that must take place in order to grapple with the unprecedented amount of information generated. The coverage of social media data is only beginning to gain traction, but as Shelton et al. (2014) note, interventions often leave out any explicit theorization of spatiality. Drawing on a long history of critiquing the fetishization of space, they go on to remark: Analyses that fail to go beyond a simplified spatial ontology—e.g. simply plotting data points in Cartesian space—often overlook the range of quantitative and qualitative approaches that allow one to better understand the context and meaning of such Big Data, and tend to reinforce territorial or place-based dimensions of data at the expense of thinking space relationally (Shelton et al., 2014: 170).
Notwithstanding this more recent interest, there is, arguably, a detachment between Big Data studies of social media and deeper contextual knowledge of the phenomena under observation. In other words, there are those who study Big Data and those who study say, urban governance in Eastern Europe or green economies in Nicaragua. Such studies don’t often work in tandem academically, although of course there are exceptions (cf. Mulder et al., 2016; Ruberg and Ruelos, 2020). We seek to bridge this divide by bringing our own expertise on topics related to migration to bear on social media. Admittedly, the work presented is a thought experiment in that it turns on the epistemological assumption that Big Data is necessarily at odds with particularism. Or put differently, the further out you go, the more unnuanced and generic the “data” is.
Regardless, important insights can be garnered from social media
In the following sections, we review the relevant literature on geographies of social media. We then turn to a contextualization of the most recent migrant caravans in order to analyze their alter ego in the “twittersphere”. This is followed by a discussion of our data collection and methods. In the remainder of the article, we present multiple cartographic visualizations. Our examples highlight how Twitter is a spatial technology and the ways in which a contextual knowledge of the subject under study can further inform analyses of Big Data. Finally, we conclude with a discussion on the possibilities and limitations of our work.
Social media geographies
The proliferation of Big Data, of which social media is a part, has opened up a wide range of thematic subjects for analysis. Geographers can now map events by digitally collecting social media data and Big Data with locational contents such as global positioning tags, and user location profiles (Tsou, 2015). As Kitchin (2013) has noted, data-driven science has included an increase in the breadth of data collection, the speed at which it is collected, and the notion that seemingly unrelated datasets might be brought together to yield consequential findings. Tracing the flows and generation of Big Data and algorithms has resulted in an important sub-field within digital geographies. These studies can be loosely grouped into two broad overlapping categories: research that uses social media data directly; and scholarship related to methodology and onto-epistemology associated with the digital turn.
Shelton et al. (2014) characterize some of the more prescient pitfalls associated with the “fourth paradigm” (Hey et al., 2009) of scientific research. They identify the fallacy in the “idea that the data shadows of people, machines, commodities, and even nature, can reveal difficult-to-understand social processes, simply by applying sufficient computing power to these massive amounts of data” (Shelton et al., 2014: 168). Recognition that the algorithm is not enough, i.e. the contingent (and often hidden) decisions made in which aspects of human activity are captured mathematically (Binder, 2020), is becoming a mainstay of critical approaches within digital geographies. However, across disciplinary divides, areas of focus can vary according to the platform under study.
In just under 10 years, Twitter counts nearly three percent of the global population among its users (Fiegerman, 2012; Washington Post, 2019b). Significant enough to warrant a permanent archive by the Library of Congress, it has “hosted the dialogue about everything from the Arab Spring to celebrity deaths”. 2 Unlike most social network sites, Twitter enables real-time programmatic access, making it a popular source for studying social communication. Especially relevant for geographers is the fact that since 2009 the service has allowed tweets to include geographic metadata including the location where the tweet was authored (Twitter, 2009). However, of the nearly 3.2 million articles mentioning Twitter, 3 the majority of articles are devoted to the role social media plays in our society (Smith et al., 2014). Many of these studies have emphasized Twitter as the new social square or as a platform for citizen journalism (cf. Colleoni et al., 2014). Discourse studies and computational linguistics have been key frames through which to undertake issues of “identity” and changing cultural values (cf. Bouvier, 2015) and hone in on content generation in real-time (cf. Bouvier, 2015; Lipizzi et al., 2016). Brock (2012), for example, considers ‘‘Black Twitter” as a mediator of Black cultural discourse.
Within geography, there is a growing body of work devoted to mapping various aspects of the Twitter virtual landscape (e.g., Graham et al., 2013; Lansley and Longley, 2016; Li et al., 2013). Stephens and Poorthuis (2015), whose work focuses on the strength or weakness of network relations, argue that “Twitter as a social network gives us a unique opportunity to understand how people connect across space and build networks online” (2). There is also significant focus on the relationship between social networks and the “real world”. Shelton et al. (2014) explore the connection between the geographies of Twitter and the material processes they represent through the case study of Hurricane Sandy. An important finding within some of this scholarship is the uneven distribution of data generated in social media (Crampton et al., 2013; Li et al., 2013; Tsou and Leitner, 2013). It would seem that a very small number of core users tend to drive the majority of the traffic on Twitter.
Other scholars have studied the reliability of key methods associated with language and location of content in Twitter. Graham et al. (2014) report a disconnect between user-entered profile locations and the physical location of user tweets. One corrective approach is to utilize geocoded samples (Hecht and Gergle, 2011). Geo-coded tweets can be used to document all sorts of language practices. Stephens, 4 for example, tagged over 150,000 tweets to create an interactive database of racist and homophobic tweets. Images have also begun to be included in analyses of social media within geography. Rose and Willis’ (2019) study of digital image files of the smart city reveal tweeted images to be an important affective field in the generation of the “urban”.
Despite the breadth of research hinted at here, less attention has been devoted to social media and migration/mobility, although there are some important exceptions. Hawelka et al. (2014) analyze geo-located Twitter messages to estimate the volume of international travelers by country of residence. Using the community structure of the Twitter mobility network, they are able to recreate mobility patterns by region. A recent article by Marlowe (2019) presents a digital ethnography of refugees settled in New Zealand. The goal is to examine transnational practices of social media and its influence on integration. Marlowe concludes that social media platforms are increasingly important for long-term connectivity within a diaspora context.
Even within geography, little scholarship has discussed Twitter as an explicitly spatial technology. We argue that Twitter secretes space in a number of ways. Broadly speaking, Twitter fosters horizontal linkages (Warren, 2015) and enacts spatial communities. In a word, Twitter is agentic. As a platform, Twitter is a pollinator which contains or carries exogenous “material” re-mapping zones of contact. It operates according to topological and relational logics whereby new connectivities emerge. Additionally, a general trend within these studies is a primary focus on social media with a secondary thematic emphasis. In partial response to that pattern, and in order to move from
The production of the #migrantcaravan
In that spirit, we hope to evaluate and deconstruct the productive digitalities around the migrant caravan in relation to our knowledge of it. Returning to our opening example for a moment, itself an exemplar of the disjunctures in material conditions and social media refractions, we ask: how does the migrant caravan on Twitter coalesce into a perspective and what kind of prism does it provide on aspects of security and borders? We begin with background on the migrant caravan(s), and follow up with a discussion of their attendant digital spaces. Although migrant caravans have received an unprecedented amount of attention under the Trump administration, they have been around for almost 10 years. The caravans are rooted in a longer Roman Catholic tradition of the Stations of the Cross which re-enact Christ’s final steps prior to his crucifixion before Easter. Central American mothers, some of whom lost children to the journey north, found solace in the quiet act of protest by re-tracing the steps of their loved ones. The caravans of 2018 were organized by a small group of Hondurans, and gained widespread recognition only after the Trump administration began disparaging them. Several media outlets (CBS, 2016; NBC, 2019) have focused on the “waves” and “flows” of unprecedented migration from Guatemala, Honduras, and El Salvador. Some commentators have stressed that migrant caravans are far from “organic”. There is some merit in these reports. For example, the use of social media within the caravan is plagued by misinformation and illicit networks have taken advantage of, or infiltrated these groups in some cases (Correa-Cabrera and Nava, 2011). Nevertheless, a deep analysis would still consider such mobilities a response to a longer standing humanitarian crisis.
The plight of Central American migrants (and to a lesser degree Mexican migrants) is connected to in-country conditions as well as hemispheric politics. The countries of El Salvador, Honduras, and Guatemala in particular have been dubbed Latin America’s “most murderous” corner (Wall Street Journal, 2018) due to issues of insecurity, impunity, and systemic violence. Conditions within the region are intricately related to the history of United States involvement. These are well-documented phenomenon, so we will not rehearse them comprehensively here. It is worth noting however, that US intervention in the 20th century has included overturning democratically elected governments in favor of “friendly” dictators. Early on these activities were motivated by protecting US business interests, specifically United Fruit and Standard Oil. Later, the region was caught up in Cold War Politics (c.f. the 1954 CIA orchestrated coup in Guatemala). 5 Jumping ahead to 2009, the US State Department supported a military coup that overthrew President Manuel Zelaya, Honduras’ democratically elected president. This more recent example is a reflection of how US involvement has contributed to political instability, economic inequality, and the militarization of the state. In the case of Honduras, the public sector has paid the price; education and healthcare have been annihilated; and gangs and paramilitary organizations vie for control. Honduras now has one of the highest death rates outside of a war zone. 6 In Guatemala, El Salvador, and Honduras, poverty, violence, and distrust of institutions have become drivers of migration (Obinna, 2020). Most recently, scholars and policy analysts have begun to acknowledge the role of climate change in displacement. The aforementioned countries are reliant upon agriculture, an endeavor that is increasingly risky due to factors such as increased temperatures, drought, tropical storms, and landslides. These realities have a compounding effect that adds to the devastation in Honduras where 65% of people live in poverty.
Mexico is caught up in hemispheric politics in myriad ways, some of which diverge from what we have described above. Since 2001, under the first iteration of
The externalization of border security sets a dangerous precedent (Miller and Nevins, 2017). The pathways through which the US provides funding, equipment and training to police mobility and goods, have resulted in numerous human rights abuses and violations of sovereignty (cf. Hiemstra, 2019; Walker, 2015). A recent manifestation of extraterritorial extensions of the border are the “safe third country agreements” 7 between the US, Mexico, and Guatemala. These agreements would bar asylum applications in the US from El Salvador, Honduras, and other asylum seekers who transit Central America and Mexico.
Many of the rationales for beefing up borders both near and far from political boundaries come under the guise of “security”, a framing that “continues to serve as a powerful justification for exceptional US actions, especially toward particular racialized groups” (Hiemstra, 2019: 45). However, security in the context of borders is narrowly construed as securitization. Such a move pulls the issue away from the public sphere and into the realm of national security, at the expense of a broad-based human security (Walker and Winton, 2017). The latter would recognize the “discordant” nature of borders along with the diverse and simultaneous mobilities necessary to a security not reduced to a militarized conception of borders founded on logics of threat.
A subtext of our contribution is that the medium is of, and not separate from, its object. Thus, it is worth recalling that the migrant caravan spurred Trump’s bombastic outrage where he took to Twitter to declare the caravan a threat to the US’s “border and sovereignty”. All of this, in spite of the fact that those targeted (nearly 4000 Hondurans) had not yet reached Mexico. 8 While the viral response to the migrant caravan ran the gamut of the political spectrum, it also highlighted how technology propagates misinformation and gives nefarious actors a platform to spread their messages. In his work on the “rumor caravan”, Jonathan Albright 9 tracks the false claims of linkages between the leftist billionaire George Soros and funding for the caravan. The same platform can yield different sorts of fictions, some more powerful than others.
Data and methods
Early on, a goal of this research had been to think about how those traveling in the caravan of 2018 were utilizing social media technology. Our fieldwork with migrants suggested that WhatsApp was a primary mechanism of communication. We wanted to know what role those in the migrant caravan “on the ground” were playing “online” in the #migrantcaravan. Granted, like many first articulations of a research interest, it was a bit flawed. Obviously, encryption and data privacy prevented us from mining WhatsApp. Nevertheless, the fact that the migrant caravan had produced such a political maelstrom on Twitter led us to think more deeply about the connection between information producers and material phenomenon. An early insight to emerge from the data, described in detail below, is the sparse representation of those in the caravan on Twitter; the migrants are absent from the #migrantcaravan.
The dataset for this study was extracted from an historical tweet archive using Twitter’s Premium search API. 10 This API provides access to the entire publicly available historical tweets, which can be searched based on one’s data needs. In our initial search, we used the most prevalent hashtags mentioned in the news media related to the Central American migrant caravans traveling from the Guatemala–Mexico border to the Mexico–United States border: #migrantscaravan; #migrantcaravan; #hondurancaravan; #CentralAmericanTwitter; and #méxicoguatemala. The nature of Big Data limits our capacity to analyze every single tweet, but we can surmise from the méxicoguatemala hashtag (and perhaps other hashtags) that there are correlated tweets in Spanish. However, our analytic focus is on English-language tweets, itself a bias and limitation.
For each hashtag we searched for tweets from January 2018 to December 2019. Only two of the hashtags returned the most tweets (118 tweets for #migrantscaravan and 109,489 tweets for #migrantcaravan). We merged tweets from these two hashtags for our sample tweets, which covered a total of 109,607 tweets, with 11,572 unique tweet contents beginning from 7 April 2018 (earliest recorded tweet in our sample) to 4 July 2019. The merged data (sample tweets on the #migrantcaravan) were imported into R for cleaning (e.g., removing links, @username, punctuation, and blank spaces from tweet contents) and later exported as an excel file for further analysis.
The first analysis we conducted was to determine the conversational archetypes or structures within the twitter data on the migrant caravan. For this analysis, we used NodeXL, which is an open-source social network analysis plug-in in Excel (Hansen et al., 2019). The cleaned data from R was exported as an excel file containing column fields for each tweet such as “date” (date of tweet), “text” (content of tweets), and “user” (the user that post this tweet/retweet). This data was imported into NodeXL, allowing for building a network graph from the data: Twitter user A (serving as node A) is connected to (has a link/edge to) Twitter user B (serving as node B) if A retweeted B’s tweet (or vice versa) or if A mentioned B in her/his tweet (or vice versa) as illustrated in Figure 1. There was a total of 23,788 users (nodes) and 46,095 links/edges among these users.

Connection or link/edge between two nodes (or users) in the Twitter data.
Illustrated and discussed by Smith et al. (2014), the NodeXL’s classification algorithm uses particular network metrics to delineate six main conversational structures, and we discuss four of such structures relevant to this article (see Figure 2). The first structure, polarized crowds, involves a network with two or more large groups that are disconnected, and with very few isolates (nodes that are unconnected). These communities form around divisive topics and often illustrate the formation of “echo chambers,” a term used to describe how certain views are reinforced due to peoples’ likelihood of talking to those who share similar views (Cameron and Geidner, 2014; Sunstein, 2000). The second structure, tight crowd, involves multiple large groups within a network that are connected, with very few isolates (e.g., conversations on hobbies, professional topics, and conferences among people who belong to the same group or share similar views). The third structure, broadcast network, involves a network with one large group (and sometimes a secondary group) with many edges/links directed towards it (high indegree), and with moderate number of isolates (e.g., a news media or famous individuals who may people are connected to). Finally, the community cluster involves a network with many small and medium groups having some connections among these groups, and with few isolates (e.g., groups emerging around global media issues such as the migrant caravan).

Analyzing conversational archetypes from Twitter data. Adapted from Smith et al. (2014).
The second analysis involved conducting a sentiment analysis and content analysis of the tweet contents for five groups of conversational structures that emerged. Sentiment analysis is variously referred to as subjectivity (Lyons, 1981), semantic orientation (Taboada et al., 2011), opinion mining (Liu and Zhang, 2012; Pang and Lee, 2008), or studying emotion (Ortony et al., 1988) and affect (Batson et al., 1992). It simply refers to evaluating opinion(s) towards a topic, person or idea by capturing the degree to which words or phrases used in a text are expressing positive or negative sentiments (Osgood et al., 1957). According to Taboada et al. (2011), two main approaches are used to extract sentiment automatically: supervised classification or lexicon-based approaches. The supervised- or statistical-based classification uses machine learning to build classifiers from labeled texts or sentences to train a supervised algorithm on a specific dataset (Salvetti et al., 2006). The lexicon-based approach, used in this article, involves building, manually or automatically, dictionaries of adjectives (words or phrases) and their semantic orientation (positive or negative sentiments), and extracting the adjectives from the text and annotating these adjectives with their corresponding semantic orientations in the dictionary (Turney, 2006; Turney and Littman, 2003).
We employed the semantic network analyzer in R, which uses the sentiment dictionary by the National Research Council Canada to compute eight different emotions (anger, fear, anticipation, trust, surprise, sadness, joy, and disgust) and their corresponding semantic orientation (positive or negative) in a text (Mohammad and Turney, 2013). Thus, for each of the five groups of conversational structures, we computed the different emotions and semantic orientations expressed in the tweets of users (nodes) within the structure. To gain a deeper understanding of these semantic orientations and emotions of the tweets, we used the text analysis feature of NodeXL Pro (Sevin, 2014; Smith et al., 2009) to extract the most occurring word pairs associated with each of the five groups of conversational structures, which further illuminated or provided context to the sort of emotions and semantic orientations observed in the five groups.
Finally, since each tweet was geolocated (user location data was associated with each tweet), we employed hexagonal cells or hexbin maps (i.e., overlayed the area of study with a grid of hexagonal cells of varied sizes) to explore whether spatial patterns and meanings could be inferred from the tweets. Previous studies on mapping geotagged tweets utilize hexagonal cells in their cartographical analysis (e.g., Shelton et al., 2014) because this approach helps to address a number of challenges, including: showing intensity when plotting thousands of points (e.g., geotagged tweets); normalizing the number of tweets across small and large geographic regions to ensure easy comparisons and inferences across varied geographically sized areas; and varying the sizes of the hexagonal cells to account for different scale levels (see detailed discussions on this approach in Birch et al., 2007; Carr et al., 1992). We used 130-km wide hexagonal cells to map tweets at the global scale (shown in Figure 5) and 65-km wide for tweets at the national (US) scale (shown in Figure 6). The number of tweets within the hexagon units for both global and national maps were normalized by calculating the odds ratio and taking the lower bound of the 99.9% confidence for each unit, which is expressed as follows

Results and discussion
Conversational archetypes in the migrant caravan Twittersphere
We observe four main conversational structures emerging from the twitter conversations about the Central American migrant caravans traveling from the Guatemala–Mexico border to the Mexico–United States border (see Figure 3). First, we observe a polarized crowds structure involving two large groups (Groups 1 and 2) that are minimally connected to each other, and seem to serve as echo-chambers for users within these two groups. In this instance, our polarized crowd structure suggests that people are talking about a phenomenon that are not directly involved in (i.e., they are not traveling with the caravan) with like-minded people. As such, there is distance both from the “object” and from divergent opinions.

Conversational structures/archetypes emerging from the Twittersphere on the Central American migrant caravans.
Second, a closer look at these two polarized crowds further reveals that Group 1 is mostly a broadcast network with many connections or edges/links directed at very few users or nodes. A small number of people create the largest amount of noise, so there is a distortive effect in terms of representation. However, network maps represented in these Twitter conversational archetypes help to locate key people within these conversations who serve as “hubs”. Other Twitter users repeat or retweet what is said by these hubs (Smith et al., 2014). One of the hub users within this Twitter conversation, or the user with the highest number of edges directed at him/her in Group 1, is a reporter at the Associated Press (AP), an US-based not-for-profit news agency. Out of the 20,450 links directed at the 10,056 users in Group 1, 48% of these links are directed at the AP reporter, and the next highest user has about 0.1% links directed at her/him. The users in Group 2 are mostly right-wing conservatives with Twitter names like MAGA Nationalist; Freedom MAGA Eph. 6:10-18; JoeTrumpGuy; Trumplican; and BuildTheWall. In fact, the user with the highest links directed at it within Group 2 is Sandpiper, who tweeted this, “Ocasio-Cortez compares #MigrantCaravan to #Jews fleeing Holocaust! Hummm help me out like I’m a five year old.”
Sandpiper’s tweet captures the intensity of feeling as well as the political polarization often reflected in the tweets of Trump supporters.
From these two conversational archetypes (polarized crowds for Groups 1 and 2, and broadcast network for Group 1), we see another two conversational archetypes. The first is community clusters (Groups 3, 4, 5 and the other unnamed clusters in Figure 3). Conversational archetypes often reveal some group of “bridge” users who have connections/links across other groups and play an important role in passing information(tweets) from one group to another, often resulting in tweets “going viral” (Smith et al., 2014). These clusters, or bridges, emerged from the two large groups (Groups 1 and 2). That is, these community clusters took information from the two large groups (the broadcast network for Group 1 and the right-wing conservative network for Group 2), and passed the information on to small and medium groups in their discussion of the migrant caravan. Effectively, the community cluster served as a launching pad for new conversations across and within small and medium networks of Twitter users.
Visualizing the conversational archetypes elucidates how these structures emerge and coalesce in fundamentally spatial ways. The notion of a “distributed network” (Galloway, 2001) is useful. Connectivity defines the landscape of the network, wherein each node may establish direct communication with another node. However, somewhat paradoxically, nested hierarchies—in this instance, the broadcast network—marshal power at different nodal points. “Like topographic maps of mountain ranges, network maps can also illustrate the points on the landscape that have the highest elevation. Some people occupy locations in networks that are analogous to positions of strategic importance on the physical landscape” (Smith et al., 2014).
In some instances, users within some of the community clusters (e.g., Groups 3 and 4) seemed not to talk to each other. This is not surprising if you think of these clusters as analogous to a market or bazaar where people tend to congregate in certain areas. We also see tight crowds (the fourth conversational archetype) emerging from Group 5 and the other unnamed group clusters in the middle quadrant of Figure 3. Tight crowds reflect Twitter’s agentic structure eliciting how mutual support produce proximity and high degrees of interconnectedness. These conversational archetypes and the five delineated groups from the Twittersphere triggered our curiosity to look deeper, in the next section, into the data shadows of this Twittersphere.
Emotions and sentiments within the conversational archetypes
Our aim in this section is to distill the representations of the #migrantcaravan that reinforce certain imaginaries and discourses around issues such as borders, security, and migration/mobility within (echo-chambers) and across groups. First, we conducted a sentiment analysis for the entire set of tweets within our sample (11,572 unique tweets) to understand the semantic orientations, valence (positive or negative), and emotions (anger, fear, anticipation, trust, surprise, sadness, joy, and disgust) expressed in the tweets (see Figure 4). A positive semantic orientation, or what is referred to as
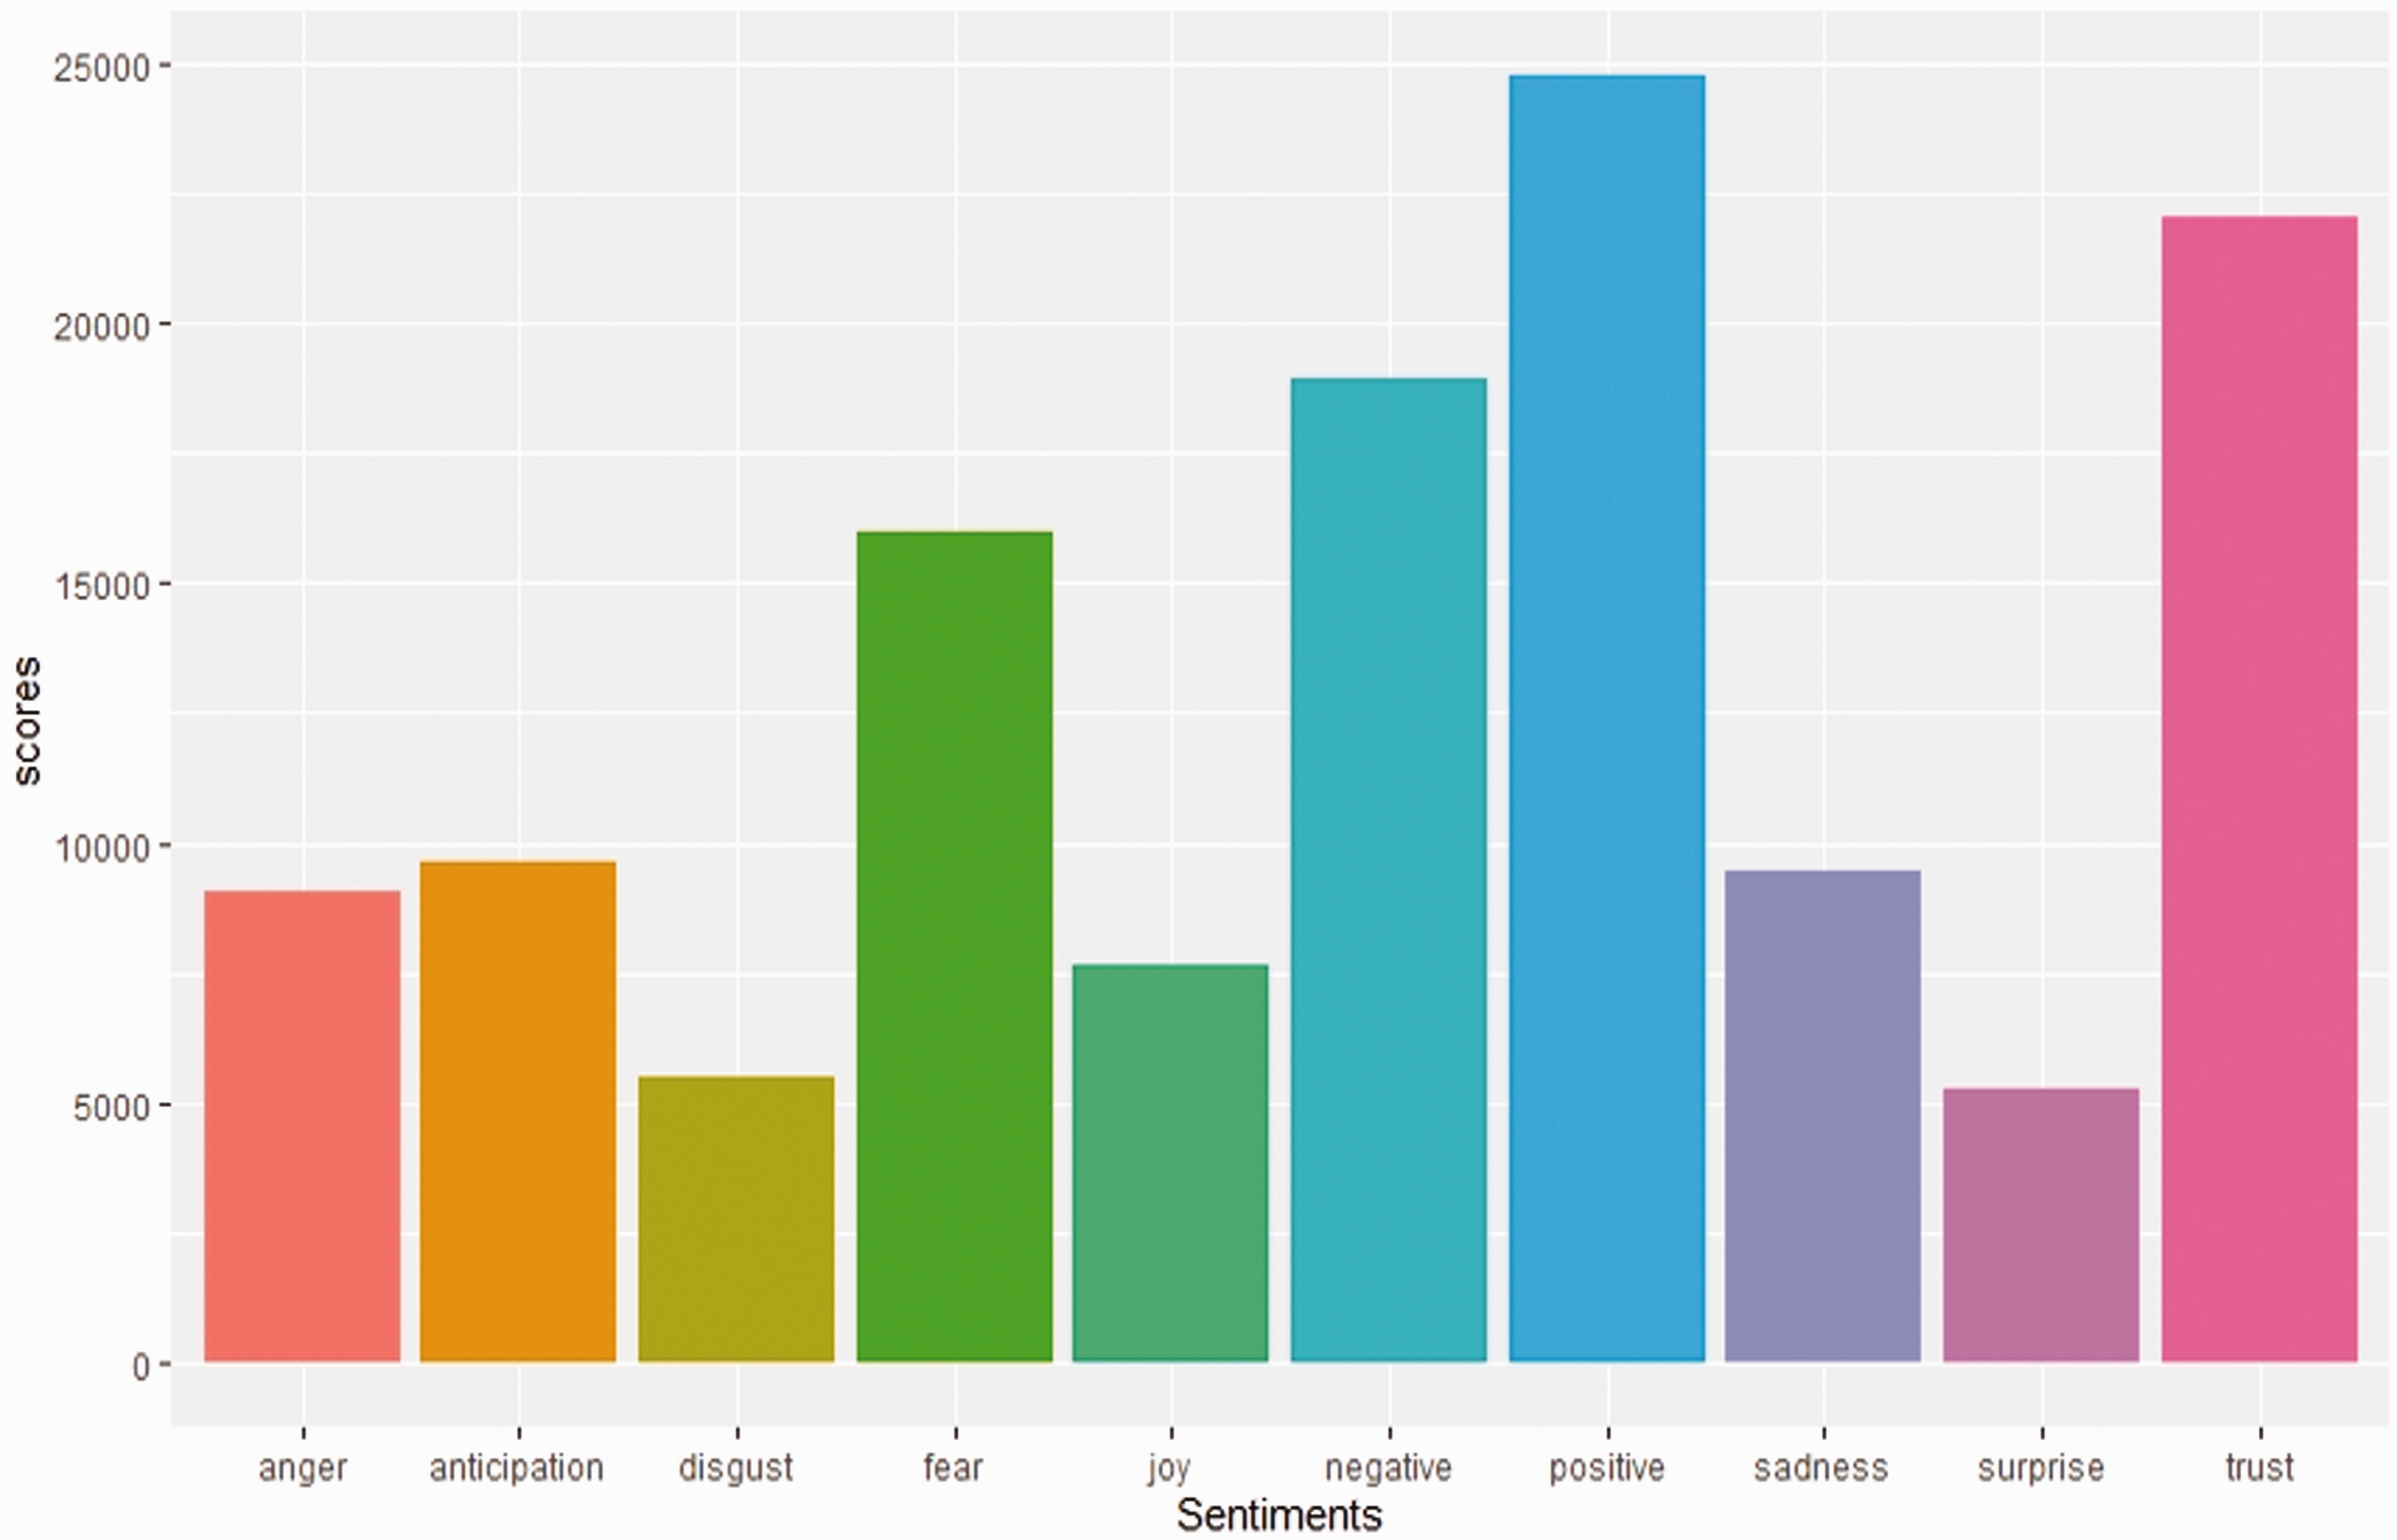
Sentiment analysis of the sampled tweets about the Central American migrant caravans.
A major limitation of employing semantic analysis is the coarseness and imprecision of using these eight different emotions to classify thousands of different peoples’ articulations of a contentious political issue such as the #migrantcaravan. These emotions do not capture nuances, subtleties, directionality, and complexity embedded in these emotions. An approach we used to remediate this limitation, albeit insufficiently, was to extract the most recurring word pairs within each group to have a sense of the main descriptors (e.g., subject, object, (ad)verb, or adjective) of the tweets within the groups. We used these descriptors as a guide to read through and extract sample tweets that capture or direct to the descriptors and semantic orientations and emotions expressed within each group.
Table 1 provides further insight into the semantic orientation and emotions across the five groups as well as the most occurring word pairs within the tweets for each of the five groups. First, even though we earlier considered Groups 1 and 2 as polarized crowds, further analysis in Table 1, presents more of a nuanced picture. Tweets from users in both groups had mostly positive sematic orientations, primarily in relation to President Trump, suggesting favorable support for the US government’s border fortification response to the migrant caravans. The tweets expressed emotions such as trust, fear, anger, joy, and anticipation, and some of the most occurring word pairs in the tweets included “Trump + Admin,” “Trump + GOP,” “Trump + White,” “Respect + Rule,” and “Protect + Americafirst”. Overall, the data reveals that users in Groups 1 and 2 were comprised of right-wing conservative Twitter users who condemned the migrant caravans. Many users called for border fortification with tweets like the following (Disclaimer: We avoid adding the twitter account handles to the extracted tweets throughout this article due to the current political climate in the US and the politically sensitive nature of immigration issues in the country, including the possibility of legal/political retribution such as deportation):
Semantic orientations, emotions, and most occurring word pairs in the sampled tweets.

“This #migrantcaravan is attempting to break into the US; zero respect for our rule of law”
“That #MigrantCaravan is full of violent people. Mexican police are a joke to them.”
“I'm a product of immigration. Storming an International border with thousands beside you IS NOT SAFE, NOT LEGAL, AND NO”
Although Group 2 predominantly involved users whose tweets had positive semantic orientations, we also observe some tweets that had negative semantic orientations and were associated with negative emotions such as fear and anger. In other words, the oppositional semantic orientations and emotions within the tweets of users in Group 2 start to unveil the contested topographies of twitter discourses around the migrant caravans. Similar to tweets in Group 2, we also observe both positive and negative semantic orientations in the tweets within Group 3, but most of the tweets were predominantly negative towards the events surrounding the migrant caravan. For instance, a twitter user in Group 3 with the name “DeplorableChoir,” tweeted, “I have GREAT news for anyone who is sick of people illegally crossing our border!.” This tweet was countered by another user who averred, “No one is illegal on stolen land,” which was an invocation of the settler colonial discourse to (1) remind DeplorableChoir and others about the genocide, ecocide, and colonization of Native Americans and their land (Gordon, 2019; Valles, 2020), and (2) contest the erasure from history and present-day discourse of the violence of settler colonialism and indigenous dispossession (cf. Rivera, 2019; Wolfe, 2006). These negative semantic orientations within the tweets in Group 3 were associated with fear emotions, and involved some of the following frequently occurring word pairs: “Respect + Right,” “Faith + Leaders,” “Fatal + Children,” and “Shocking + Images.” For context, some of these tweets included: “Tear gas is a chemical weapon. Exposure can cause long term medical issues and can be fatal for children” “Despite flooding, hundreds of people of faith have gathered for the #LoveKnowsNoBorders action in San Diego” “Thank you, Evangelicals and the “moral majority,” for showing us what you mean by “pro-life.” “This is a demand to respect human rights and to affirm human dignity.” “There will be consequences behind this. The USA has never had to deal with #HumanRights concerns until this #nutjob” “Tear gas is a chemical weapon outlawed in war by a number of international treaties, yet our government is currently firing” “#TittyBoyTrump is dismantling America right in front of us. The #GOP is letting him get by with” “People of many faiths are on their knees at the border, singing and demanding that the US government respect the right to migrants” “Every soldier who participated in this assault on innocent refugees should be ashamed.”

Geo-located (re)tweets about the #migrantcaravan (hexagonal cells, 130-km wide cells).

Geo-located (re)tweets about the #migrantcaravan in the US (hexagonal cells, 65-km wide cells).
In the following visualizations, we drill down in order to ascertain the spatial patterns of these tweets. We focused first on sample tweets from some of the states with the highest number of tweets along the US–Mexico border, the Northeastern part of the US, and Florida. For each of these states, we selected cities with the highest frequency of tweets and identified specific tweets that were frequently retweeted. A sample of these randomly selected highly retweeted tweets are presented in Figure 7. We used the same approach to select a sample of highly retweeted tweets from some “interior states” or states with a high frequency of tweets farther away geographically from the political border with Mexico. Figure 8 presents a sample of the most retweeted tweets from these interior states.

Sample of frequently retweeted tweets in cities within border-gateway states.

Sample of frequently retweeted tweets in cities within interior states.
In Figure 7, the sampled tweets about the #migrantcaravan were mostly in support of the migrant caravan at the US–Mexico border and condemned the actions of the US government against the migrants at the border. In other words, in cities (with the most tweets) located in these border states, some of the highly retweeted tweets seemed to show more support for the migrants and less support for the US government’s actions towards the migrants at the border. However, in the case of Miami, Florida, the sampled highly retweeted tweets seemed more in favor of the US government’s action towards the migrants at the border. The sample of these highly retweeted tweets in Miami also brings two issues into sharp focus. First, one tweet noted, “It is time for this administration to call for an emergency summit meeting with #Honduras, #ElSalvador and #Guatemala.” Without providing context to this tweet, one wonders if such a summit is meant to address the underlying causes of migration (for example, poverty, violence and climate change) or, if the intention is to create a militarized fortress. Second, another tweet states, “It is time for #Hispanics to wake up and understand that we need to put order at the #border.” It is unclear whether this tweet was tweeted (and highly retweeted) among the so-called “Hispanics” as a rallying call to self-organize to “put order at the #border”. 12 A border studies and migration scholar can cautiously surmise significant subtleties from the (re)tweet. The word Hispanic is fraught with political meaning. The term is intimately tied to the US government through its association with the Census and one which lumps together many countries of origin (Rodriguez, 2000). A host of signifiers including, but not limited to, Latinx, Latina, Latino, Chicana, or the specific country of origin associated with the Latin American diaspora, are often preferable to “Hispanic” by many who self-identify as part of these categories. Furthermore, “identity” is neither monolithic nor homogenous and we would do well to avoid reification. Nearly a fifth of Cuban American Republicans voted for Donald Trump in 2016, and Miami Cubans have a long history of conservatism which can translate into anti-immigrant sentiment. 13 These brief interrogations of tweets highlight the need to pair Big Data analytics with knowledge of borders and migration in order to properly contextualize complexities.
In Figure 8, except Omaha in Nebraska, the sample tweets show that tweets about the #migrantcaravan were also mostly in support of the migrant caravan at the US–Mexico border. An interesting comparison can be made between Denver (Colorado) and Omaha (Nebraska). Both states have highly productive agricultural economies, and are ranked within the top 10 states in terms of agricultural sales in cattle, grains, poultry, vegetables, and fruits (USDA, 2017). However, one can cautiously surmise that the differences in the sample tweets between Omaha (less favorable to the migrant caravan) and Denver (more favorable to the migrant caravan) may be attributed to the high percentage of Hispanics/Latino in Denver (30% of the population) compared to Omaha (13% of the population) according to the 2010 US Census; these statistics could serve as proxies to gauge the tolerance of residents in both cities to immigrants and their contribution to their respective economies. Perhaps, another reason for such differences in sample tweets lies in the fact that Nebraska is more conservative leaning (voted for Republicans since the 1960s in the presidential elections) but Colorado is relatively more liberal leaning, at least since 2008 where Democrats have won the presidential elections in this state.
The overall spatial patterns in the sampled tweets evoke a larger question of peoples’ potentially differential relationship towards the plight of (un)documented immigrants based on their proximity to the international boundary. The notion that proximity and empathy are inextricably linked is alluring on the surface but problematic when thought of in strictly territorial terms. At first glance, it may appear that those closer to the border are more open to less militarization or more willing to consider the migration caravan as a human rights issue. However, this “hypothesis” does not hold. The strong rhetoric opposing and supporting the #migrantcaravan cannot be extrapolated in order to eliminate ambiguity, nor can it be reduced to a singular essence. Instead, through these tweets, we catch a kaleidoscopic aperture reflecting loose fragments (the border is stretching; the migrant caravan is not tweeting about the #migrantcaravan; the importance of media outlet credibility) that fail to cohere around an authoritative spatial perspective.
Conclusion
The three-pronged analysis of migrant caravan-related tweeting presented here reveals few definitive findings into a complex high-profile geopolitical event. Our multi-method approach does, however, bring into focus some larger questions worthy of long-term contemplation. The conversational archetypes provide a visualization of Twitter as a spatial technology. The four structures which we describe map the alignments, connections, proximities, and distances around the many-headed subject that we term the #migrantcaravan. Through our conceptual frame, and in spite of the fact that a small number of people tend to be overly represented, the groups allow us to make “sense” of the unity of utterances by focusing on the horizontal encounters wherein meaning is materialized. In effect, we have a clearer sense of the spatialities of encounter and their attendant reverberative resonance.
The semantic analysis documents the pairing of strong emotions with right wing discourses supporting Trump’s actions and opposing the migrant caravan. At the same time, the analysis reveals equally strong support for upholding human rights, condemning the actions of the police, and supporting the migrant caravan. More specifically, the semantic analysis employed in this article unveils and (re)produces the inherent reductionism in the geographies of Big Data analysis, where the data (e.g., tweets and retweets) and analysis thereof (e.g., semantic analysis) tend to collapse complexities and nuances expressed in the data into “clean” charts, graphs, and other forms of quantification devoid of the muddiness through which the data inheres meaning. In other words, the Big Data apparatus (in this case, Twitter) and its automated analytical methods (e.g., machine learning algorithms like sentiment analysis) becomes a technology that (re)produces particular, often reductive, interpretations, and ways of seeing. Recent studies in stance detection (Joseph et al., 2017; Mohammad et al., 2017) offer avenues for future work to engage deeply with some of the nuances, sarcasm, subtleties, and complexities embodied in tweets. For now, the takeaway is that Twitter may be non-authoritative but still possesses a force that contains within it the power of actionability. To elaborate, the same platform deploys different conversations with no uber meaning; i.e., different sorts of fictions emerge, some more compelling than others. The point of interest exceedingly becomes a question of directionality: what path will these encounters take? Although that answer is beyond the scope of this article, we are ultimately interested in accruing more data as it relates to mobilities and prosumption (Cockayne, 2016).
The maps in our analysis examine the spatial concentration of Twitter activity and provide an incomplete but important window into understanding border phenomenon through the lens of social media. The juxtaposition of border and non-border geosocial data problematizes the proximity hypothesis or the notion that there is a correlation between the content of the tweet and the distance to an event. The discourses (tweets) espousing the need to protect our borders and secure the identity and values of Americans, or, conversely, the outrage expressed at teargassing children, and migrant detention centers are more holistically assessed when contextualized in relation to border studies.
We conclude with a reminder of our two corollary points. The first is that Twitter is a spatial technology, and as such functions in agentic ways. Geographers have noted that Big Data is not only evidence of existing phenomena, but is itself phenomena (Wilson, 2015). Secondly, we have argued for the value of a deeper thematic knowledge to be paired with Big Data methods. It is through this linkage that we can see how social media circumscribes how we know as well as what we know. Distilling the geography of the #migrantcaravan is part of a larger quest to think through what kinds of claims Twitter (and other social media) can make on us as users and citizens.