
Abstract
Introduction
Given its global scale, the coronavirus pandemic (COVID-19) has not only affected the lives of billions of people around the globe but it has also sparked a world-wide discourse around COVID-19 on social media. As Athique (2020: 3) has recently noted, ‘there has never been a time in which media systems have been able to convey such detailed and universal coverage of an historical event in real time, with the added capacity to keep us all in touch and to give us a voice too’. Due to the large volume, velocity, and variety of data about the pandemic available through Twitter, it has been treated as a useful source of big data (Brooker et al., 2016; Felt, 2016; Kitchin, 2014; Kitchin & McArdle, 2016). Researchers have utilized data sourced from Twitter to examine various aspects of the ongoing pandemic (Bowe et al., 2020; Gruzd and Mai, 2020), including a growing body of work that examines public discourse about COVID-19 (e.g., Damiano and Catellier, 2020; Das and Dutta, 2020; Jimenez-Sotomayor and Gomez-Moreno, 2020; Kurten and Beullens, 2020; Lwin et al, 2020; Wicke and Bolognesi, 2020; Xue et al., 2020). It is clear from these studies that public discourse about the pandemic appearing on Twitter and other social media platforms consists of an interconnected set of more or less cohesive topics that are directly or indirectly linked to COVID-19.
Yet while data-driven text-mining approaches to social media discourse add valuable tools to discern COVID-19-related from non-COVID-19-related tweets (Classification), to annotate and analyse sentiments (Sentiment Analysis), and to identify specific topics (or sub-discourses) (Topic Modelling), they have so far not also taken into account the fact that COVID-19 discourse invariably consists of various thematically coherent sub-discourses (see, e.g., Lwin et al., 2020; Xue et al., 2020), and that it develops and substantially changes in real-time (i.e., without periodizing the data; see, e.g., Abd-Alrazaq et al., 2020; Han et al., 2020; Saleh et al., 2020; Yang et al, 2020; Yin et al., 2020 ). Indeed, the majority of studies that focus on discourse around COVID-19 have treated it as an undifferentiated whole, without combining temporal and discourse information (Das and Dutta, 2020; Wicke and Bolognesi, 2020). On the other end of the spectrum, discourse-analytic analyses that rely on traditional (corpus) linguistics methods succeed in providing fine-grained, qualitative insights, but fail to provide scalable or reliable (intersubjective) results (e.g., Damiano and Catellier 2020; Jimenez-Sotomayor and Gomez-Moreno, 2020).
The present study aims to combine both approaches to gain a better and more detailed understanding of how the COVID-19 discourse unfolded in the Australian Twittersphere over a period of four months in the opening phases of the pandemic. The underlying assumption is that analyses which draw on both approaches to arrive at linguistically informed text-mining applications have the potential to enhance our understanding of the public’s response to social events in a way that would not be possible by relying only on one of these methodological traditions.
Our study is premised on the assumption that analysing public discourse around COVID-19 on Twitter poses both ontological and analytical challenges. One key ontological challenge that arises when using Twitter as a source of big data is that the use of Twitter hashtags to define one’s dataset arguably confounds structured behavioural data (i.e., tagging) with unstructured user-generated data (i.e., content of tweets) (Alaimo and Kallinikos, 2016). Rather than analysing the unstructured content generated by users posting about a particular topic (or set of topics), researchers are analysing samples that are extracted through algorithms (Gillispie, 2014; Kitchin, 2014) that aim to make social actions and networks of a certain type visible (McCosker and Gerrard, 2020). In other words, they analyse the data footprint of structured behavioural data produced through algorithmically driven social interaction on social media platforms (Alaimo and Kallinikos, 2017; Couldry and Kallinikos, 2018; Shaw, 2015). Analytical challenges that result from acknowledging the complexity of public discourse on social media platforms include, for instance, the identification of COVID-19-related tweets, the detection of thematically coherent topics, and the demarcation of distinct phases within the discourse surrounding COVID-19.
The present study aims to demonstrate how one might go about addressing both of these sets of challenges. On the one hand, it aims to examine public discourse on the pandemic (i.e., unstructured user-generated data) by analysing a sample of tweets taken from a particular domain, the Australian Twittersphere (Bruns et al., 2017), and employing a classifier that uses pre-pandemic tweets as a control to delimit what counts as COVID-19 discourse, rather than leaving it to the user to define the dataset through inconsistent application of hashtags and extraction of these through an opaque algorithm (i.e., the Twitter hashtag API). On the other hand, it exemplifies how combining data-driven text-mining methods with linguistically informed corpus linguistics techniques can lead to the identification of different phases and thematically coherent topics in the COVID-19 discourse in the Australian Twittersphere. This periodization and layering of the existing discourse enables us to take the temporal dimension into account, and thereby investigate the unfolding and evolution of COVID-19 discourse.
Following from this, the present study addresses the following main research questions:
RQ1: Which developmental phases did discourse on COVID-19 go through in the Australian Twittersphere? RQ2: Which sub-discourses (i.e., topics) underpin COVID-19 discourse in the Australian Twittersphere? RQ3: What keywords differentiate and characterize the distinct phases and sub-discourses of COVID-19 discourse in the Australian Twittersphere? RQ4: What shifts in stance (i.e., sentiment) can be observed within the distinct phases and sub-discourses of COVID-19 discourse in the Australian Twittersphere?
In addressing these research questions, the present study aims to provide a more detailed understanding of how COVID-19 discourse has evolved in the Australian Twittersphere, as well as to provide a methodological prototype which shows how these issues can be resolved by drawing on both data-driven text-mining and linguistically informed corpus linguistic methods.
Social media discourse on COVID-19
Although the body of research that investigates social media discourse around COVID-19 using text analytic or text-mining approaches is rapidly growing, it is still comparatively scarce compared to analyses of other social media discourses due to the recency of the pandemic. Research to date on COVID-19 discourse can be grouped into three main categories:
1
Research that uses moderately sized datasets and employs a fine-grained discourse analytic approach (e.g., Damiano and Catellier, 2020; Jimenez-Sotomayor and Gomez-Moreno, 2020). While research of this type provides valuable information about localized discourse, it does not allow us to draw inferences about COVID-19 discourse more broadly. Research that applies a data-driven text-mining approach with the aim of analysing ‘fake news’ about COVID-19 (referred to as myths and rumours by Yang et al., 2020), detecting mental health issues related to COVID-19-induced lockdown measures (Yin et al., 2020), or using changes in linguistic behaviour as an early-warning system to indicate potential threats of an imminent pathogenic outbreak (e.g., Jahanbin and Rahmanian, 2020). As this type of research is not concerned with the analysis of COVID-19 discourse per se, it is less relevant in the context of the present study. Research that implements text-mining methods in datasets of a substantial size, but does not combine temporal and discourse information. While these studies unearth interesting and relevant patterns in COVID-19 discourse, they do not systematically examine how that discourse may develop and change in real-time (i.e., without periodizing the data; see, e.g., Abd-Alrazaq et al., 2020; Han et al., 2020; Saleh et al., 2020, Yang et al., 2020, or Yin et al., 2020), do not distinguish between thematically coherent topics that constitute COVID-19 discourse on social media (Lwin et al., 2020; Xue et al., 2020), or do not combine temporal and discourse information (Das and Dutta, 2020; Wicke and Bolognesi, 2020).
We now briefly summarize the main findings of previous research that are relevant to the research questions addressed in the present study. In a functional, discourse analytic study that aimed to investigate how older adults are represented in COVID-19 discourse, Jimenez-Sotomayor and Gomez-Moreno (2020) found that the majority of tweets in their sample (n = 351) contained personal opinions, personal accounts, and jokes. In addition, 72 tweets (21.9%) contained offensive content, and 74 (21.1%) had ageist content that implied that the life of older adults was less valuable. Damiano and Catellier’s (2020) discourse analytic study, in contrast, focused on the attribution of blame in a sample of tweets (n = 600) taken at two points in time in the opening phases of the pandemic.
Lwin et al. (2020) and Xue et al. (2020) were among the first more fine-grained time-sensitive text analytic studies of COVID-19 discourse on social media. They showed that COVID-19 discourse was not only ‘swiftly evolving’ (Lwin et al., 2020: 3), but also that negative emotions such as anger and sadness increased over real-time (Xue et al. 2020). However, while both Lwin et al. (2020) and Xue et al. (2020) relied on a substantial database and monitored the development of the COVID-19 discourse over real-time, they identified COVID-19 discourse through pandemic-related hashtags, and treated this discourse as an undifferentiated whole.
In contrast, Das and Dutta (2020) also acknowledge the temporal dimension of social media COVID-19 discourse in their analyses of changing sentiments within this discourse, as well as perform additional topic modelling that identified 14 thematically coherent sub-discourses. Unfortunately, Das and Dutta (2020) did not apply their time-sensitive analysis of changes in sentiments to the topics that they have identified, and analysed the latter topics in an undifferentiated non-time sensitive discourse.
Han et al. (2020) used geospatial information with topic modelling of Chinese social media data (Weibo) to show that Chinese discourse around COVID-19 consisted of 7 main topics and 13 subtopics, and that the proportions of these different topics varied substantively over time and across different geographic regions. They argue that understanding how different topics gain prominence in social media can help ‘to accelerate emergency responses, and to support post-disaster management’ (Han et al. 2020, 2788).
A similar approach is employed in Wicke and Bolognesi’s (2020) study in which discourse analytic techniques are combined with topic modelling of a corpus of tweets extracted through virus-related hashtags. The 4 and 16-topic models they developed are also examined with respect to different figurative and literal framings of the tweets. They argue that the (figurative) WAR frame and (literal) FAMILY frame cover a significant proportion of the topics identified through topic modelling (Wicke and Bolognesi, 2020).
Finally, in a study of public discourse about the pandemic in the Belgium Twittersphere, Kurten and Beullens (2020) conduct a time-series analysis of tweets containing a selection of pandemic-related hashtags collected through Twitter’s ‘statuses/filter’ streaming API endpoint. They used this collection to generate both topic models and to analyse changes in sentiment over time. The former demonstrates that ‘significant events related to the virus resulted in an immediate increase in the number of tweets addressing them’ (Kurten and Beullens, 2020: 5), while the latter indicates that public discourse was characterized by an emphasis on positive sentiment, such as trust and European solidarity, in the opening phases of the pandemic. However, they also acknowledge that since ‘Twitter does not disclose their sampling procedure’, it remains ‘unknown’ whether the sample of tweets extracted through the streaming Twitter API is representative (Kurten and Beullens, 2020: 5). We would add that it is also important to acknowledge that relying on a selection of hashtags will not capture all COVID-19-related tweets.
Overall, while the research summarized above provides valuable insights into public responses to the COVID-19 pandemic, our contention is that none of the research studies to date have provided scalable results based on big data that also sufficiently differentiate between phases and distinct sub-discourses in different societal domains. This is important as while the pandemic is clearly a global event, the way in which these topics evolve over time is evidently linked to the progress of the pandemic in different countries around the world (Athique, 2020). The present research aims to address this research gap and to add to existing research by analysing COVID-19 discourse in the Australian Twittersphere within and between phases as well as across thematically coherent topics. Our aim is to show that differentiating between different phases and topics allows for the detection of patterns and trends that approaches which treat the COVID-19 discourse as an undifferentiated whole are unable to uncover. As such, we argue that data-driven text-mining approaches can profit from linguistically informed methods and strategies.
Data and methodology
The Twitter data for this study was derived from the Australian Twittersphere (also known as the Australian Twitter Collection) operated by the Digital Observatory at Queensland University of Technology. The Australian Twittersphere is a longitudinal collection of public tweets from a population of 531,298 active accounts identified as Australian as of early 2016 (Bruns et al., 2017; cf. Kinder-Kurlanda et al., 2017). Publicly posted tweets are collected in a continuous loop using the Twitter ‘statuses/user_timeline’ API to retrieve recent tweets for each account, thereby avoiding the sampling issues of other endpoints (Hino and Fahey, 2019). 2 Because of the large number of accounts under consideration, this approach leads to tweet volumes of 600,000–800,000 tweets per day. For the purposes of this study, a 2% subsample (each tweet was retained with a 1% chance) of all tweets collected from the accounts included in the Australian Twittersphere between 1 January and 20 April 2019 and 1 January and 20 April 2020 was constructed. We took the decision to limit the present study to a 1% random sample of the entire data, which given the size of the entire dataset is still arguably representative of users in the Australian Twittersphere, because we wanted the analysis to be reproducible by other researchers without the need for high performance computing. A separate dataset of tweets published in 2019 formed part of the training set which was used to identify tweets that were COVID-19-related.
During data cleaning, all tweets were converted to lowercase and stop words (non-lexical words such as function words, pronouns, contractions, or negators), URLs (http://webpage.com), name handles (e.g., @ronautic), the hashtag sign (e.g., #covid: covid), and tweets containing non-ASCII characters (e.g., ö, ä, ü or emoticons), as well as tweets containing non-English words, were removed from the analysis. Table 1 provides an overview of the size of the data before and after data cleaning as well as the number of tweets and words of COVID-19-related discourse.
Overview of tweets and number of elements in the data.

Of all tweets published in from 1 January to 20 April 2020, 5.2% were COVID-19-related. However, it should be borne in mind that most COVID-19-related tweets only started to emerge in early to mid-March 2020.
Identifying these COVID-19-related tweets posed a serious methodological challenge, as not all COVID-19-related tweets contain explicit references to the coronavirus. For instance, someone might publish a tweet in which they state that they will stay at home to socially distance or that they have just lost their job and are now on Jobseeker (an Australian Government welfare program established with the aim of assisting people who lost their job as a consequence of COVID-19). While these tweets do not contain any explicit reference to COVID-19, they are clearly COVID-19-related. To identify tweets that are COVID-19-related, yet make no direct mention of it, we trained a Support-Vector-Machine-based classifier (vector size of 16,087 elements) with linear kernel implemented in the RTextTools package (see Jurka et al. (2020) for additional information and model specifications) on 750 COVID-19-related tweets (identified by containing the phrases ‘covid’, ‘coronavirus’, ‘pandemic’, ‘quarantine’, ‘lockdown’, ‘outbreak’, ‘herd immunity’, ‘flatten the curve’), and 4250 non-COVID-19-related tweets. 3 This classifier performed extremely well on a test set of 1250 unseen, manually classified tweets, and classified these tweets with 100% accuracy.
After disregarding tweets posted in 2019, we implemented a series of Fisher’s exact tests with Benjamini-Hochberg correction for multiple testing to all words and bigrams that occurred more than 10 times in the remaining dataset. The aim of this procedure was to identify words that were used significantly more frequently in the data classified as COVID-19-related than in the non-COVID-19-related discourse. These words can be regarded as COVID-19-related keywords, which are indicative or characteristic of COVID-19 discourse.
Once COVID-19 keywords were identified, non-COVID-19-related tweets were disregarded and all COVID-19-related tweets were collapsed by date to create a separate COVID-19 corpora for each day in the remaining dataset. These corpora were used to create a document-term-matrix (DTM) that contained the frequencies of all keywords per day. This DTM was then used to identify phases (groups or clusters of days) in the data using agglomerative hierarchical clustering. To determine the optimal number of clusters (phases), we calculated Calinski-Harabasz indices for 2 through 20 clusters. The Calinski-Harabasz indices suggested that the optimal solution is seven clusters (phases) in the COVID-19 data.
Parallel to the identification of phases, latent Dirichlet allocation-based (LDA-based) topic modelling (Blei et al., 2003) was applied to the data to determine the topics that constitute COVID-19 discourse. The optimal number of topics was determined using topic coherence scores (minimizing: Deveaud et al., 2014, maximizing: Cao et al., 2009). 4 Based on the results of the topic modelling, each tweet was then assigned a dominant topic. Changes in the percentages of tweets associated with these topics then allowed us to analyse how the prominence of topics changed over time and between different periods.
In addition, sentiment analysis was applied to the tweets to determine shifts in stance or, more precisely, sentiment (Jockers, 2017). The sentiment analysis used in the current study is based on the Word-Emotion Association Lexicon (Mohammad and Turney, 2013; cf. http://www.purl.org/net/NRCemotionlexicon), which comprises 10,170 terms for which lexical elements are assigned scores based on ratings gathered through the crowd-sourced Amazon Mechanical Turk service. Raters were asked whether, according to their judgement, a given word was associated with one of eight basic emotions (ANGER, ANTICIPATION, DISGUST, FEAR, JOY, SADNESS, SURPRISE, and TRUST; see Plutchik, 1980, 1994). The resulting associations between terms and emotions are based on 38,726 ratings from 2216 raters who answered a sequence of questions for each word, which were then fed into the emotion association rating (cf. Mohammad and Turney, 2013). Each term was rated five times. For 85% of words, at least four raters provided identical ratings. For instance, the words
Finally, Fisher’s exact tests with Benjamini-Hochberg correction for multiple testing were used to find words that are significantly associated with, or significantly underused, in each phase compared to the overall use of that word. This allowed us to find words that are particularly prototypical for each phase as well as which words were underrepresented in the COVID-19 discourse of a given period. This method for identifying keywords represents an adaptation of a collostructional method, a covarying collexeme analysis, which is a corpus linguistic method that was developed for identifying words that are significantly attracted or repelled by certain linguistic environments (i.e., constructions) (see Gries & Stefanowitsch, 2004; Stefanowitsch & Gries, 2003, 2005).
By enriching the data, adding (1) the scores for the core emotions and polarity, (2) the period during which a tweet was published, and (3) the dominant topic of each tweet, we were able to examine how COVID-19 discourse unfolded in the Australian Twittersphere, including changes in topics, emotions, and polarity across distinct periods over those four months. In the following section, we summarize the main results of this analysis.
Results
The SVM classifier found 41,342 COVID-19-related tweets. Figure 1 shows the percentage of COVID-19-related tweets of all tweets published in the 2020 dataset from the Australian Twittersphere (1 January–20 April).

Percentage of COVID-19-related tweets in the 2020 subsample (solid black line: percentage values; dotted dark grey line: loess smoothed frequencies; light grey band: smoothed 95% confidence intervals).
Figure 1 shows that a first peak appeared at the end of January when news about the COVID-19 outbreak in China broke into the public consciousness. After this initial peak, attention decreased again until the first cases appeared in Australia, at which point COVID-19 discourse experienced a surge which reached an all-time high in mid-March. After this all-time-high, the discourse ebbed off but nevertheless remained a prominent topic in the Australian Twittersphere until mid-April.
Fisher’s exact tests with Benjamini-Hochberg correction for multiple testing identified 49 keywords that are significantly associated with COVID-19 in the Australian Twitter data. The colouring in Figure 2 represents the scaled frequencies of these keywords per day to show the relative use of keywords over time.

Scaled frequencies of keywords by day.
The darker shades to the right in Figure 2 confirm that the majority of keywords were used after mid-March, while the dark areas in the centre left (at the end of January) reflect when the wider public became increasingly aware of the initial outbreak in Wuhan, China. The distribution of the percentages of tweets containing selected keywords across real-time are provided in Figure 3.

Percentages of tweets containing selected keywords per day.
Figure 3 provides some interesting insights: the top left panel shows a peak from mid to the end of January when the outbreak of COVID-19 in China became public. The top centre and top right panels show that while the term
The periodization of the data was based on the scaled frequencies of keywords per day. The Calinski-Harabasz indices suggested that seven clusters (phases) were optimal, and the data-based classification did not require further manual adjustments. The resulting periodization is displayed in Figure 4.

Periodization based on keyword-based agglomerative hierarchical clustering.
The keyword-based clustering revealed seven main phases in the discourse around COVID-19 in the Australian Twittersphere: Phase 1 (January 1 to February 25); Phase 2 (February 26 to March 7); Phase 3 (March 8 to 11); Phase 4 (March 12 to 18); Phase 5 (March 19 to 27); Phase 6 (March 28 to April 1); and Phase 7 (April 2 to 20). Figure 5 confirms that these periods align well with the developmental stages of the growing threat of COVID-19 in Australia.

Percentage of COVID-19-related tweets by day with demarcation lines for distinct phases.
Phase 1 (January 1 to February 25) is characterized by a relatively small number of COVID-19-related tweets, while Phase 2 (February 26 to March 7) is associated with a notable increase in COVID-19 tweets, followed by a dramatic increase in COVID-19-related tweets in Phase 3 (March 8 to 11). Phase 4 (March 12 to 18) represents the peak of COVID-19 tweets in the Twitter data with a lower, but stable, percentage of COVID-19 tweets in Phase 5 (March 19 to 27). Phase 6 (March 28 to April 1) shows a substantial decline in the percentage of COVID-19 tweets, and Phase 7 (April 2 to 20) is characterized by a steady, yet slower decline of COVID-19-related tweets compared to phase 5.
We now turn to consider terms that were significantly over- and under-used during each phase of COVID-19 discourse (see Figure 6).

Terms significantly over-used (positive values) and under-used (negative values) within each phase.
During phase 1, the term
In the course of LDA-based topic modelling, the topic coherence scores (minimizing: see Deveaud et al., 2014; maximizing: see Cao et al., 2009) suggested the existence of five thematically coherent topics in the overall, non-periodized COVID-19 discourse (see Table 2).
Ten most strongly associated keywords for each topic
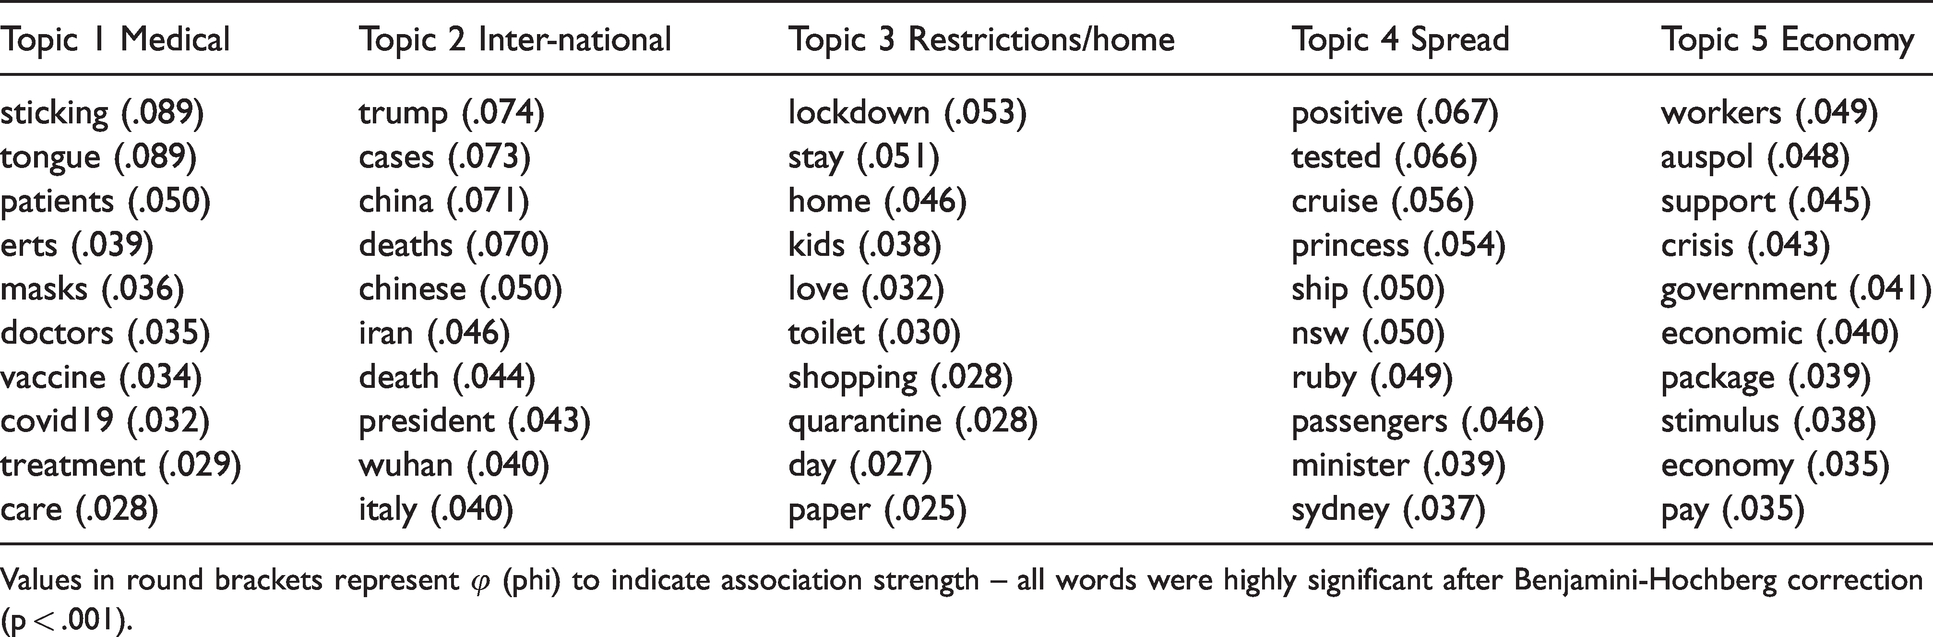
Values in round brackets represent φ (phi) to indicate association strength – all words were highly significant after Benjamini-Hochberg correction (p < .001).
Table 2 shows that the topics identified through LDA-based topic modelling are aligned with five thematically coherent topics: Topic 1 encompasses medical issues; Topic 2 is characterized by international affairs-related discourse; Topic 3 contains tweets dealing with issues related to the restrictions and the repercussions of the lockdown (and how they affect family life); Topic 4 revolves around themes that focus on how and where COVID-19 spread; and Topic 5 deals with the economic consequences of COVID-19.
We now inspect how the proportions of these topics changed across periods to get an understanding of how the COVID-19 discourse shifted and evolved over time. To this end, Figures 7 and 8 display the percentages of these topics by period.

Bar graph showing the percentages of topics among COVID-19 tweets by phase.

Line graph showing the percentages of topics among COVID-19 tweets by phase.
With respect to overall trends, Figures 7 and 8 show a steady increase in discourse around restrictions, which only drops in prominence during Phase 7. A similar trajectory can be observed for economy-related discourse, with the exception that there was no drop in prominence during the last phase (Phase 7). Discourse on international issues dominated the first period, but experienced a substantial drop in prominence in phase 2 onwards, although there was a notable up-tick during phase 7.
The mosaic plot in Figure 9 contains statistical information which shows that Phase 1 was dominated by tweets associated with the INTERNATIONAL topic and, though less prominently, the topic related to the SPREAD of COVID-19. In particular, discourse during this first phase focuses on the Coronavirus situation in China and the number of cases, as well as deaths attributed to COVID-19 in the Wuhan region. Phase 2 saw a notable increase in discourse around MEDICAL issues and, to a lesser degree, ECONOMY-related issues, while the INTERNATIONAL aspect of the discourse decreased, although still remained relatively prominent. Phase 3 was not significantly associated with any particular topic (see Figure 9). During Phase 4, tweets focusing on the SPREAD of the coronavirus increased, especially, and in contrast to Phase 1, in the Australian context. Phase 5 was dominated by discourse around topics 3 (RESTRICTIONS|HOME) and 5 (ECONOMY), while Topic 2 was notably rare during this phase. Phase 6 was similar to phase 5, but issues around the SPREAD of COVID-19 were once again gaining in prominence. Finally, phase 7 was characterized by a renewed interest in the SPREAD of COVID-19, while discourse around ECONOMIC issues remained prominent.

Mosaic plot showing the association of topics with periods in the COVID-19 discourse (blue indicates significant over-representation, red indicates significant under-representation, and white indicates no deviation from expected representation).
We now focus on shifts in polarity across periods. Figure 10 shows that Topic2_INTERNATIONAL was consistently the most negative with respect to polarity. In contrast, Topic3_RESTRICTIONS|HOME, while initially very negative became substantially more positive over time. A similar trend is observable for Topic5_ECONOMY. Topic4_SPREAD also became more positive over time, but experienced a notable shift towards negative sentiment during phase 6.

Changes in polarity in the COVID-19 discourse by topic and period.
The analysis of language linked to specific core emotions also shows interesting trends. Figure 11 shows that the use of emotives (words associated with selected core emotions) differed substantially across different topics and periods. Topic3_RESTRICTIONS|HOME was mostly associated with JOY-emotives, while Topic 5 (economy) was associated with ANTICIPATION- and TRUST-emotives. In addition, Topic3_RESTRICTIONS|HOME and Topic5_ECONOMY were associated with positive emotions through over-proportionate use of positive emotives (e.g.,

Changes in emotive use in the COVID-19 discourse by topic and period across emotions (positive emotions [anticipation, joy, trust) = light grey, negative emotions [anger, fear, sadness) = dark grey).
Discussion
Drawing from a combination of data-driven text-mining methods and corpus linguistics techniques, this study analysed public discourse about the pandemic (COVID-19) in the Australian Twittersphere over a period of nearly four months with the aim of ascertaining how COVID-19-related discourse evolved over time, what topics underpin public discourse on COVID-19, and how the prominence of particular topics and sentiments changed over time in the opening phases of the pandemic. The analysis uses a 1% subsample of all tweets from the Australian Twittersphere that were published between 1 January and 20 April 20 2019 (control dataset) and 1 January and 20 April 2020 (sample dataset), amounting to 1.7 million tweets and 38 million words. A Support Vector Machine-based classifier identified 41,342 COVID-19-related tweets, which allowed us to extract COVID-19-related keywords using collostructional analyses. The normalized frequencies of COVID-19 keyword then formed the basis of agglomerative hierarchical clustering through which we identified seven distinct phases in the development of the discourse around COVID-19, and additional Latent Dirichlet Allocation-based topic modelling which identified five thematically coherent sub-discourses (topics) that form this discourse. Based on the proportion of topics within each period, we were able to show which topics were particularly prominent within each of the different phases, and further collostructional analyses identified keywords that are significantly over- and under-used within each phase of COVID-19 discourse during this time. Finally, a sentiment analysis enabled us to investigate changes in polarity and emotional language within and across topics and periods.
The analysis of keyword-based clustering revealed seven main periods in the discourse around the COVID-19 in the Australian Twittersphere: Phase 1 (1 January to 25 February); Phase 2 (26 February to 7 March); Phase 3 (8-11 March); Phase 4 (12-18 March); Phase 5 (19-27 March); Phase 6 (28 March to 1 April); and Phase 7 (2-20 April) (see Figures 4 and 5). The initial phase (Phase 1) was characterized by a notably low relative frequency of COVID-19-related tweets. Those tweets that were COVID-19-related predominantly focused on the Coronavirus situation in China, and the number of cases as well as deaths attributed to COVID-19 in the Wuhan region. The second phase was dominated by issues regarding social distancing and hygiene. The third phase showed a dramatic increase in COVID-19-related tweets that revolved around travel restrictions and positively tested or hospitalized patients in Australia, as well as measures to stop the spread in Australia. Phase 3 represents the phase with the highest number of COVID-19-related tweets, which overwhelmingly revolved around social distancing and hygiene measures, while references to travel restrictions and border closures dropped in prominence. During phase 4, the percentage of COVID-19-related tweets dropped off, and online information and online learning come into focus. Finally, the declining percentage of COVID19-related tweets posted in phase 6 was accompanied by a shift in focus to international politics, particularly the US response to COVID, and economic aspects of the pandemic, while the number of deaths and confirmed cases also regained prominence.
Topic modelling identified five thematically coherent topics in the COVID-19 discourse (see Table 2). The first topic or sub-discourse (Topic 1) revolved around medical issues, while the second topic (Topic 2) was characterized by international affairs-related discourse. The third topic (Topic 3) represented discourse dealing with issues related to the restrictions and the repercussions of the lockdown (and how they affect the home as well as family life). Topic 4 dealt with issues and themes that focused on how and where COVID-19 spread, while the fifth topic (Topic 5) consisted of discourse that dealt with the economic consequences of COVID-19.
Differentiating between topics and sub-discourses also allowed us to analyse polarity changes and trends in the emotionality of the respective sub-discourses over time. Regarding changes in polarity, the analysis found that Topic 1, which revolved around medical issues, was associated with positive polarity with a dip during phase 3 when COVID-19 finally reached and spread across Australia. Topic 2 (international affairs) was consistently the topic that evoked the most negative language. In contrast, Topic 3 which represents discourse about the restrictions and their consequences for the home and family life, while being associated with substantive negative polarity in phases 2 and 3, shifted towards positive polarity and was notably positive in later stages. A similar trend is observable for Topic 5 which dealt with economic issues. Topic 5 also experienced a very drastic shift towards negativity during phases 2 and 3, but turned substantially positive after this initial negative shift. Topic 4, which represents discourse about the spread of COVID-19, was consistently the most positive discourse until it experienced a shift towards negativity during phase 6 due to incidents which lead to rapid growth in the spread of COVID-19 cases in Victoria and New South Wales.
Regarding the association of sub-discourses and the use of emotives (words associated with selected core emotions), the analysis has shown that these associations, while remaining comparatively stable within topics, differ substantially across topics. There are, nonetheless, some interesting trends that have emerged: Topic 3 which revolved around the effects of the restrictions on family and home life was most closely associated with JOY-emotives (see Figure 11, right centre panel), while ANTICIPATION and TRUST emotives figured most prominently with Topic 5 (economic issues) (see Figure 11, top and bottom right panels). Topics 3 and 5 were characterized by over-proportionate use of positive emotives (e.g.,
The periodization of the data also allowed us to unearth differences between these periods that would not have been detected if the data were not split into periods. This holds true not only for the extraction of keywords that are significantly over- and under-used within periods (see Figure 6), but also for the comparative analysis of topic proportions, polarity, and emotive use across phases (Figures 7 to 11).
The results of the present study thus exemplify: (a) how data-driven text-mining approaches can profit from linguistically informed methods; (b) how corpus linguistics techniques can enrich analyses of social media discourse; and (c) and what can be gained by distinguishing thematically coherent topics and splitting discourses into developmental stages before applying text-mining methods to social media discourse, which arguably provides more meaningful results than treating the COVID-19 discourse as a single, thus extending existing research and providing a prototype for future research on other public discourses on major global and national events.
Overall, the advantages of the present approach stem from its ability to further inspect and analyse distinct periods and sub-discourses (topics). These topic and phase specific associations and trends would not have been detected with an approach that treated the COVID-19 discourse as a single, homogenous set of undifferentiated data or static discourse. As such, the present study adds to our understanding of how and in which phases the COVID-19 discourse unfolded in the Australian Twittersphere, allowing us to gain insights into emotional responses to the evolving situation across a significant sample of the population. Detecting these trends as well as determining phase-specific keywords was made possible by combining data-driven text-mining methods with quantitative and qualitative corpus linguistics techniques. This study thus exemplifies how both approaches can complement each other. Finally, the study represents a prototype for a time-sensitive analysis of discursive trends that can be readily applied to similar analyses dealing with the unfolding of discourse that accompanies social movements and responses to other major national or international events, such as the Black Lives Matter movement or the Australian bushfires. In particular, the present study shows how analyses can detect shifts in focus and sentiment as public discourses evolve in real time, thereby providing stakeholders with a more fine-grained and detailed understanding of the public’s reaction to socially salient events.
Despite these findings, however, the present analysis suffers from at least three shortcomings: first, it made no use of geospatial information (other than that Twitter users were identified as being Australian); second, it did not include tweets that contained non-English characters; and third, it did not investigate unconventional symbols, including emojis. Future research would profit from extending the method presented here in a way that allows us to retain such tweets for analysis. This, in turn, would enable such analyses to delve deeper into stance shifts mediated through emoticon use. In addition, hashtags such as
Outlook
While the present study is based on a 1% subsample of the Australian Twittersphere, we hope to extend the analysis to the entire Australian Twittersphere and to significantly extend the period that the present data covers – from 20 April 20 2020, which is the current cut-off date, to 3 November 2020, the day of the US election.
Furthermore, we plan to test the capacity of the present methodology by generalizing it to other public discourses. The present study represents a prototype, developed in a way that makes it readily applicable to other discourses, including discourses around the Australian bushfires and the Black Lives Matter protests. As such, we hope to extend the methodology of the present study to analyses of other significant public discourses.
Finally, while the present study excluded tweets which contained non-alphanumeric characters, including not only glyphs form non-Latin based languages but also emojis and emoticons, we are currently working on an extension of the present method which will allow us to retain emojis and emoticons, while still removing non-English tweets. Retaining emoticons and emojis would enable us to perform more fine-grained analyses that could focus on shifts in stance based not only on changes in word frequencies but also on emoticon use.