
Abstract
Keywords
Introduction
Heart failure (HF) is one of the major pandemics of the twenty-first century and affects more than 64 million people worldwide. 1 With the rapid growth of China's ageing population, the incidence, prevalence and mortality of HF will continue to increase. 2 Regardless of the cause of HF, it carries enormous social, clinical and economic burdens. Therefore, increasing patient survival and improving patient prognosis are the goals of treating HF.
With the rise of machine learning (ML) technology, an increasing number of clinicians are turning their attention to ML. ML has become a promising tool in health care to help clinicians detect disease patterns, predict patient risk profiles and extract clinical knowledge from massive amounts of data. 3 Computer-aided diagnostic systems can accurately and efficiently diagnose complex health problems through the implementation of ML algorithms. However, in addition to specific software and algorithms, survival ML modelling is also constrained by the essential explanation of the model's output. In recent years, many explainable machine learning (XAI) algorithms have been proposed,4,5 and in an effort to improve the interpretability, explainability and transparency of ML modelling results, ‘black-box’ dark ML predictions are transformed into easier-to-interpret ‘white-box’ glass predictions by XAI algorithms. In this way, physicians can more easily translate complex information in ML models into reliable daily clinical choices.6,7
Recently, the XAI method has been applied to survival models, and researchers have developed several R packages for survival models.8–10 Of these, the survex package is a recent development that has not been applied to the prediction of survival in HF patients. Therefore, the aim of this study was to use the survex package to interpret and compare two survival models, the Cox proportional hazards regression model (coxph) and the random survival forest (rfsrc) model,11,12 and to use this approach to estimate overall survival (OS) and its determinants in HF patients.
Materials and methods
Study population
As a rough estimate, the sample size should be 10 times the number of independent variables, and this study involves 41 independent variables, so the sample size should be greater than 410. This study is retrospective. Our study included 1221 HF patients who were hospitalised at the First Affiliated Hospital of Kunming Medical University between January 2017 and October 2021 due to acute exacerbation of chronic HF. These patients had New York Heart Association (NYHA) functional class III or IV disease. The following patients were excluded: (i) patients who lacked the required data; (ii) patients who had severe comorbidities (malignancy, infectious, haematological, or severe hepatic or renal dysfunction) and (iii) patients who were lost to follow up. In the end, 1159 patients were included in this study.
Data collection
At the time of admission, we collected basic information, history, current treatment, laboratory results, electrocardiogram data and cardiac ultrasound data from the patients. A total of 104 variables were collected for each patient. To determine the more holistic clinical characteristics of the study population, we identified 41 variables potentially associated with HF to analyse the baseline population characteristics; these variables have been frequently used in other studies.13–15 Ultimately, we selected 8 additional important variables from these 41 variables that have been shown to affect survival and prognosis in HF patients and used them to create two additional survival models (coxph and rfsrc). In a study by Sciomer et al., 16 age was shown to affect the prognosis of HF patients. A low albumin concentration is associated with a poorer prognosis in HF patients. 13 CRP (C-reactive protein) and BNP (brain natriuretic peptide) are independent risk factors in HF patients.17,18 Low serum sodium and low serum chloride increase mortality in HF patients.19,20 A study by Tedeschi et al. 21 demonstrated that chronic kidney disease and elevated uric acid worsened the prognosis of HF patients. In the end, we chose 8 variables: age, serum albumin concentration, CRP concentration, lg BNP concentration, blood sodium concentration, blood chloride concentration, uric acid concentration and eGFR (estimated glomerular filtration rate). All blood samples were collected and delivered to the laboratory of the First Affiliated Hospital of Kunming Medical University after the patients had fasted overnight (8–12 hours).
Through phone conversations with patients or their relatives, the investigators gathered survival data; those who did not answer the phone were considered lost. Written informed consent was obtained from all patients before the start of this study.
Algorithm development
The traditional machine learning models are ‘black box’ models with low interpretability and transparency. To increase the breadth of model explainability tools accessible in the R environment, packages such as DALEX and iml have been developed, which provide a comprehensive variety of explainable machine learning approaches. While there are several programmes in this field, their primary focus is on describing classification and regression models. Certain explanatory approaches may be used for survival models, but careful adjustments are required due to the models’ unique predictive character. To overcome this issue, survex provides precisely customised explanations that reflect the temporal dimension inherent in survival model predictions. Furthermore, methods for explaining survival models have been developed, such as SurvLIME with a Python implementation and SurvSHAP(t). The survex package is likewise equipped to embrace these new procedures, which expands its functional range. It is worth noting that the survxai package served as a key inspiration for the creation of survex. Survex, on the other hand, provides a greater variety of features, freshly developed explanation approaches, and model support.
Statistical analysis
The primary outcome of this study was OS, which was the time from discharge to death from any cause or to the last follow-up visit for HF patients. We analysed OS using coxph and rfsrc and then used the XAI to explore survival and interpret the results.
For the baseline characteristics of the patients, continuous variables are expressed as the mean ± standard deviation if normally distributed; otherwise, they are expressed as the median with interquartile range. The categorical variables are presented as numbers and percentages. The distribution of the original BNP values was strongly skewed, so the values were log-transformed. Independent sample t tests were used for normally distributed continuous variables, Mann‒Whitney U tests were used for nonnormally distributed data, and Chi-square tests were used for categorical variables. A variable was considered to be statistically significant when its p value was <0.05.
For both the coxph and rfsrc models, model performance was first examined using the consistency C-index, the integrated cumulative/dynamic AUC and the integrated Brier score. Subsequently, a global explanation of the whole cohort was carried out using the time-dependent variable importance and the partial dependence survival profile. Finally, the local explanation for a single patient was derived from the SurvSHAP(t) and SurvLIME plots and the ceteris paribus survival profile. In all the graphs, the X-axis indicates the period between discharge and any cause of mortality or the final follow-up visit, where all the event times are highlighted in red and the census times are highlighted in grey.
All the statistical analyses for this study were performed with the IBM SPSS Statistics version 26.0, R 4.3.2, survex, survival, randomForestSRC, and MICE packages.
Results
Study population characteristics
A total of 1159 HF patients were included in this analysis. The median follow-up time for this study was 759 days. Ultimately, 536 patients died and 623 survived. The mean age of the included patients was 66.83 ± 12.52 years; 719 (62.0%) were males and 440 (38.0%) females. Specific differences between the deceased group and the survivor group are described in Table 1.
Baseline characteristics.

Note: When comparing differences in continuous variables, the independent samples t tests were used if normally distributed, and the Mann‒Whitney U tests were used if nonnormally distributed; differences between groups in categorical variables were compared using Chi-squared tests; p values were derived by comparing the deceased group with the survivor group; p value < 0.05 indicated statistical significance.
ACEI, angiotensin converting enzyme inhibitor; Alb, albumin; ALT, alanine aminotransferase; ARB, angiotensin II receptor blocker; ARNI, angiotensin receptor-enkephalinase inhibitor; AST, aspartate aminotransferase; BMI, body mass index; BNP, brain natriuretic peptide; BP, blood pressure; Cre, creatinine; CRP, C-reactive protein; CRT, cardiac resynchronisation therapy; CRTD, cardiac resynchronisation therapy defibrillator; eGFR, estimated glomerular filtration rate; Hb, haemoglobin; HR, heart rate; LAd, left atrium diameter; LBC, lymphocyte; LVDd, left ventricular end-diastolic diameter; LVEF, left ventricular ejection fraction; NBC, neutrophil; NYHA, New York Heart Association; PLT, platelet; RAd, right atrium diameter; RBC, red blood cells; RVd, right ventricle diameter; SGLT-2I, sodium-glucose cotransporter 2 inhibitor; TC, total cholesterol; UA, uric acid; WBC, white blood cells.
Model performance for the whole cohort
We constructed two different survival models (coxph and rfsrc) using eight clearly reported factors affecting the prognosis of HF for survival analysis. The eight factors were age, lg BNP, blood sodium, blood chloride, albumin, uric acid, eGFR and CRP. We used Brier scores, C/D AUCs and C-indices to estimate model performance. The values of all these metrics are shown on the
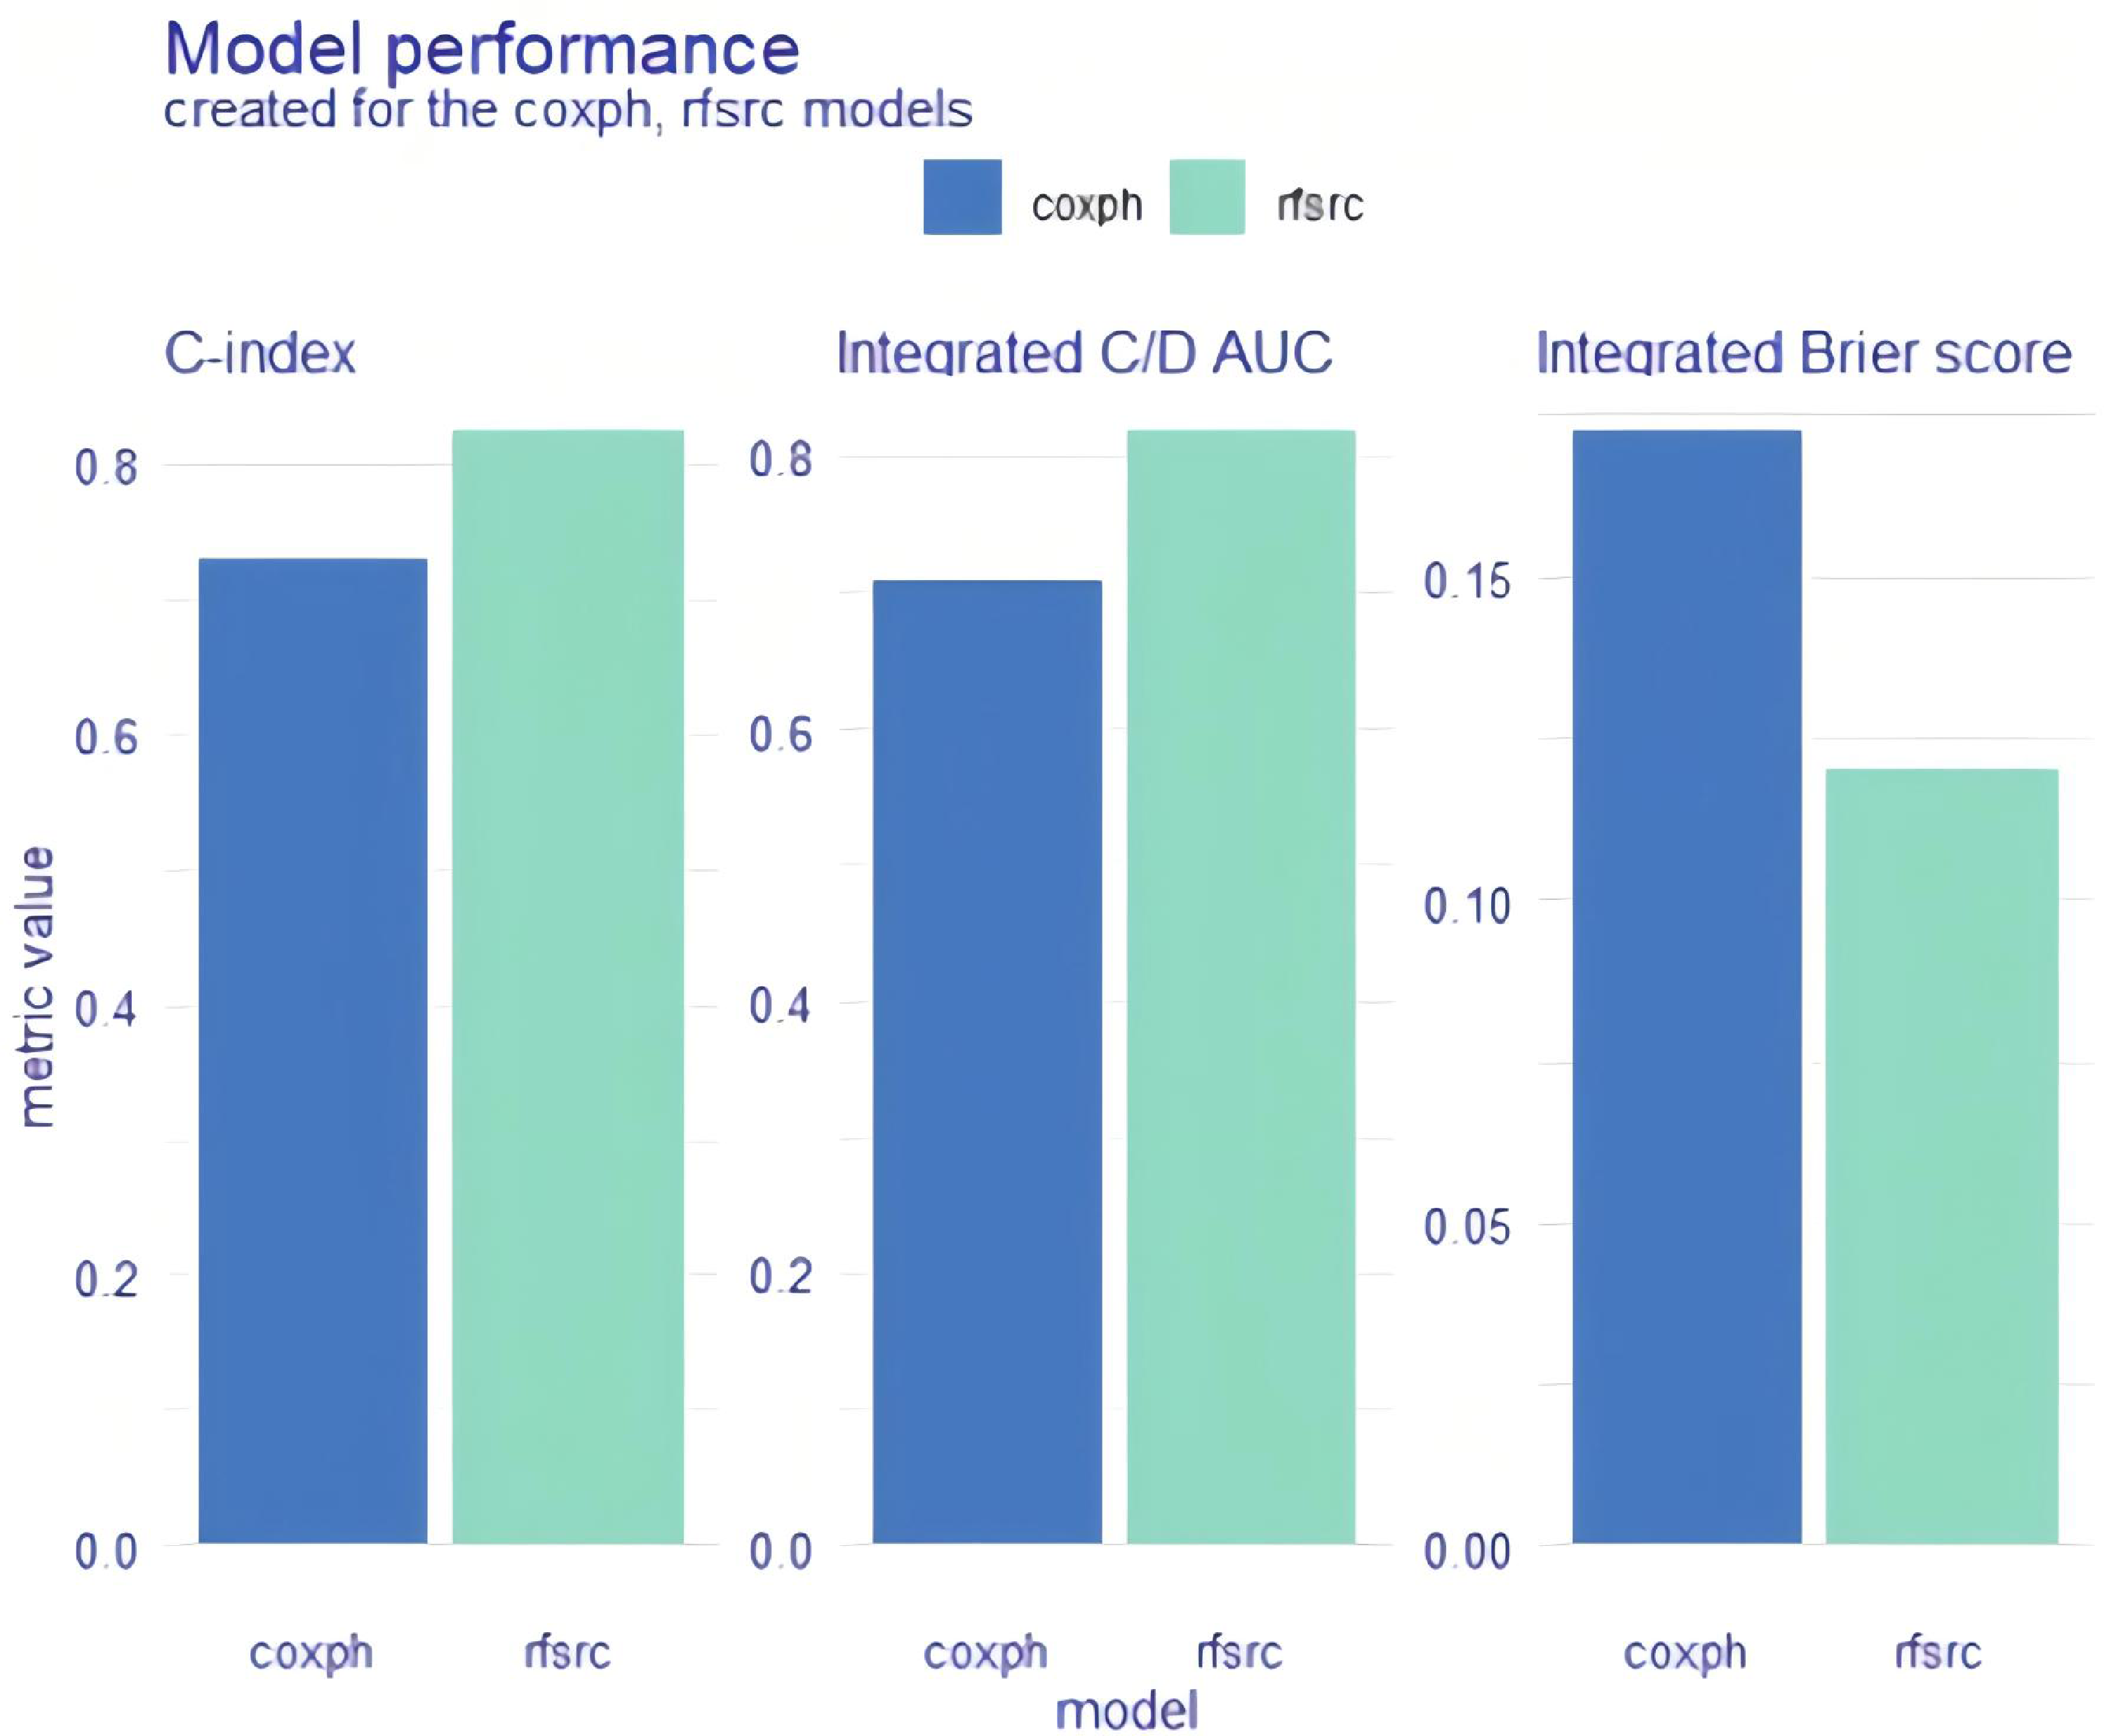
Model performance for the whole cohort. Explainable machine learning (XAI) data are shown as bar plots. coxph: Cox proportional hazards regression; rfsrc: random survival forest.

Model performance for the whole cohort. Explainable machine learning (XAI) was used as a time-dependent estimation. coxph: Cox proportional hazards regression; rfsrc: random survival forest.
Univariate and multivariate Cox proportional hazards model for overall survival in heart failure patients.

BNP: brain natriuretic peptide; CI: confidence interval; eGFR: estimated glomerular filtration rate; HR: hazard ratio.
Global explanation: Time-dependent feature importance for the whole cohort
For the coxph and rfsrc models, we used two different methods to examine the importance of time-dependent variables for the whole cohort. Variable interpretation was performed after splitting each variable. The

Global explanation: time-dependent feature importance for the whole cohort and Brier score loss after permutation. Alb: albumin; BNP: brain natriuretic peptide; coxph: Cox proportional hazards regression; CRP: C-reactive protein; eGFR: estimated glomerular filtration rate; rfsrc: random survival forest.
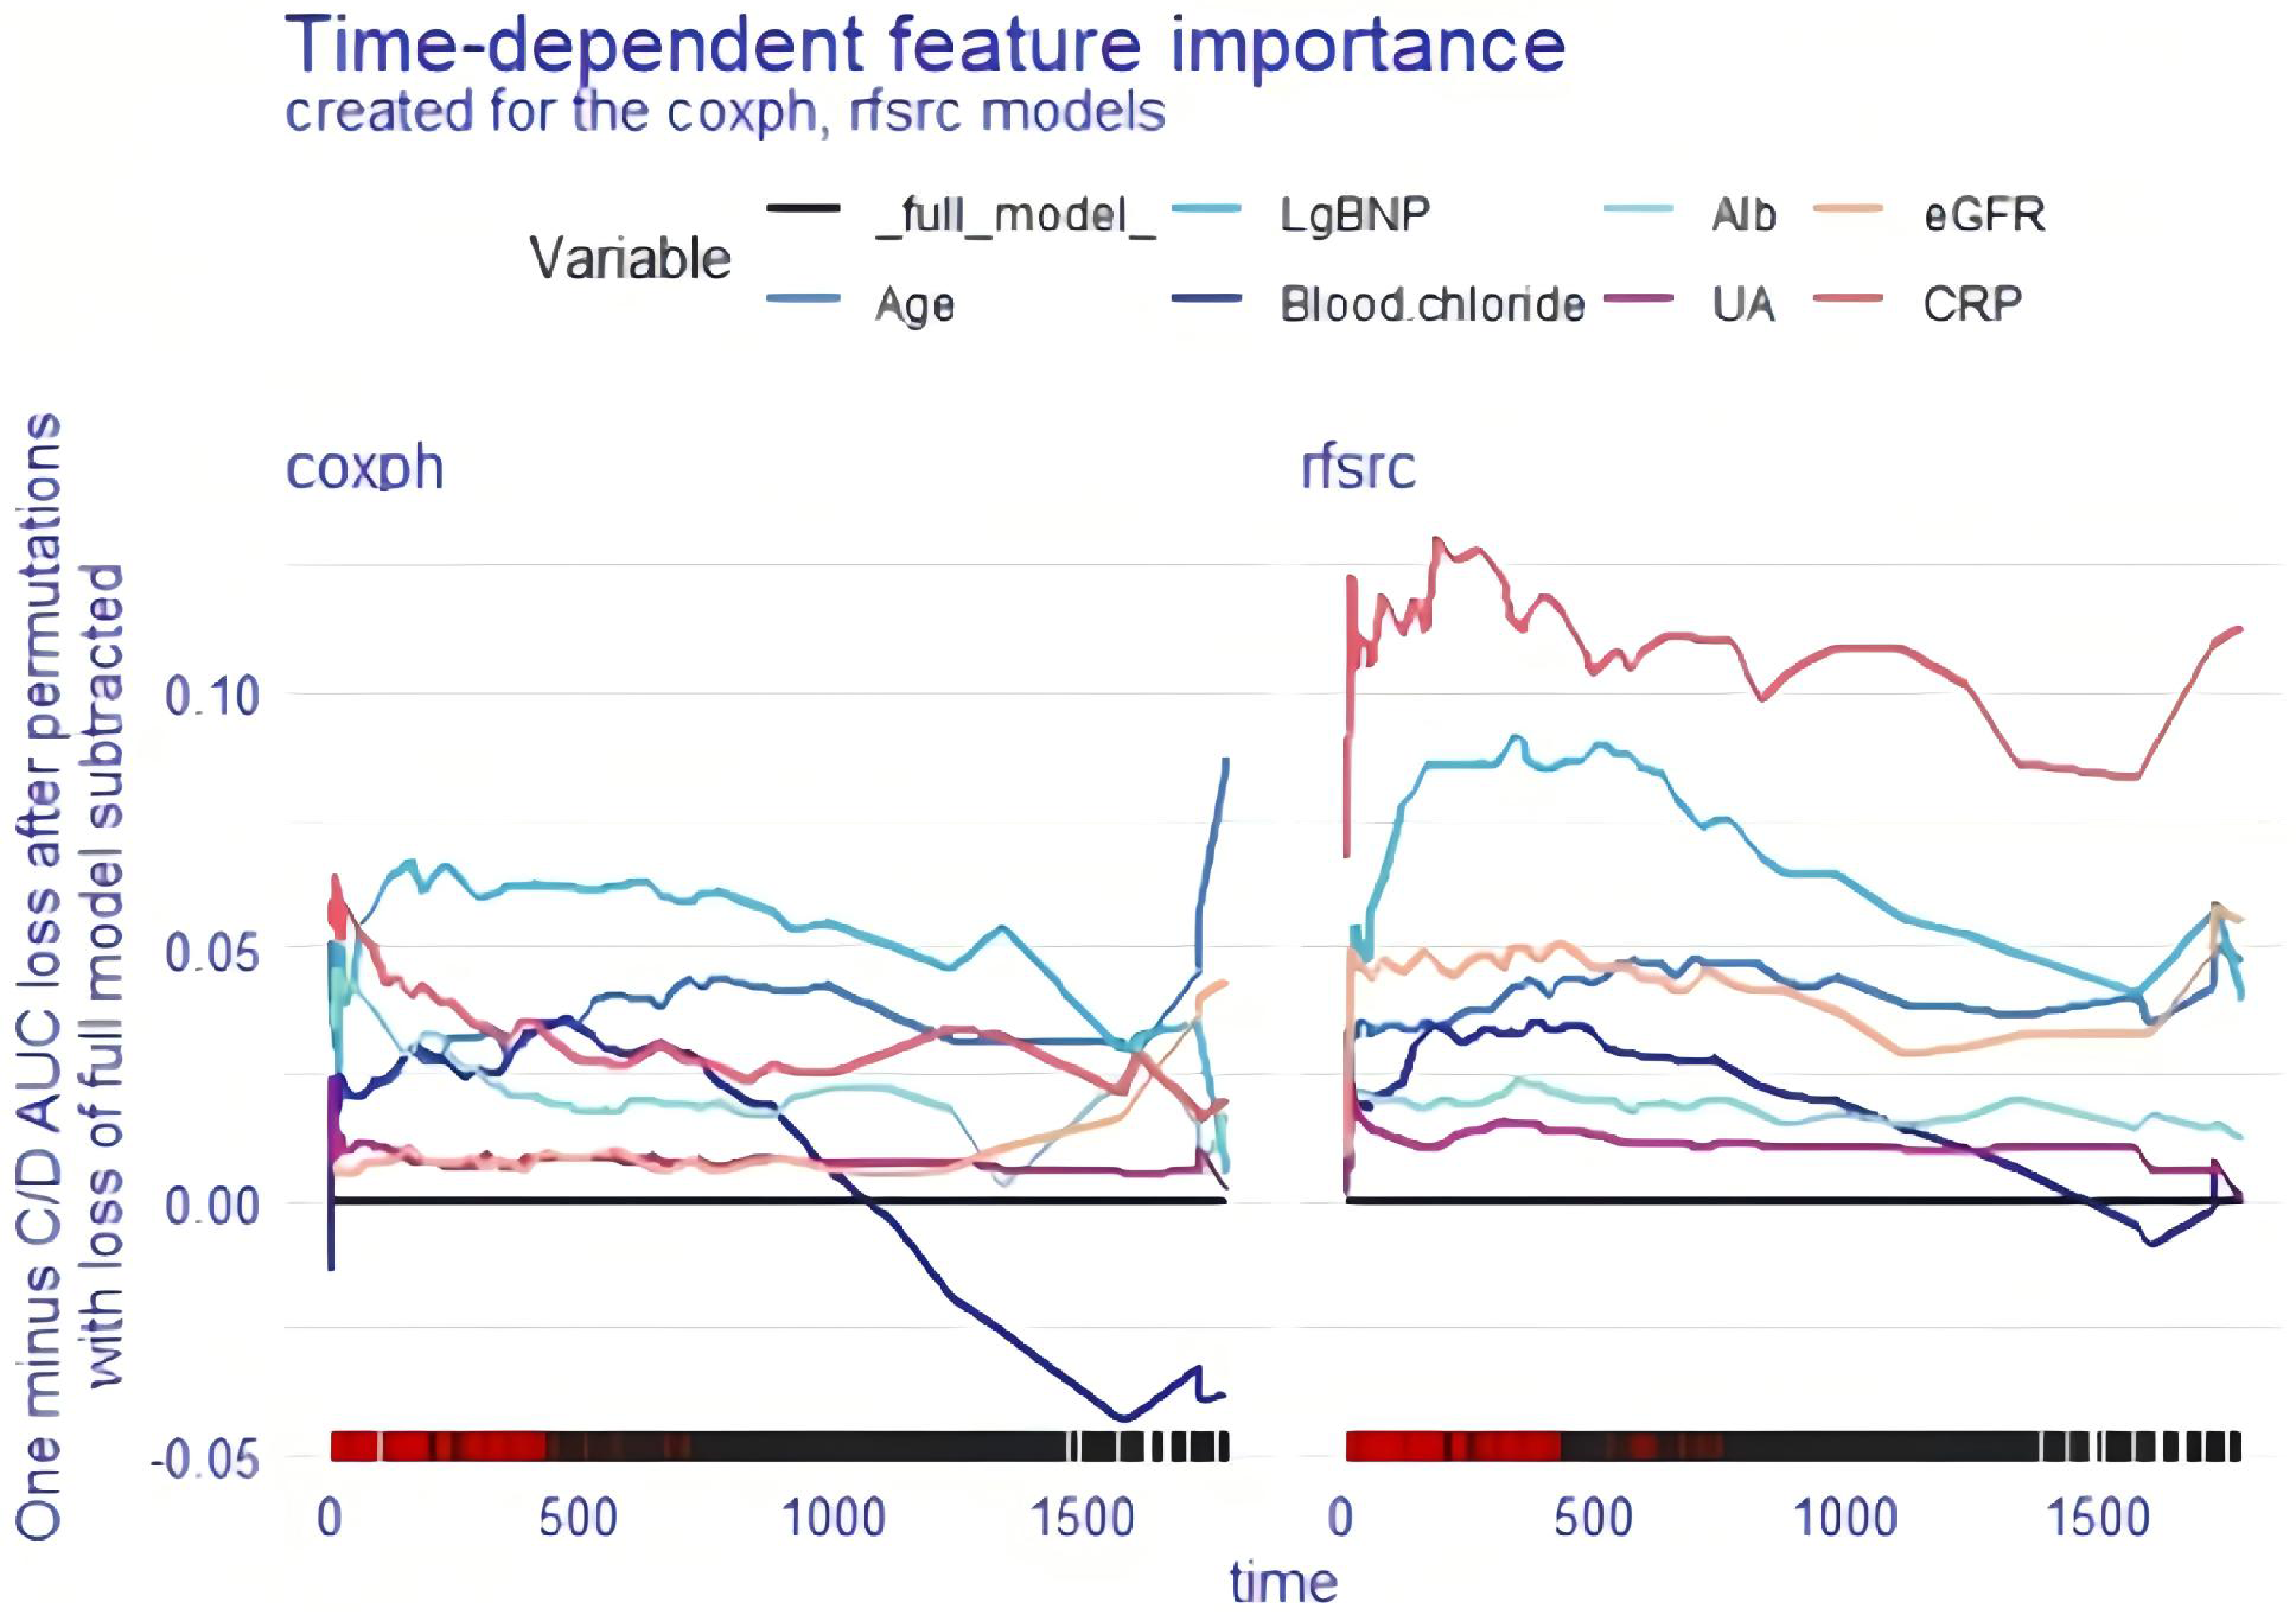
Global explanation: time-dependent feature importance for the whole cohort and C/D AUC loss after permutation. Alb: albumin; BNP: brain natriuretic peptide; coxph: Cox proportional hazards regression; CRP: C-reactive protein; eGFR: estimated glomerular filtration rate; rfsrc: random survival forest; UA: uric acid.
Global explanation: Partial dependence survival profile for the whole cohort
The partial dependence survival profiles (PDPs) for the cxoph and rfsrc models are shown in Figures 5 and 6, respectively, which indicate how the OS of the whole cohort changes if the value of one determinant is altered but all other factors are held constant. The

Global explanation: PDP for the whole cohort; coxph model. Alb: albumin; BNP: brain natriuretic peptide; coxph: Cox proportional hazards regression; CRP: C-reactive protein; eGFR: estimated glomerular filtration rate; PDP: partial dependence survival profile; UA: uric acid.

Global explanation: PDP for the whole cohort; rfsrc model. Alb: albumin; BNP: brain natriuretic peptide; CRP: C-reactive protein; eGFR: estimated glomerular filtration rate; PDP: partial dependence survival profile; rfsrc: random survival forest; UA: uric acid.
Local explanation: SurvSHAP(t) plot for a single patient
Using SurvSHAP(t) plots, it is possible to investigate the time-dependent survival contribution of each risk factor to OS for a selected patient. The

Local explanation: SurvSHAP(t) plot for a single patient. Alb: albumin; BNP: brain natriuretic peptide; coxph: Cox proportional hazards regression; CRP: C-reactive protein; eGFR: estimated glomerular filtration rate; rfsrc: random survival forest; UA: uric acid.
Local explanation: SurvLIME plot for a single patient
The SurvLIME plot is very similar to the SurvSHAP(t) plot in that both can be used to detect the survival predictors that have the most impact on a single selected patient. There are two parts to the SurvLIME plot. The left part shows the effect of each variable on the survival of a single selected patient: the larger the area, the greater the influence; the higher the value of the local importance of SurvLIME, the lower the chances of survival. The right part shows a comparison between the predictions of the coxph or rfsrc models and the predictions of the black-box model: the closer the two functions, the more accurately the model's results are explained. We still included patient #164 in the coxph and rfsrc models to obtain two SurvLIME plots (Figures 8 and 9). From Figure 8, we can conclude that, in coxph, albumin increases the survival chances of this patient, and lg BNP decreases the survival chances of this patient; these two functions gradually separated after 500 days, which indicated that the accuracy of the model's survival estimation for this patient gradually decreased after 500 days. Figure 9 shows that in the rfsrc cohort, blood sodium increases patient survival, and lg BNP decreases patient survival; these two functions are relatively close to each other, which means that the survival estimation of the patient is relatively accurate.

Local explanation: SurvLIME plot for a single patient; coxph model. Alb: albumin; BNP: brain natriuretic peptide; coxph: Cox proportional hazards regression; eGFR: estimated glomerular filtration rate; UA, uric acid.

Local explanation: SurvLIME plot for a single patien; rfsrc model. BNP: brain natriuretic peptide; CRP: C-reactive protein; eGFR: estimated glomerular filtration rate; rfsrc: random survival forest; UA: uric acid.
Local explanation: Ceteris paribus, survival profile for a single patient
The ceteris paribus survival profile (CPP) can be seen as an equivalent of the PDP, but it should be used for a single observation. As with PDP, the lower the

Local explanation: CPP for a single patient; coxph model. Alb: albumin; BNP: brain natriuretic peptide; coxph: Cox proportional hazards regression; CRP: C-reactive protein; CPP: ceteris paribus survival profile; eGFR: estimated glomerular filtration rate; UA: uric acid.

Local explanation: CPP for a single patient; rfsrc model. Alb: albumin; BNP: brain natriuretic peptide; CPP: ceteris paribus survival profile; CRP: C-reactive protein; eGFR: estimated glomerular filtration rate; rfsrc: random survival forest; UA: uric acid.
Discussion
The medical field generates a large amount of data, including patient records, images, physiological signals and genetic data. ML can help doctors and researchers extract useful information from complex data and identify potential patterns and associations. ML is also increasingly being used in the field of HF.22–24 ML can help clinicians identify potential associations between HF survival and clinical indicators, allowing for the early identification of high-risk patients and the provision of appropriate treatment options. While the integration of ML into biomedical research and health care holds great promise, the opaque nature of black-box models has caused reasonable concerns. To solve this problem, researchers have developed several XAI methods. Among them, the survex package in R developed by Mikolaj Spytek's team is a very useful tool that provides a large and complete selection of ML model interpreters. 9 With the survex software package, all analyses may be performed under a unified interface, which enables the exploration and easy comparison of the outcomes derived from different survival models (coxph and rfsrc) for HF patients.
First, we examined the model quality of coxph and rsfrc by measuring their performance with three different metrics: the C-index, the integrated C/D AUC, and the integrated Brier score. Our study showed that, compared with coxph, rfsrc had higher C-index and C/D AUC values and lower Brier score. Thus, the performance of the rfsrc model is better and more predictive than that of the other models, but the model is also less interpretable.
Second, a range of global explanations of the coxph and rsfrc models were carried out to explore the predictions of the models for the whole patient cohort. Two different loss functions, the Brier score and 1-CD/AUC, were used to estimate the importance of each mutual variable, involving a time-dependent process. The Brier score loss after permutation and the C/D AUC loss after permutation showed that lg BNP was the worst independent risk factor for OS in coxph-modelled patients and that CRP was the worst independent risk factor for OS in rfsrc-modelled patients. The PDPs showed that CRP, lg BNP, eGFR, albumin, age and blood chloride concentration were important adverse predictors of OS in HF patients, whether in the cxoph or rfsrc model.
Finally, the model's predictions for a single selected observation can be explored through another series of local explanations. The SurvSHAP(t) is based on SHAP values, an additivity interpretation method based on Shapley values from cooperative game theory. 25 The SurvSHAP(t) allows the analysis of the impact of variables on model predictions at different points in time, providing a unique perspective on understanding survival function predictions. The SurvSHAP(t) quantifies the importance of each feature in the model by calculating its contribution to the prediction, making the predictions more interpretable. 26 The SurvLIME evaluates local interpretability by evaluating attributes for a specific individual. It differs from prior techniques in that it takes into account temporal space for explanation. It starts by creating a set of neighbours, gets a set of predictions for the neighbours, and then fits a coxph to minimise the difference between the black box model's predictions and the local explainer's predictions. 27 The SurvSHAP(t) function may show the effect of each risk factor on OS for the selected patient. The function of SurvLIME allows us to understand the importance of each factor for OS and its favourable or unfavourable impact on the time course. With the CPP, it is possible to graphically estimate the effect of each risk factor on the OS of any individual observation.
The three steps above enabled us to determine which factors influence the OS of HF patients and the extent of their influence. We can also find the most important risk factors affecting OS for a single selected patient so that a personalised treatment plan can be developed for the patient.
There are several limitations to our study. First, the use of retrospective data for model construction in the study raises the possibility that some potential risks were not taken into account; thus, further prospective experiments could be performed to validate the predictive models. Second, the subjects we chose were HF patients in NYHA class III or IV; thus, the prediction models might not be applicable to patients with milder HF symptoms, and we may gather information from patients in NYHA class I or II to improve the use of these prediction models in the future. Finally, this study ignored the issues of model validation and overfitting, and our later research will validate the model by dividing the population into a training set and a validation set to strengthen the model's credibility and prevent model overfitting.
Conclusion
The survex package in R not only allows for a more complete and intuitive interpretation of survival models but also allows for comparison and interpretation of results from different survival modelling methods. This study showed that the predictive model constructed by the rfsrc algorithm comprehensively outperformed the predictive model constructed by the coxph algorithm. Our models can be used for both the entire population and for individual selected patients, and they can help clinicians personalise treatment plans based on the factors that affect the OS of each HF patient.