
Abstract
Keywords
Introduction
Mechanical ventilation is indispensable in managing critically ill patients in the intensive care unit (ICU), particularly for patients with respiratory failure or acute respiratory distress syndrome (ARDS).1,2 While this life-sustaining intervention stabilizes patients, its prolonged use can lead to complications such as ventilator-associated pneumonia (VAP) and lung injuries,1,3,4 significantly impacting patient outcomes and raising healthcare costs.
Clinicians often rely on subjective, experience-based assessments to estimate the expected duration of mechanical ventilation, integrating multiple clinical features into implicit predictions. While clinical indicators such as shock at admission, sepsis-related parameters, or scores like the sequential organ failure assessment (SOFA) score may help in this decision-making, their interpretation can vary considerably between practitioners and patient contexts. Such evaluation is prone to inaccuracies due to the complexity and variability in clinical conditions.5,6 Artificial intelligence (AI) may offer a promising solution, enabling data-driven predictions that can complement clinical judgment.7,8 Earlier studies have focused on predicting mechanical ventilation duration, using machine learning and deep learning approaches6,9–13 and have used classification6,9–11 and regression12,13 models for prediction. The classification models demonstrated in previous studies have used different binary classification cut-offs for defining prolonged mechanical ventilation duration and have achieved an Area under the receiver operating characteristic curve (AUROC) anywhere between 0.69 and 0.83 using different classifiers.6,9–11 The previous regression studies on ARDS patients achieved a root mean squared error (RMSE) 5–6 days.12,13 Therefore, more studies in this area are desirable. Further, most datasets used for model training come from high-income countries,6,9,12,13 limiting their generalizability to diverse populations as it may not capture the characteristics of healthcare systems in low- and middle-income countries (LMICs). 14
This study is an attempt to develop supervised machine learning models to predict mechanical ventilation duration in ICU patients using a diverse dataset from a single tertiary care hospital in India, representing a typical LMIC setting. This study can classify patients into short- or long-term ventilation groups as well as predict ventilation days. The Shapley additive explanations (SHAP)-based feature selection enhances prediction accuracy and interpretability, aiding informed clinical decisions.15,16 The findings could have significant implications for improving ICU workflows, optimizing resource allocation, timing of tracheostomy, and advancing patient care, 6 especially in low- and middle-income countries with limited resources.
Methodology
Data set and features
The data set consisted of a total of 660 mechanically ventilated patients {n = 660, Male:Female = 365:295, Age = 44.45 ± 19.36 years (mean ± standard deviation)} from three ICUs at AIIMS, Delhi, collected in 2023–24 after ethics approval (Institute Ethics Committee of All India Institute of Medical Sciences, New Delhi, India; ethical approval number: IECPG-190/20.04.2023, RT-05/07.06.2023, CTRI/2023/10/058972). Clinical parameters were recorded at the time of ICU admission. Of these, 323 patients {n = 323, Male:Female = 160:163, Age = 42.87 ± 19.54 years (mean ± standard deviation)} who were alive at the time of extubation were used for regression model to ensure accurate ventilation duration records. This approach improved model training by excluding extubation post death, enhancing data quality–a key factor in machine learning performance. 17 The descriptive statistics of all the features analysed in the dataset are provided in Supplemental Table 1. The subset included for the regression model had patients with diverse pathologies (67% patients with PO2/FiO2 ratio <300, 56.5% patients with mean arterial pressure <65 or requiring vasopressors, 39.2% patients with creatinine levels >1.5, 30.9% patients with total bilirubin levels > 2 mg/dL or INR >1.5 and 38.6% patients with Glasgow Coma Scale score <15), including patients with ARDS and respiratory failure and 105 patients out of the subset had undergone tracheostomy. The classification model used 218 non-tracheostomized patients in order to observe changes in the model performance and since tracheostomy is one of the important clinical decisions that can be taken with the prediction model.
The data set comprised of clinical parameters, 92 measured by the clinician in the ICU and 8 clinically significant features derived from the existing parameters. These were categorized into seven groups; i) demographic ii) vitals iii) blood tests and arterial blood gas parameters iv) parameters related to mechanical ventilation v) respiratory system specific features vi) cardiovascular system specific features and vii) ICU specific features. Some of the clinically significant scores that were a part of the data set were SOFA score, which is an important clinical score used in ICU to determine patient prognosis,18,19 ventilatory ratio, PO2/PCO2, rapid shallow breathing index, shock index and cumulative lung ultrasound score, a valuable clinical parameter in critically ill patients to incorporate imaging data indirectly for the analysis. 20 The clinical parameters selected were based on availability in the hospital, clinical significance, and prior studies.21,22,23 The features were transformed into numerical format, with categorical variables encoded using one-hot encoding and continuous variables retained as floating-point numbers. Features with more than 3% missing data were excluded to reduce the risk of bias associated with imputation in a limited sample size. This criterion resulted in the exclusion of only seven features from further analysis. For the remaining missing values, median imputation was applied to continuous features, while mode imputation was used for binary variables.
Features selection
Feature selection was essential to reduce model complexity. While offering great opportunities to discover patterns and tendencies, dealing with high-dimensional data can be complicated due to the so-called curse of dimensionality. 24 For both the models, features were selected using Shapley additive explanations (SHAP), a game theory approach to calculate a value for each feature that represents its contribution to the model's prediction. 15 It is instrumental in healthcare because it enhances model transparency and supports clinician trust in AI predictions. Various studies emphasize the importance of SHAP specifically in healthcare.25,26,27 Random forest model was used for calculating SHAP scores for feature importance. Following SHAP, the top features contributing to >80% of the total SHAP scores were included for analysis. Some of the low ranking or redundant features, based on a Spearman correlation threshold of >0.8 and in cases where a composite feature and one of its constituent variables conveyed overlapping information, were eliminated. This resulted in a reduced feature set of 34, representing 86% of data importance in the regression model, and 47, representing 93% of data importance in the classification model.
Prediction model development
Two AI models: 1. Regression model (323 patients) and 2. Classification model (218 patients) using various algorithms were developed. Both the models were trained using 5-fold cross-validation, with a split of 80% data for training and 20% for testing respectively.
The outcome classes were equally stratified across training and testing groups to prevent any class bias.
32
Six models were trained; logistic regression, discriminant, SVM, K-nearest neighbour (KNN), kernel and bagged ensemble methods. Misclassification costs were adjusted for KNN and bagged ensemble models to observe the difference in model performance. The focus was to correctly identify the patients who would require mechanical ventilation for >3 days (specificity) since they would require more resource allocation and extra care. Bayesian optimization was employed for hyperparameter tuning, an efficient method that leverages probabilistic models to optimize machine learning model performance.33,34 Classification model metrics were accuracy, AUROC, sensitivity, specificity, positive predictive value (PPV), and negative predictive value (NPV).
Comparison of regression model features between training and test datasets and comparison of classification model features between short- (≤3 days) or long-term (>3 days) mechanical ventilation groups are presented in Supplemental Tables 2 and 3, respectively. The Mann Whitney-U and Chi-Square tests were applied to determine statistical significance (p-value < 0.05) of continuous and categorical features between the two groups respectively.
Results
Regression model
Table 1 shows the regression model performance for predicting mechanical ventilation duration. Compared to other models, the Least Squares Boosting Ensemble regression model achieved the best results giving a training RMSE of 5.24 days and R2 of 0.63 and a test RMSE of 4.66 days and an R2 of 0.65 using top 34 SHAP-selected features. Figure 1 highlights SHAP feature importance, where tracheostomy (53.66%), illness duration before ICU admission (4.66%), and SGPT (3.13%) were observed to be key factors.

Top 20 SHAP ranked features for regression model.
Training and test performance for regression models for predicting duration of mechanical ventilation (days) in patients admitted in ICU.

Classification model
Table 2 shows the classification model performance for predicting mechanical ventilation duration with SHAP selected features and default misclassification cost. Bagged Ensemble and KNN demonstrated the best performance when the misclassification costs for false negatives (FN) and false positives (FP) were initially set to equal weight (1:1). Given the superior performance of these two models, the misclassification cost parameters were adjusted to further optimize their predictive accuracy. The misclassification costs were adjusted through a trial-and-error approach, and after multiple iterations, setting 2.5:2.5 yielded the best performance for the KNN models, indicating the model's sensitivity to cost parameters (Table 3). Figure 2 demonstrates SHAP feature importance, with Type of ICU admission (8.1%), PO2 (5.6%), and pH (5%) as key factors. KNN model achieved a training accuracy of 76%, AUROC 0.78, sensitivity of 73.9% and specificity of 78.2% and a test accuracy of 79.1%, AUROC of 0.82, sensitivity of 71.4%, and specificity of 86.4% using 47 SHAP-selected features. The training and test data were standardized using z-score normalization separately before model development. Additional hyperparameters for cost adjusted KNN model were: k = 9; distance metric = correlation; distance weight = equal. Figure 3 demonstrates ROC plots for cost-adjusted KNN model. A comparative assessment of classification models’ performances using all 100 features is shown in Supplemental Table 4.

Top 20 SHAP ranked features for classification model.

ROC plots for cost adjusted KNN model.
Training and test performance for classification models for predicting short- or long-term mechanical ventilation requirement in patients admitted in ICU.

Training and test performance of KNN and bagged ensemble classification models with altered misclassification cost (FP = FN = 2.5).

Discussion
This study developed robust and effective ML-based models for predicting duration of mechanical ventilation in ICU patients in LMICs with low resource settings. Two approaches were taken; first, to predict duration of mechanical ventilation in days using regression model and second, to predict short or long-term mechanical ventilation requirement using a 3-day cut-off classification model. Among regression models, the Least Squares Boosting Ensemble model achieved the best test RMSE of 4.66 days and an R2 of 0.65 using 34 SHAP-selected features (representing 86% of the data). Key features included tracheostomy (53.66% importance), duration of illness before ICU admission (4.66%), and SGPT (3.13%). Among classification models, the K-nearest neighbours model achieved the best test accuracy of 79.1%, AUROC of 0.82, sensitivity of 71.4%, and specificity of 86.4% using 47 SHAP-selected features (representing 93% of the data). Top features included type of ICU admission (8.1%), PO2 (5.6%), and pH (5%).
Previously developed classification models for predicting duration of mechanical ventilation were by Juan et al. 6 achieving an accuracy of 0.69 using logistic regression and by Parreco et al. 9 securing an AUROC of 0.83 using gradient boosting machines, both using the 7-day cut-off model. Another study by Villar et al. 10 focussing on ARDS patients observed an AUROC of 0.71 with multilayer perceptron model. The 3-day cut-off model developed by Vali et al. 11 achieved an accuracy between 0.69–0.77 and AUROC of 0.76. In addition, they tested multiple models with different binary classification cut-offs. The regression model developed by Sayed et al. 12 reported an RMSE of 6 days and by Zichen et al. 13 the Ensemble models observed an RMSE of 5.6 days, focussing on ARDS patients in the respective studies. There is no universally agreed-upon definition of prolonged mechanical ventilation and studies have adopted varying thresholds depending on clinical context and study objectives. For example, Juan et al. 6 and Parreco et al. 9 used a 7-day threshold to guide decisions around tracheostomy placement, noting that approximately 30% of mechanically ventilated patients require support for more than a week. Villar et al. 10 focused on ARDS patients and used a 14-day threshold to aid early identification of individuals requiring long-term ventilatory support. Vali et al. 11 explored multiple thresholds (>3, 5, 7, 10, 14, and 23 days) and highlighted the lack of consensus in prolonged mechanical ventilation definitions. The current study used a 3-day threshold to enable early risk stratification given the increased risk of VAP after 48–72 h, using balanced classes for both the outcomes, and to support decision-making in low-resource, high-patient-load ICU settings where this cut-off facilitates earlier interventions without requiring prolonged observation windows, which may be less feasible in such environments.
The regression model results developed by Sayed et al. 10 and Zichen et al. 11 are comparable to the findings of this study. However, direct comparison is difficult due to variations in AI techniques, datasets and selected features. Predicting continuous variables involves complex interactions between patient physiology, clinical interventions, and other unmeasured factors, making it inherently more difficult than binary classification.35,36 In addition, our regression study has limited utility in guiding an important clinical decision of performing tracheostomy. Additionally, as per the SHAP analysis, most important contributing factor to the performance of regression model in the study is the feature of Tracheostomy. This is also clinically explainable since an early tracheostomy can reduce the duration of mechanical ventilation, 37 which could be the reason for its high importance in determining the duration of mechanical ventilation as compared to other features. Notably, the SHAP plot (Figure 4) reveals that patients who underwent tracheostomy were predicted to have a higher duration of mechanical ventilation, likely reflecting that tracheostomy is more often performed in patients who are already critically ill and require prolonged respiratory support. However, the Tracheostomy feature makes it difficult to compare the importance of other features in the regression study. After tracheostomy, blood gas parameters appear in SHAP ranking list for regression model which is also observed in classification model; pH, PCO2 and Lactate are common to both. A longer duration of illness prior to ICU admission, along with elevated values of cumulative lung ultrasound score, alkaline phosphatase (ALP), procalcitonin, and international normalized ratio (INR), were indicative of increased illness severity and could be associated with prolonged mechanical ventilation, as shown by the SHAP dependence plots with locally weighted scatterplot smoothing (LOWESS) of top predictors in the regression model (Figure 4). Additionally, a higher rapid shallow breathing index (RSBI) is associated with extubation failure, which also aligns with the SHAP findings (Figure 4).

SHAP dependence plots with LOWESS trend lines for top 10 predictors in the regression model.
The classification study gives AUROC results similar to the model developed by Parreco et al., 9 however, this study was able to achieve the results using a much simpler KNN model. The classification model, when optimized with adjusted misclassification cost, provides predictions with higher accuracy (training 76% and test 79.1%) for the duration of mechanical ventilation in ICU patients. The model also demonstrated a higher specificity (training 78.2% and test 86.4%), indicating its ability to identify patients correctly requiring prolonged mechanical ventilation (negative class: > 3 days), which could be further beneficial for optimizing ICU resource planning. 38 Essentially, cost-sensitive learning involves assigning different misclassification costs to the different classes, based on their importance for the task at hand. The absolute cost scaling of 2.5:2.5 should increase the weight of the error function during optimization, making the model more sensitive to minimizing overall errors. However, after multiple iterations assigning same but higher misclassification cost yielded better specificity in comparison. This variation could be due to limited data set for testing. The cost-sensitive paradigm has been largely explored in the context of imbalanced data sets. 39 The effectiveness of the different cost-sensitive techniques is yet to be comparatively explored in high-dimensionality problems. 40
The classification model highlights type of ICU admission as the most important feature. One can assume that patients transferred from the operation theatre (OT) to the ICU could have shorter ventilation durations compared to those admitted from the emergency room or wards due to less severe underlying conditions or pre-existing health issues in OT patients who are admitted for elective procedures. To further explore this, we analysed the distribution of ICU admission sources across the two outcome classes (<3 days vs. ≥ 3 days) in the classification cohort and observed that a significantly greater proportion of patients admitted from the OT were indeed found in the <3 days ventilation group, while transfer from emergency, ward or other ICUs were more frequent in the ≥3 days group (Supplemental Table 3). This supports our earlier clinical reasoning and states the potential influence of admission source on ventilation duration. The routine blood tests and blood gas parameters are ranked higher which are clinically significant as well. The importance of lab data and blood gas parameters has also been highlighted in the study conducted by Vali et al. 11 Figure 5 represents SHAP dependence plots with LOWESS trendline illustrating the relationship between key acid-base markers and predicted duration of mechanical ventilation. The plots show that features indicative of acidosis i.e., lower pH, higher PCO2 and elevated lactate levels, consistently corresponded to more negative SHAP values. This suggests that these features contributed to a higher likelihood of prolonged mechanical ventilation (>3 days), aligning well with established clinical understanding of the impact of acid-base imbalance on patient outcomes. A higher PO2 corresponding to lower SHAP values, which in this model indicated prolonged duration of mechanical ventilation, could be due to patients being on high FiO2 on other non-invasive oxygen support before or at the time of ICU admission. Respiratory system specific parameters such as RSBI, cumulative lung ultrasound score and ventilatory ratio also contributed towards model performance which is clinically meaningful in mechanically ventilated patients, as the elevated values pointed towards prolonged duration of mechanical ventilation. The SOFA score, a key prognostic indicator in the ICU, was among the top 20 features in the SHAP analysis of the classification model, with higher scores indicating worse prognosis. Thus, SHAP based feature ranking provides results which are clinically interpretable. The results suggest that multiple factors, some which are clinically relevant and used for the study and many more unmeasured parameters, are responsible for estimating duration of mechanical ventilation. Early clinical predictions of mechanical ventilation duration by intensivists are often imprecise,5,6 however, machine learning models hold significant potential for improving predictive accuracy in the future.
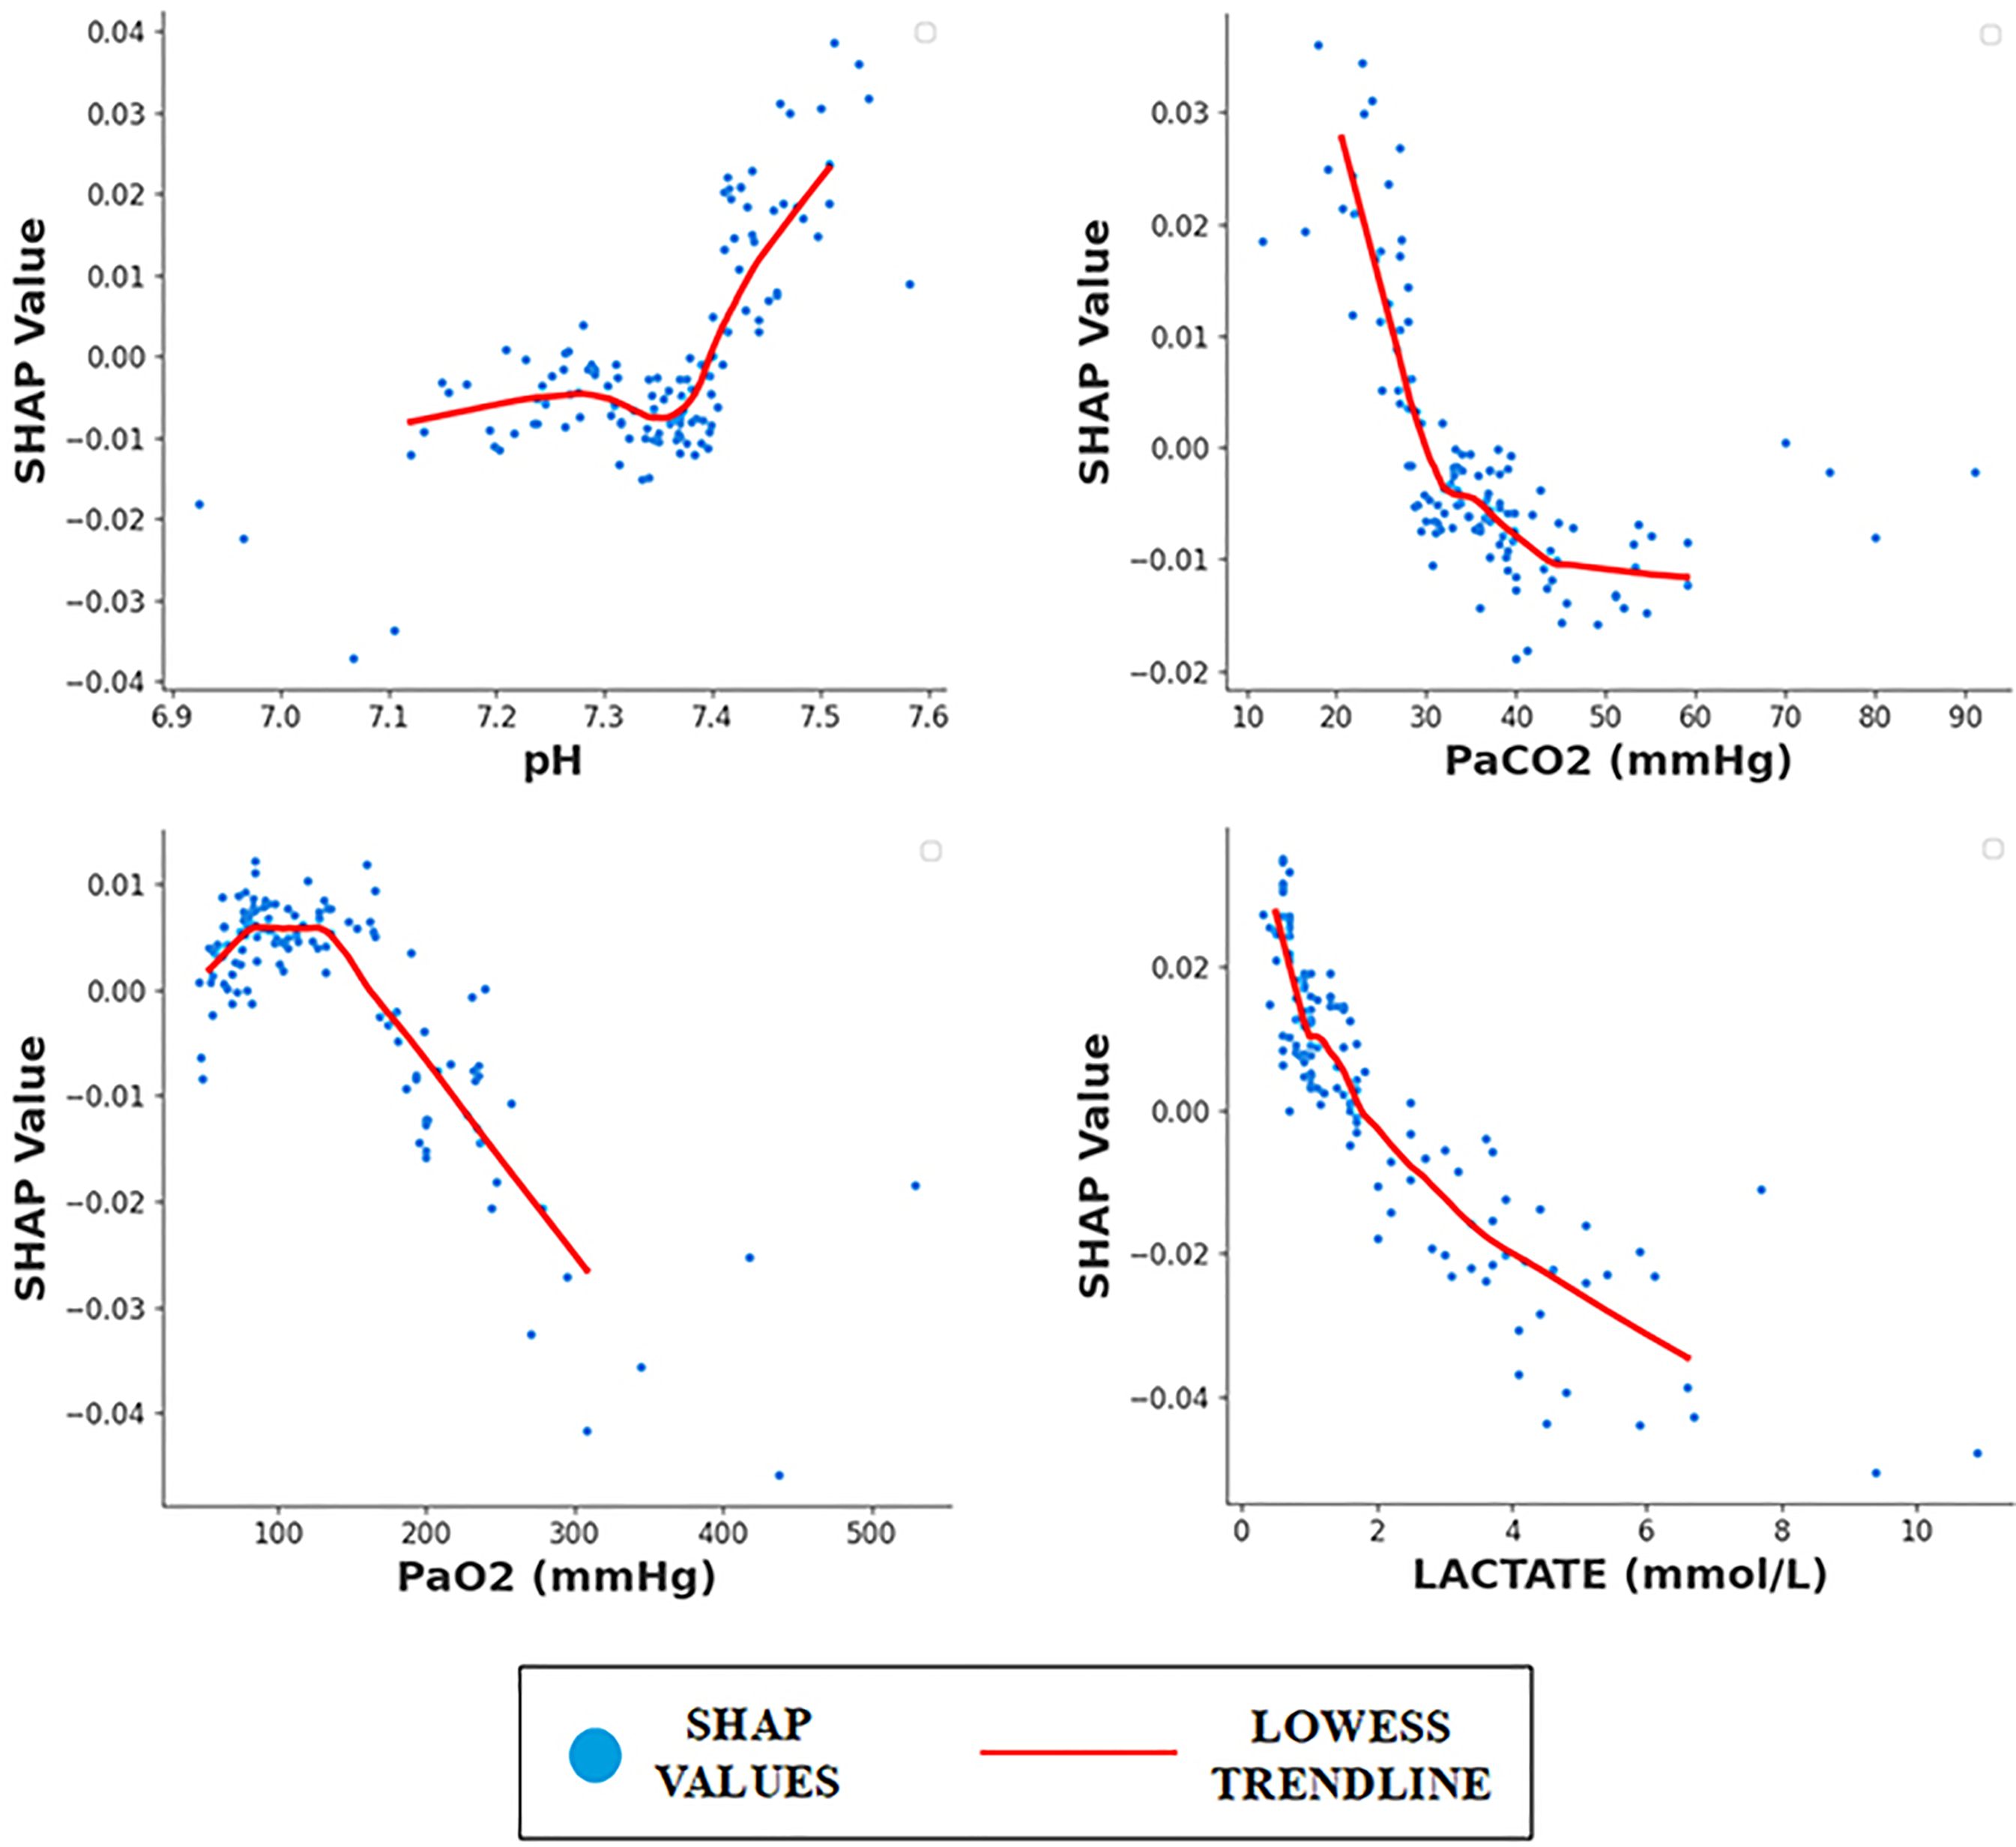
SHAP dependence plots with LOWESS trend lines for arterial blood gas markers in classification model.
Several merits of this study are noteworthy. First, the inclusion of a diverse dataset comprising patients with multiple comorbidities, along with a wide range of parameters and clinically significant composite variables, enhances diversity and supports the development of generalizable predictions. Second is estimating the mechanical ventilation duration with a clinically relevant 3-day cut-off model. The model may have limitations in predicting the exact duration of mechanical ventilation, but can serve as a useful tool for identifying mechanically ventilated patients at risk of VAP. The classification model could also be deployed in an emergency setting and a prediction of ≤3 days in a mechanically ventilated patient can prevent their transfer to ICU. Third is the higher specificity offered by the classification model that can identify patients requiring more resources and help in optimized resource allocation and making early clinical decision. Fourth, this study utilizes multiple machine learning models to address the problem and highlights that a simpler model, such as KNN, can achieve better predictive performance. The current study also explores two different approaches to evaluate the outcome duration of mechanical ventilation using separate regression and classification models. Additionally, the interpretable SHAP-based approach educates clinicians about the importance of specific features and can help in reliable and explainable AI adoption in clinical practice.
There are certain limitations associated with the study as well. The study uses limited data set, comprising of patients from a single hospital in India. The classification model may perform well in the data set collected for the study but could struggle with generalizing to different patient populations that differ in demographics, comorbidities, or hospital protocols. However, the inclusion of Indian ICU dataset in the study emphasizes the critical importance of developing models tailored to the unique challenges and characteristics of healthcare systems in low- and middle-income countries. Second, the study uses spot clinical parameters on the day of ICU admission for making predictions. Although this helps in making early estimations, the predictions may change if estimated on second or third day of ICU admission due to the change in treatment strategies. The proposed regression model has limited role in decision making regarding tracheostomy. The binary classification model, classifies all the cases requiring mechanical ventilation of >3 days as prolonged mechanical ventilation duration. This study differs from the previous studies where prolonged mechanical ventilation is estimated as >7 days or >14 days. It limits generalization of the results. We also employed a pragmatic approach to alter the misclassification cost in the classifier. While this method simplified the process by avoiding the assessment of model performance across all possible cost variations, it may have overlooked the models with potentially better performance.
Conclusion
The proposed interpretable AI model provides a comprehensive and automated solution for predicting the duration of mechanical ventilation, and may help to optimize clinical decisions and resource allocation, and transform critical care practices. Future directions for this study include external third-party validation using independent patient cohorts to further test the reliability and generalizability of the results. Although we have indirectly considered an imaging parameter of Cumulative Lung Ultrasound score, the use of direct imaging markers such as Chest X-rays or CT scans or signal markers such as ECG can add to the feature list and may lead to improvement in model performance by capturing features that may not be explicitly identified by a clinician. Duration outcomes can be heavily influenced by time-dependent factors e.g., progression of disease, treatment response over time and models capturing spot data may not fully incorporate these dynamics. There is a potential need for time-series models which could be more suited to handling time-dependent outcomes. Advancements in this area can have the potential to significantly enhance clinical decision-making and support more comprehensive diagnostic processes, ultimately improving patient care.
Supplemental Material
sj-docx-1-dhj-10.1177_20552076251352988 - Supplemental material for Predicting mechanical ventilation duration in ICU patients: A data-driven machine learning approach for clinical decision-making
Supplemental material, sj-docx-1-dhj-10.1177_20552076251352988 for Predicting mechanical ventilation duration in ICU patients: A data-driven machine learning approach for clinical decision-making by Shivi Mendiratta, Vinay Gandhi Mukkelli, Esha Baidya Kayal, Puneet Khanna and Amit Mehndiratta in DIGITAL HEALTH
Footnotes
ORCID iDs
Ethical considerations
Consent to participate
Author contributions
Funding
Declaration of conflicting interests
Consent for publication
Data availability statement
Supplemental material
References
Supplementary Material
Please find the following supplemental material available below.
For Open Access articles published under a Creative Commons License, all supplemental material carries the same license as the article it is associated with.
For non-Open Access articles published, all supplemental material carries a non-exclusive license, and permission requests for re-use of supplemental material or any part of supplemental material shall be sent directly to the copyright owner as specified in the copyright notice associated with the article.