
Abstract
Keywords
Introduction
While the beginning of the current economic liberalization policy in India could be traced to the period much earlier than the 1990s, the explicit acceptance and implementation of the economic liberalization program during mid-1991 by Indian government could be seen as the starting point of the new reform program, and its subsequent change of approach and priorities with regard to its governance. It was based on the belief that economic globalization/liberalization worked toward the integration of national economies into the international economy through trade, direct foreign investment, short-term capital flows, international flow of workers and humanity, and flow of technology. But in the process of liberalizing the economy, the state’s role has transformed in prioritizing a strong military, police and legal structures, and functions to protect private property rights and ensure proper functioning of markets. If the markets do not exist in the areas of land, water, education, health care, social security, and so on, the state must take initiative in creating a market. After creating such markets, the state should keep its activities to bare minimum without interfering with the functions of the market for it to perform efficiently (Harvey, 2005). Such thinking based on Neoliberalism 1 started occupying the minds, in a measured manner, in the policy circle worldwide during the 1970s, which led to a major shift in the political–economic practices, and started moving toward deregulation, privatization, and withdrawal of state from many areas of social security, for efficient governance, based on market economy.
Such policy transformations in India from the 1990s (officially) have not only changed the nature of state but also varied implications in the domain of education. Along with these political–economic changes, the Indian state through its Eighty-Sixth Amendment in 2002 made elementary education a fundamental right by inserting Article 21A in Indian Constitution, which says that “the state shall provide free and compulsory education to all children of the age of six to fourteen years in such manner as the state may, by law, determine” (Government of India [GOI], 2007, p. 11). The policy changes along with constitutional guarantee for education have given more scope to critically evaluate the role of state in educational governance, in fulfilling the constitutional right to education and, at the same time, strengthening the governance structures of neoliberal political economy.
This article will assess the changes in the domain of education, particularly elementary education, after the beginning of economic liberalization in India. Furthermore, the article will contrast the contemporary situation with the period before economic reforms in 1991 to understand the nuances of policy vicissitudes that engulf the governance paradigm. The research follows the methodology of critical policy analysis, to evaluate the policy changes in the domain of educational governance and its implications, in India, within the theoretical framework of neoliberalism. This article uses secondary data, collected from primary and secondary sources to understand the trajectory of policy changes.
Elementary Education in India (1947-1990)
After independence in 1947, Indian government chose not to reverse British colonial education policy, specifically with regard to elementary education. In spite of much debate on compulsory education for all, it was never made a legally binding provision in Indian Constitution, but was included in the Directive Principles of State Policy
2
in the constitution. According to Pathak (2002), the postindependence educational program was nationalist in nature with two main components: Attaching great importance to modernity, forecasting an image of industrially advanced modern state having a scientific and rational paradigm of overall development, and Focusing more on national integration overriding all local identities and regional differences and moving towards realizing our shared Indianness and strengthening the centrality of the newly emerged nation-state. (p. 95)
Thus, looking closely at all the postindependence agendas of education, such as the Radhakrishnan Commission (1949; GOI, 1962), the Kothari Commission (GOI, 1966), or the National Policy on Education (NPE, 1986; GOI, 1998), they all had science and technology on their scheme as the paramount goal of education.
The Kothari Commission (1966) was entrusted with the task of making a survey of the entire field of educational development, reviewing the country’s national development, and, finally, to advise the government on the national pattern of education on the principles and policies to be adopted for the development of education in the country. The commission felt that one of the important social objectives of education is to equalize opportunity, enabling the backward or underprivileged classes and individuals to use education as a lever for improvement of their conditions (GOI, 1966). The Kothari Commission also suggested to move toward a common school system, where everybody can access neighborhood school system without any class-, caste-, or religion-based hurdle. The Kothari Commission also recommended that if education is to develop adequately, educational expenditure in the next 20 years should rise from Rs. 12 per capita in 1965-1966 to Rs. 54 in 1985-1986. This implies that the educational expenditure, which increased from Rs. 1,144 million in 1950-1951 to Rs. 6,000 million in 1965-1966, will further rise to Rs. 40,365 million in 1985-1986 and that the proportion of gross national product (GNP) allocated to education will rise from 2.9% in 1965 to 6.0% in 1985-1986 (Bhatnagar, 1971).
Another important watershed in the postindependence educational development of India is the NPE, which was formulated in 1986 by Indian government. The NPE reiterated the issues of equality of educational opportunity and free and compulsory education for all children up to 14 years. The NPE emphasized three important aspects with regard to elementary education. They are as follows:
Universal access and enrollment,
Universal retention of children up to 14 years of age, and
A substantial improvement in quality of education to enable all children to achieve essential levels of learning.
However, the Nonformal Education (NFE) 3 was made part of this policy document for the first time. It also insisted that NFE can result in provision of education comparable in quality with formal schooling in developing the skills of children and achieve essential levels of learning. The NFE which was an alternative and parallel education model compared with formal schooling was justified, as its essential characteristics contain organizational flexibility, relevance of curriculum, diversity in learning activities to relate them to learners’ needs, and decentralization of management (GOI, 1998). NPE once again reiterated the Kothari Commission (1966) proposal of increase in public expenditure on education to 6% of the national income. In spite of various commissions and reports insisting on increased public finance for education, the government was not able to reach this target.
The number of primary schools increased from 2.15 lakhs in 1950-1951 to 5.6 lakhs in 1990-1991; the corresponding increase in upper primary schools was from 0.14 to 1.55 lakhs (Table 1). Even though, such an increase is not corresponding with the rise of population and school-going children, it did bring about a major transformation considering the level of illiteracy and schooling system at the time of independence. Also, this period witnessed a gradual increase in the educational funding, even though it was not sufficient for universal quality education.

In real terms, the public expenditure on education has increased from Rs. 114.4 crores in 1950-1951 to Rs. 15,044.2 crores in 1989-1990. But, this growth in public expenditure on education was not able to keep in tune with increase in population and number of students. The period of the 1950s was a period of rapid growth in total expenditure on education. This was also the period immediately after independence, which increased the pressure on the governing class to make India completely literate. The period of the 1960s was also a very favorable period for education, as in many developing and developed countries of the world. The global disappointment with education due to worldwide unemployment crisis during the 1970s has caused a great setback on the expenditure on education. As human resource development became an emerging area during the 1980s and education was considered to be an important component of it, expenditure on education during the 1980s was at reasonably high growth rate (Tilak, 2003).
In spite of many recommendations for increase in educational finance, the government starting with 0.64% of gross domestic product (GDP) in 1950-1951 was able to reach only 3.93% in 1990. During the 1950s, the percentage of GDP share on education hovered around 1% only. But, during the 1960s and 1970s, it has increased and stagnated around 2%. This is the period when the Kothari Commission recommended for 6% share of the national income for education. In the 1980s, it has shown improvement and reached around 3%, but compared with the increase in student population and demand for educational resources during this period, the increase was very minimal (Figure 1).

Share of education in GDP (%; 1950-1990).
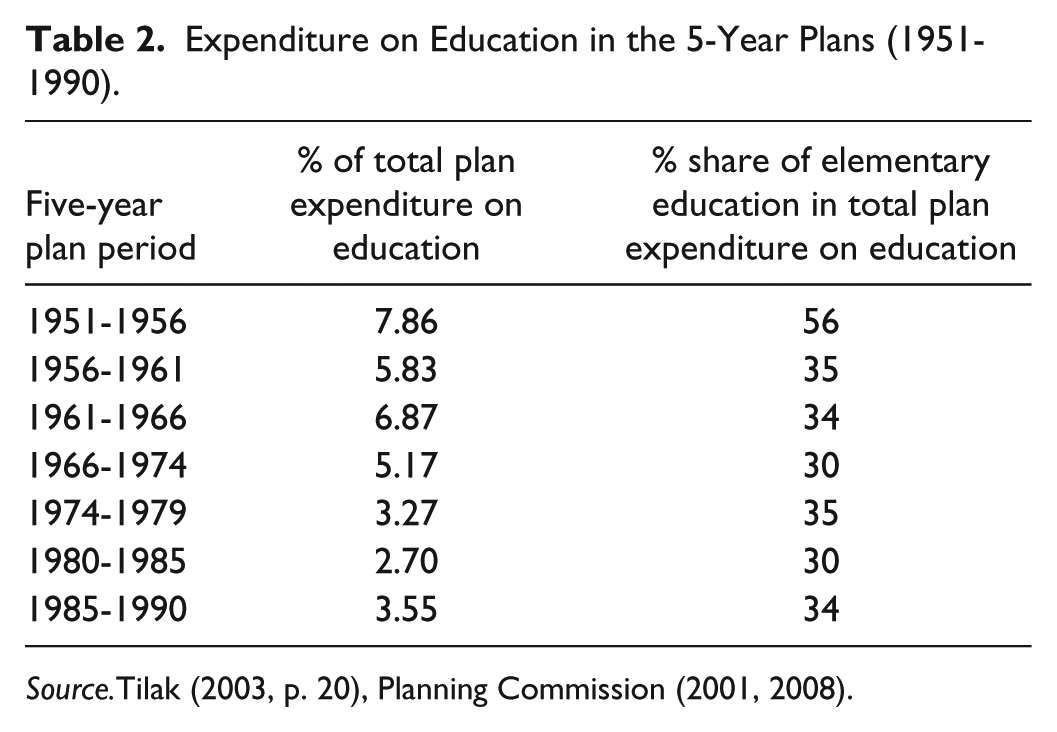
Five-year plans are an important instrument of development strategy adopted by the Indian government after independence. Expenditure on education in the 5-year plan has shown a rapid increase since the inception of the first 5-year plan. The first 5-year plan invested Rs. 153 crores on education. The expenditure rose to Rs. 8,540 crores by seventh 5-year plan. Expenditure on education was increasing rapidly during the first three planning periods at cumulative annual rate of 11.7% or 2.2 times the rate of the national income (Gounden, 1967). But when we look at the percentage of expenditure on education to the total plan expenditure, it started reducing from third 5-year plan substantially. The relative importance given to education in the 5-year plans has declined gradually over the years, from 7.9% in the first 5-year plan to 3.55% in the seventh 5-year plan. The global unemployment crisis during the 1970s has moved the state toward reduced priority for education. The expenditure started rising back in the mid-1980s but has not reached back to its previous levels (Table 2). The state played the important role in financing education during this period. Even though private players participated in the education sector, the major financial contribution came from the state (Table 3). The welfare state principles were followed giving more roles for the state in social sectors.
Expenditure on Education in the 5-Year Plans (1951-1990).
Government and Nongovernment Sector Contribution to Educational Finance (%).

Thus, after independence, there was a considerable effort from the state to improve the status of education. But these efforts failed to keep in touch with the needs of the growing population. In spite of the Kothari Commission and other committees recommending increased spending on education, the government was not able to meet its commitment for increased spending. The share of money allotted to education has increased manifold, but the share of education in GDP has not risen to meet the demands of quality universal elementary education of growing population. Even though elementary education shared a major part of resource allotted, the overall share of education in the budget does not seem to increase keeping in tune with increased demands of the population. But from the above data, we can infer a consistent effort by the state to give more shares of resources to educational development.
Economic Liberalization in 1991
After independence, India adopted a policy of “Mixed Economy,” which, within the framework of a multiparty democracy, allowed the private sector to play an important role in economic decision making and also ensured proper state intervention to accelerate growth and fair distribution due to the growth (Chandrasekhar & Ghosh, 2000, p. XI). During 1991, India openly accepted the economic liberalization program and opened up the economy for private players officially accepting the neoliberal ideology. Neoliberalism as a theoretical framework of political and economic practices put forward that human well-being can be advanced by liberating individual entrepreneurial freedoms and skills, within an institutional framework characterized by strong private property rights, free market, and free trade. Such institutional framework has to be created and sustained by the state.
The economic situation was so precarious at the beginning of the 1980s; the Indian government had to turn to the International Monetary Fund (IMF) for loans, and in response to its conditionalities, it had to initiate several deregulation measures. The neoliberal program that was adopted in 1991 had the primary task to reduce the fiscal deficit, 4 which led to the economic crisis in 1991. Thus, the important components of economic liberalization program adopted in 1991, the stabilization and structural adjustment were aimed at reducing the fiscal deficit. The government set the target of reducing the fiscal deficit from its record high of 8.3% of GDP to a targeted 3% to 4% of GDP over a period of time (Chandrasekhar & Ghosh, 2000).
The reduction of fiscal deficits is an inalienable component normally included in the conditionality of Structural Adjustment Program (SAP)
5
and consequently government expenditures have to be cut to meet the targets for reducing fiscal deficits. There are a number of studies that have pointed out the declining trend in social sector expenditures. UNICEF’s
Thus, reducing the public debt and stabilizing the economy were the main objectives of India liberalizing its economy in 1991. This path toward reducing the fiscal deficit has resulted in pruning down the expenditure in social sectors (which includes education). These measures in a longer run have affected the development and growth of social sectors by curtailing its new infrastructure and other resources.
Expenditure on Social Sectors After 1990
India’s track record on social development expenditure has been poor considering the huge inequality and poverty among its population. Dreze and Sen (1995) remarked that India’s social development indicators in 1991 (when economic reforms were launched) were lower than in several East and Southeast Asian countries. Curtailing fiscal deficit being the central component of neoliberal program, the Indian government proactively curtailed the development-oriented expenditure in social sector after the 1990s. The expenditure by General Government (Central and State combined) on social services has not increased substantially during the period after adoption of economic liberalization program in 1990.
The total expenditure by General Government has increased from 20.3% in 1990-1991 to only 24% in 2011-2012. Probing within the expenditure on social services, we find the education and health being neglected as their share on expenditure has not increased with reference to increasing population and existing backwardness. The expenditure on other social services has increased considerably from 5.4% in 1990-1991 to 8% in 2011-2012. The share of education expenditure has increased only from 10.4% in 1990-1991 to 11.4% in 2011-2012. The share of health expenditure has just moved 0.1% upward during the two-decade period (Table 4).

The state expenditure in social sector in India is a crucial domain as large population is still dependent on the state-sponsored health and education in India. In spite of the overall positive growth of economy, the above table shows a declining or stagnating trend in social sector expenditure in India. This trend is worrying as it will have a direct impact on the vulnerable groups in a longer run.
Constitutional Guarantee of Education and Its Development
In spite of various attempts made to provide free and compulsory education in India, both before and after independence, the materialization and implementation of those acts have never been a successful one. For implementing such acts successfully, allocation of appropriate funds at right time happens to be an important factor. But, the financial aspect was always being ignored by the political class, prioritizing other areas (Naik, 1982). The Acharya Ramamurti Committee (GOI, 1990) for review of NPE 1986, constituted by the Union Government, had strongly advocated that early childhood care and education of the children in the 0 to 6 age group must be made a fundamental right. A rough estimate of the financial requirement for this purpose was also given for the first time in the country (Ramamurti, 1990). The government, shortly after announcing its New Economic Policy in July 1991, set up yet another committee called the Janardhana
Reddy Committee under the auspices of Central Advisory Board of Education (CABE), to look into the feasibility of implementing the Acharya Ramamurti Committee Report. But the CABE Committee Report (GOI, 1992) rejected the recommendation to make early childhood care and education a fundamental right for the 0 to 6 age group.
In Mohini Jain case in 1992, the Supreme Court observed that the directive principles cannot be isolated from the fundamental rights guaranteed under Part III of the Constitution. The two are supplementary to each other, and the state is under constitutional mandate to create conditions, in which all could enjoy the fundamental rights guaranteed to individuals, under Part III of the Constitution. It further opined that, without making right to education under Article 41 of the Constitution a reality, the fundamental rights under Chapter III shall remain beyond the reach of the large majority, which is illiterate (Godbole, 2001). Furthermore, the Supreme Court of India in its landmark judgment in
An amendment to the Constitution making the right to free elementary education up to 14 years of age a fundamental right. The provision of free elementary education, according to the committee, includes exemption from tuition fee, provision of free textbooks for all primary school children and girls up to upper primary level, and provision of essential stationery to all children in primary classes.
The committee recommended that the mid-day meal program be continued, and provision of other incentives such as free school uniforms, cash incentives, scholarships, and so on, could be left to the discretion of the states subject to “economic capacities and priorities” of the respective state governments.
It has also recommended the provision of minimum infrastructure and teachers to all schools as envisaged under the Operation Blackboard Program.
Nevertheless, the committee’s recommendations did not propose for a central legislation making elementary education “compulsory,” but it suggested that the states could either amend existing laws or enact fresh legislation in this regard. But the committee did suggest that the governments should be required to provide accessible schooling facilities to all, and parents should treat it as their fundamental duty to send their children to schools. Following this report, the GOI introduced the Eighty-Third Constitutional Amendment Bill in Parliament in 1997 to make the right to education for all children from 6 to 14 years of age a fundamental right.
After 8 years of the Eighty-Sixth Amendment to Indian Constitution, the Right of Children to Free and Compulsory Education Act or Right to Education Act (RTE) was passed by the Indian Parliament on August 4, 2009. According to the GOI, this act serves as a building block to ensure that every child has his or her right (as an entitlement) to get a quality elementary education, and that the state, with the help of families and communities, fulfills this obligation. This act demands the private educational institutions to reserve 25% seats for children from the weaker sections of society. The Center and the States have agreed to share the financial burden in the ratio of 55:45. The Center has approved an outlay of Rs. 19,000 crores in 2010-2011. The school management committee or the local authority will identify the dropouts or out-of-school children aged above 6 and admit them in classes appropriate to their age after giving special training.
Thus, the state has not achieved its target set in Article 45 of the Indian Constitution and has also not implemented various recommendations by various committees from the time of independence to provide quality universal education. But education being enshrined in constitution as a fundamental right recently, the state has more responsibility in providing adequate resources to fulfill this right.
Educational Finance After 1991
In spite of India’s commitment toward “Education of All” being an important national goal from the time of independence, the realization of this goal has always been a distant target. India intermittently reaffirmed the Kothari Commission (1968) suggestion that we should spend at least 6% of our GDP on education, without any concrete action plan toward achieving that goal. It made a commitment to provide adequate funds to achieve “Education for All” by 2000 at the World Summit on Education at Jomtien in 1990. And again in 1992, the resolve was repeated at the Nine Country Summit on Education at New Delhi. In 2000, the General Assembly of the United Nations adopted eight Millennium Development Goals (MDGs), which include achieving the universal primary education—“to ensure that, by 2015, children everywhere, boys and girls alike, will be able to complete a full course of primary schooling” (United Nations, 2000).
The period of the 1990s, after the initiation of economic liberalization program, posed a severe financial crisis for the states in India as the transfer of funds from the union government underwent a structural change during this period. The social sector expenditure has always been a soft target under such crisis. The fiscal policies of the union government have forced many states to reconsider their priorities in spending and forced them toward decreasing their social sector expenditures after 1990 (Jha et al., 2008; 146). The main reason attributed for the increase in union government’s expenditure on elementary education during the 1990s was the sanctioned and institutionalized external borrowing after the government started adopting the policy of economic liberalization in 1991.
The projects that were undertaken from external borrowing mainly during the 1990s, with a small beginning in mid-1980s, focused their attention on various subsectors of elementary education such as access and retention of disadvantaged groups, improving the teaching–learning processes, textbook and curriculum reforms, and so on. However, the regional spread of projects that were externally funded was skewed in favor of educationally developed states, ignoring the educationally poor states such as Bihar (Bashir, 2000). The education department takes the lead role in education expenditure, but other departments do spent a substantial amount for educational infrastructure and other developments. Out of the total budget expenditure on education, the expenditure on the revenue account 6 is very high compared with the expenditure on capital account. 7
The share of expenditure on GDP is one of the important indicators showing the priority of government in showing considerable improvement in educational development of its population. On the recommendation of Education Commission (GOI, 1966), the GOI quantitatively fixed a target of investing 6% of the national income in education. But looking at the expenditures on education over the years, in spite of big improvement from 0.64% of GDP in 1950-1951 to 3.93% of GDP in 1989-1990, the trend did not continue positively after 1990. By 2010-2011, we are still hovering around 4% of GDP only (Figure 2). According to Human Development Report 2001, India ranked 104th in share of public expenditure in national income, among the 143 countries for which such data are available. There are a large number of countries that spend more than 8% of national income on education. Some of the countries, which are poorer than India, spend more than 4% of national income on education.

Share of education on GDP (%; 1990-2011).
There are still more than 8 million children who have never entered or dropped out of school for various reasons according to the GOI (Table 5). The rapid privatization and slowly reducing government-funded education are some of the important reasons for huge number of the poor being left out of the educational participation in India. After 2000 only, there was a conscious effort on the part of the state to increase the educational finance in 5-year plans (Table 6). These measures have been carried depending on the external funding sources in the domain of education. But this demands more increase in educational funding to compensate the reduced spending all these years.
Out-of-School Children.

Expenditure on Education in the 5-Year Plans (From 1990).

To assess the financial requirements for operationalizing the proposed constitutional guarantee of free and compulsory education, the GOI constituted the Tapas Majumdar Committee in 1997, which submitted its report in January 1999. This report estimated the financial requirements, in addition to the prevailing public expenditure on elementary education, over a 10-year period (from 1998-1999 to 2007-2008) for universalizing elementary education in the country by 2007-2008. The Committee estimated an additional investment of Rs. 1,37,600 crores to be made over a 10-year period to bring all out-of-school children into the regular schooling system and enable them to complete the elementary stage of education (Table 7). This requires an average investment of Rs. 14,000 crores a year. Conversely, the Financial Memorandum to the Constitution (Ninety-Third) Amendment Bill, 2001, estimated a sum of Rs. 98,000 crores over a 10-year period to implement the fundamental right to education for children in the age group of 6 to 14 years. This amount is 30% less than the amount estimated by the Tapas Majumdar Committee (Sadgopal, 2003).
Additional Financial Requirement for Universal Elementary Education by 2007-2008—Estimated by the Tapas Majumdar Committee, 1999 (2008 prices; in Rs. Crores).

According to the Tapas Majumdar Committee recommendation, an additional amount of Rs. 2,04,342.7 crores is required by the year 2008 in addition to the allotted resource by the government to achieve the goal of universal elementary education. But the real allocation by the governments has been far less from the recommendations of the Tapas Majumdar Committee. Some of the other major recommendations of the Tapas Majumdar Committee are as follows:
Universal participation of children in the age group of 6 to 14 years in school education.
Student–teacher ratio of 30:1 at elementary level.
Two teachers in primary school and three teachers and a headmaster in upper primary school.
Two classrooms in primary school and three classrooms in upper primary schools.
Creation of maintenance fund through community participation.
Free uniforms, mid-day meals, and scholarship for all the children coming from the below poverty line families.
In spite of various lucid recommendations of the Tapas Majumdar Committee on the financial allocation to achieve universal elementary education, the government has till now not crossed 4% of GNP for education.
The B. G. Kher Committee in 1948 observed with regard to pupil–teacher ratio (PTR) that 1:30 will be the ideal one and the state should endeavor to achieve this as a soon as possible. The Tapas Majumdar Committee in 1999 again insisted on maintaining a PTR of 1:30 both at primary and upper primary levels. In spite of the insistence by various committees regarding the PTR, the Sarva Siksha Abhiyan (SSA) 8 norms specify it at 1:40 at both primary and upper primary levels.
Eligibility, qualification, and salary of teachers play a very important role in providing quality elementary education for all as envisaged by the constitutional amendment for right to education for all. After a long drawn debate on the desired qualification of teachers, it was agreed consensually that the teacher at elementary stage should necessarily possess at least 12 years of education followed by 2 years of professional training in pedagogy (Govinda & Josephine, 2004). The Tapas Majumdar Committee in 1999 also insisted on recruiting professionally qualified and trained teachers instead of undertrained/underqualified contract or Para teachers in the primary and upper primary stages of schooling. It further recommended giving Rs. 5,000 per month for primary school teachers and Rs. 6,000 per month for upper primary school teachers as salary. But SSA provides wide scope for recruitment of Para teachers or teachers on contract basis on short-term basis and at very low salaries. As SSA norms authorize the state government regarding salary and qualification of teachers, there has been large scale recruitment of Para teachers at lower salaries (Tilak, 2004). Also the union governments support for the salary of teachers recruited under SSA has been declining over the years considerably. It was 85% during 9th plan, 75% during 10th plan, and 50% during the eleventh 5-year plan. According to Govinda (2005), the consequences of such a drastic cut in the finances of SSA first hides the real magnitude of the problem to be addressed in the long run, in financial terms; second, distorts the shape of the budget by projecting teacher salary, which should in the normal course be part of the recurring expenditure, unlikely to be absorbed as non-plan component as they are on contract basis; and third, this places the evolution and strengthening of a professional community of teachers in a serious jeopardy. (p. 11)
But this trend of recruitment has gained a global acceptance under the neoliberal ideology, as the Education for All (EFA) Global Monitoring Report (2005) points out that a number of African and South Asian countries have appointed Para teachers at lower salaries instead of regular, qualified teachers at primary and upper primary levels (UNESCO, 2004, Chapter 4). It further states, “the long term sustainability of the policy of maintaining two groups of teachers with blatantly unequal status is questionable. Senegalese experience suggests that the eventual absorption of Para teachers within regular government service may be difficult to avoid” (UNESCO, 2004, p. 167).
The PTR has increased from 24 in 1950-1951 to 43 in 2010-2011 at primary level. The ratio has also increased at upper primary level (Figure 3). This indicated the underrecruitment of teachers in pace with increasing population. The dwindling education expenditure by the State and the Center toward the formal schooling is the reason for such an increase in teacher–student ratio at primary and upper primary levels. Thus, the provisions of SSA, with regard to teachers’ qualification, student–teacher ratio, and financial obligation to meet the needs of quality education, contravened the recommendations and suggestions by various committees, following the path of neoliberalism. The SSA has promised that “every child will be in school by January 2003,” but in reality, more than 35 million children are out of school. Furthermore, a probe by

Pupil–teacher ratio (PTR), 1950-1951 to 2010-2011.
Education Market and Private Schooling
The onset of economic liberalization has politically extended the scope of markets even in the fields such as education and health to a larger extent. The neoliberal ideology insists that the invisible hand of the market will inexorably lead to better schools and quality education. “The market” acts as a metaphor rather than an explicit guide for action. They are considered to be natural and neutral, and governed by effort and merit. And those who are opposing them are also opposing effort and merit. Markets are insulated from political interference and bureaucratic procedures. As the markets are grounded in the rational choices of individual actors, they along with the guarantee of rewards for effort and merit produce neutral and positive results (Mentor, Muschamp, Nicholls, Ozga, & Pollard, 1997). But on the other side of the argument, scholars observe that the educational principles and values are compromised, when the commercial issues become important in curriculum design and resource allocation. The private and profit-oriented schools are increasingly looking for ways to attract “motivated” parents with “able” children. Thus, they will enhance their academic competitive position among the local schools. This indicates a subtle shift from working to fulfill the students’ academic needs to aggressively move toward student performance. Thus, the schools will start shifting their resources more toward marketing and public relations away from the students’ real needs (Ball, Bowe, & Gewirtz, 1994).
The neoliberal ideology, which bases its roots on classical liberalism, differs from it in some crucial aspects. These differences are absolutely vital in understanding the politics of education and the transformations education is currently undergoing. Mark Olssen (1996) elucidated that the classical liberalism represents a negative conception of state power in which the individual is an object to be freed from the interventions of the state, but neoliberalism is to be understood in a positive conception of the state’s role in creating the appropriate market by providing the conditions, laws, and institutions necessary for its operation. In classical liberalism, the individual is characterized as having an autonomous human nature and can practice freedom. In neoliberalism, the state seeks to create an individual who is an enterprising and competitive entrepreneur.
In a marketized society, the rich parents have more flexible hours and can visit multiple schools to get admission for their children. They have modern transport facilities to drive their children to far off “better” schools. They can as well provide the hidden cultural resources such as camps and after-school programs to learn dance, music, computer classes, and so on, which give their children a set of cultural resources. Thus, more affluent parents are more likely to have the informal knowledge and skill—what Bourdieu (1984) would call the habitus, through which they will be able to use marketized forms to their own benefit. The match between the historically grounded habitus expected in schools and in its actors and those of more affluent parents, combined with the material resources available to more affluent parents, usually leads to a successful conversion of economic and social capital into cultural capital (Bourdieu, 1996).
As far as India is concerned, after the economic liberalization and its consequent external borrowings from World Bank and other international donors, there is a consistent underhand pressure on the state to constrict its financial expenditures and create a favorable environment for reducing the fiscal deficit. Health and education were not spared from this. The reduced funding for government-aided education automatically leads to deterioration in quality, which indirectly promotes the mushrooming of private schools to satisfy the disgruntled parents. The private sector has expanded in states of India that have inefficient government schooling system. The private schooling is considered not favorable for girls and gender-biased. The lower caste students, who have much lower enrollment rates than upper caste students, are less likely to be enrolled in fee-paying private schools (Tilak & Sudarshan, 2000). In spite of that, demand for private schools is on the rise, as they offer English as a subject for its students.
The UNICEF survey comparing the facilities, both in terms of physical infrastructure and human resources, between government and private schools concluded that private unaided schools account for a major share of enrolled children in the states of Uttar Pradesh, Bihar, and Rajasthan. More number of urban unaided schools have
There has been steady increase in the private unaided primary schools from the 1980s, but after 1990, we can see quick progress in private schools and a slow decline of government primary schools. Even though the local body schools do not show any decline, the government schools show a sharp decline of around 8% from the 1970s. The private unaided schools have increased substantially and reached 7.1% in 2010-2011 from 2.57% in 1986-1987 (Table 8). The increase in private unaided schools could be attributed to some extent to the decreasing expenditure on education by the Center and States together. It is also due to reprioritization of government expenditure more toward nonformal learning than toward investing in strengthening formal schooling in India.
Percentage of Primary Schools Under Different Managements 1973-1974 to 2010-2011.

The role of private unaided schools in upper primary level shows a sharper increasing trend than the primary schools. The private unaided schools have increased from 8.58% in 1986-1987 to around 17% in 2011-2012. The same period shows a decrease in government schools from 75.12% in 1986-1987 to 70.5% in 2011-2012 (Table 9). The reasons could be the same policy changes attributed to privatization of primary schools as seen above.
Percentage of Upper Primary Schools Under Different Managements, 1973-1974 to 2011-2012.

The growth of private schooling could be the reason why, despite declining per capita public education expenditure in several Indian states, and falling share of basic education expenditure in state domestic product, these states have shown improved educational outcome indicators in the 1990s (Kingdon, 2007). According to Pratham’s (2006) survey, private school students of Grades 2 to 5 were 37.4% more likely than government school students to be able to read a text of Grade 2 standard. They were also 50% more likely to be able to solve a division problem (3 digits divided by 1 digit). Thus, according to various studies, the private school students generally outperform their public school counterparts in learning achievement.
Although the state-funded education system still dominates the elementary schools in India, the significant growth of private schools after 1990 has been an important phenomenon (Muralidharan & Kremer, 2006). The privatization of elementary schools could be ascribed to household socioeconomic condition, poorer infrastructural facilities at neighborhood and at government schools. Thus, the government’s reduced priority toward providing sufficient resources to elementary education has indirectly increased the privatization of schools at elementary level.
Even though government reports show an increasing trend in educational infrastructure facilities, still a major section of the school-going children are denied basic infrastructure facilities. According to the National University of Educational Planning and Administration (NUEPA; 2014), around 40% of schools do not have girl’s toilet, and around 72% of schools do not have computer facilities (Table 10). The above data show a need for more funding from the state to fulfill the basic infrastructure facilities. According to Dhar (2012), almost 95% of schools do not have the basic infrastructure facilities as stipulated by RTE. The dwindling finances in the time of neoliberalism, and the rapid privatization at every level of education, give weak hope for fulfilling the educational needs of poorer socioeconomic groups in a long run.
Infrastructure in Elementary Schools.

The Road Ahead
The economic crisis during the 1980s has pushed many developing and underdeveloped countries to pursue the path of economic liberalization. Even though India slowly started liberalizing its economy before the 1990s, it officially took the path of economic liberalization in 1991. One of the prime objectives of neoliberal policies being the reduction of spiraling fiscal deficit, the state started reducing its expenditure to control it. When it comes to curtailing expenditure, the public goods being the soft target received an immediate attention. Education and health being public goods started showing a negative growth trend, as an impact of economic liberalization policies after the 1990s, as their expenditure started to stagnate/decline visibly.
The economic liberalization policy being adopted by the Indian Government from the 1990s has brought in various political and structural changes in the domain of elementary education. It can be clearly gleaned from the allocation of financial resources to education that the priority accorded has been declining or stagnating under liberal economic policy regime. This clearly shows the reducing priority of public expenditure in education sector, in spite of various commissions prescribing 6% share of GDP for education to universalize quality education.
The CABE Committee’s report on Free and Compulsory Education Bill 2005 has recommended that even if the public spending on education was raised to 6% by 2006-2007, and half of it was earmarked for elementary education alone, further allotment of around 1% was needed in excess for elementary education alone. The additional financial implications for the 6-year period 2006-2012 amount to an average of Rs. 72,678 crores per annum or about 1.5% of GDP (Jha et al., 2008). Such an increased amount of spending as envisaged by various committees is important not only for universalizing the elementary education but also for strengthening the government schooling system, which has deteriorated over a period of time due to lack of sufficient financial support.
Since independence, the successive governments have not shown interest to make the necessary investments in education sector. Instead of reaching the level of investment of 6% of GDP by 1986, as advocated by the Kothari Commission, the state was spending only around 4% of GDP till now. Within this, only half of the investment goes to the elementary education sector, the remaining being for secondary, higher, and technical sectors of education and some other special schemes. This has resulted in ever-widening cumulative gap of investment in education implying lesser school infrastructure facilities. The recommendations of the Tapas Majumdar Committee were for an additional investment in the elementary education sector for the next 10 years to fill up this cumulative gap. The norms under SSA have been in contravention with various norms being recommended by committees for providing quality elementary education for all. This clearly shows the lack of commitment on the part of government to provide quality education to all.
The recent constitutional changes and the resulting “The Right of Children to Free and Compulsory Education Act or Right to Education Act (RTE), 2009,” have intensified the demand for allocating more resources toward fulfilling the fundamental right of providing universal quality education. But the policy of economic liberalization and external borrowing of funding with conditionalities attached to it has constricted the government spending on education sector to a large extent. This reduction of government expenditure has resulted in mushrooming of private elementary schools in large numbers. According to Ramakumar (2008), The fiscal crisis of the Centre adversely affected the transfer of statutory funds to the States; the transfers from the Centre to the States declined in the 1990s. In addition, the deregulation of interest rates after 1991 led to a sharp rise in the interest rates that States had to pay, which led to a sharp rise in the debt burden of States. In sum, the finances of the States also entered into a period of crisis. (p. 78)
The above data show the slow withdrawal of state in providing quality elementary education for poorer socioeconomic groups in India after the implementation of neoliberal economic policies. The reduced or stagnating public expenditure is reflected in the school infrastructure and other facilities provided in government schools. The decrease in government elementary schools and subsequent increase in private elementary schools after the 1990s once again reaffirm the state’s commitment toward neoliberal political economy in creating an appropriate market for the private players in the domain of education. The state’s positive intervention role before the implementation of neoliberalism has taken a backseat, which is reflected in the state’s financial commitment toward educational development in India. Thus, the economic liberalization policy has not benefited all sections of the society in getting quality education from the state. The contemporary neoliberal political economy further creates a wider gap and inequality among the citizens, which needs further inquiry.