
Abstract
Introduction
In today’s educational paradigms, the individual’s creative thinking, problem identification and solving skills, and the ability to develop original ideas and present them effectively have become increasingly important. For this reason in recent years, project-based learning (PBL) has emerged as a widely adopted pedagogical approach aimed at fostering students’ critical thinking, creativity, and real-world problem-solving skills through active and inquiry-based learning processes (Markula & Aksela, 2022). This method provides students with the opportunity to address and solve real-world problems, allowing them to put scientific research methods into practice. One of the main features of the projects is that students identify a specific problem, examine this problem from various angles, develop different solutions, evaluate these solutions, choose the most appropriate one, and ultimately produce an original product (Aguilar Velasco & Wald, 2022). This study focuses on three interrelated but distinct concepts: project, project work, and project consultancy. A project refers to a structured student-driven inquiry designed to address a real-life issue. Project work encompasses the pedagogical and procedural aspects of conducting such tasks. Project consultancy, meanwhile, refers specifically to the role of the teacher as an academic mentor who facilitates and guides students throughout the process without directly taking over the learning task. This role includes activities such as providing feedback, helping students clarify objectives, and supporting critical reflection (Oh et al., 2019). The project is a comprehensive educational process that enables students, under the supervision of teachers, to address a problem determined by their abilities and interests individually or in groups, and to develop solution suggestions by investigating this problem in depth (Galkin, et al., 2021). This process encourages students to acquire knowledge in the relevant field, critically interpret existing knowledge, and produce innovative ideas. One of the most critical factors that determine the success of projects is the active participation of the teacher who serves as a consultant in the solution development process (Oh et al., 2019). When preparing projects, the teacher’s role is shaped by directing students’ work, making suggestions, and guiding them throughout the process (Rushton & Reiss, 2019). In this process, the teacher should act as a mentor who supports the students. Rather than directly conveying information, the teacher is expected to provide support to students by guiding the process, asking open-ended questions, and encouraging reflective discussions. One of the important obstacles that teachers face in the project preparation process is that teachers do not have sufficient skills and experience in project management and implementation (Anisimova & Ibatullin, 2018). Although a large body of research has explored the benefits of project-based learning for students, less attention has been given to the teacher’s role in this process particularly as a project consultant (Condlife et al., 2017). Many educators encounter challenges in fulfilling this role effectively due to limited project experience, institutional support, or confidence in project management. The lack of a specialized, validated tool to assess this role limits the ability of schools and policymakers to identify teachers’ training needs and readiness for mentorship-based teaching models. In contexts where science fairs, STEM competitions, and project-based curricula are increasingly emphasized, the absence of such a tool presents a major barrier to effective implementation.
This study draws on Bandura’s (1986)
Ajzen (1991) model emphasizes that behavioral intention is driven by attitudes, subjective norms, and perceived behavioral control. Applied to the context of education, this framework suggests that positive attitudes toward project consultancy, combined with institutional support and confidence in one’s ability, increase the likelihood that teachers will embrace this role. However, existing research has not leveraged these frameworks to develop specialized measurement instruments for project consultancy roles in educational settings. While previous studies have evaluated general teacher beliefs about PBL or instructional innovation (Rushton & Reiss, 2019), few have focused specifically on teachers’ attitudes toward project consultancy. A lack of positive attitude or willingness to engage in consultancy tasks can significantly impair the effectiveness of PBL. Studies have found that insufficient teacher involvement in project supervision negatively affects students’ ability to formulate research questions, apply scientific methodology, and reflect on outcomes (Galkin et al., 2021). Furthermore, teacher disengagement has been linked to reduced student motivation and lower project quality (Barron & Darling-Hammond, 2008). The absence of structured consultancy leads to superficial or poorly managed projects, undermining the intended learning outcomes. Thus, it is essential to understand and support teachers’ attitudes toward consultancy to ensure high-impact learning experiences. This gap in the literature is critical, as current instruments fail to capture the unique tasks associated with project guidance—such as defining researchable questions, evaluating progress, and facilitating critical discussions. Furthermore, there is a noticeable lack of validated instruments to measure teachers’ attitudes toward project consultancy. Most existing tools assess general teaching strategies or beliefs about PBL but do not focus specifically on the consultancy dimension (Rushton & Reiss, 2019).The current study seeks to fill this gap by developing and validating the Project Consultancy Attitude Scale (PCAS). This scale is intended to offer educators, researchers, and policymakers a psychometrically sound instrument to assess teachers’ attitudes toward their consultancy roles in student project work. Such a tool can be used to identify professional development needs, inform teacher training programs, and evaluate the readiness of educators to support student research activities effectively. Project consultancy demands a blend of pedagogical knowledge, project management skills, and interpersonal communication. Understanding teachers’ attitudes toward this multifaceted role is therefore critical. In addition, demographic variables such as gender may play a role in shaping teachers’ perceptions and engagement in project consultancy, though this dimension remains underexplored in the literature (Huang et al., 2016; Steegh et al., 2019). By investigating these dynamics, this study aims to contribute to a more nuanced understanding of how teachers approach project mentorship.
Method
This study utilized an exploratory sequential mixed methods design (Creswell & ve Plano Clark, 2007), which was selected for its strength in building a psychometric instrument grounded in real-world experience. This study employed an exploratory sequential mixed-methods design (Creswell & ve Plano Clark, 2007), selected for its strength in building a psychometric instrument grounded in participants’ lived experiences. The decision to prioritize qualitative inquiry before quantitative validation was based on the absence of existing instruments specifically assessing teachers’ attitudes toward project consultancy. A purely quantitative approach would not have allowed for sufficient theoretical and contextual depth. This design enabled a theory-informed, context-sensitive instrument that reflected teachers’ nuanced realities, aligning with mixed methods research standards outlined by Ivankova et al. (2006). The design began with a qualitative exploration of teachers’ perspectives on project consultancy, which informed the construction of scale items. The scale was then tested and validated through quantitative analyses. This approach was considered more appropriate than a purely quantitative design, as no existing scale comprehensively captured teachers’ attitudes toward project consultancy. Sequentially connecting the qualitative and quantitative phases allowed for a more theory-informed and context-sensitive instrument (Ivankova et al., 2006).
Qualitative Dimension of the Research
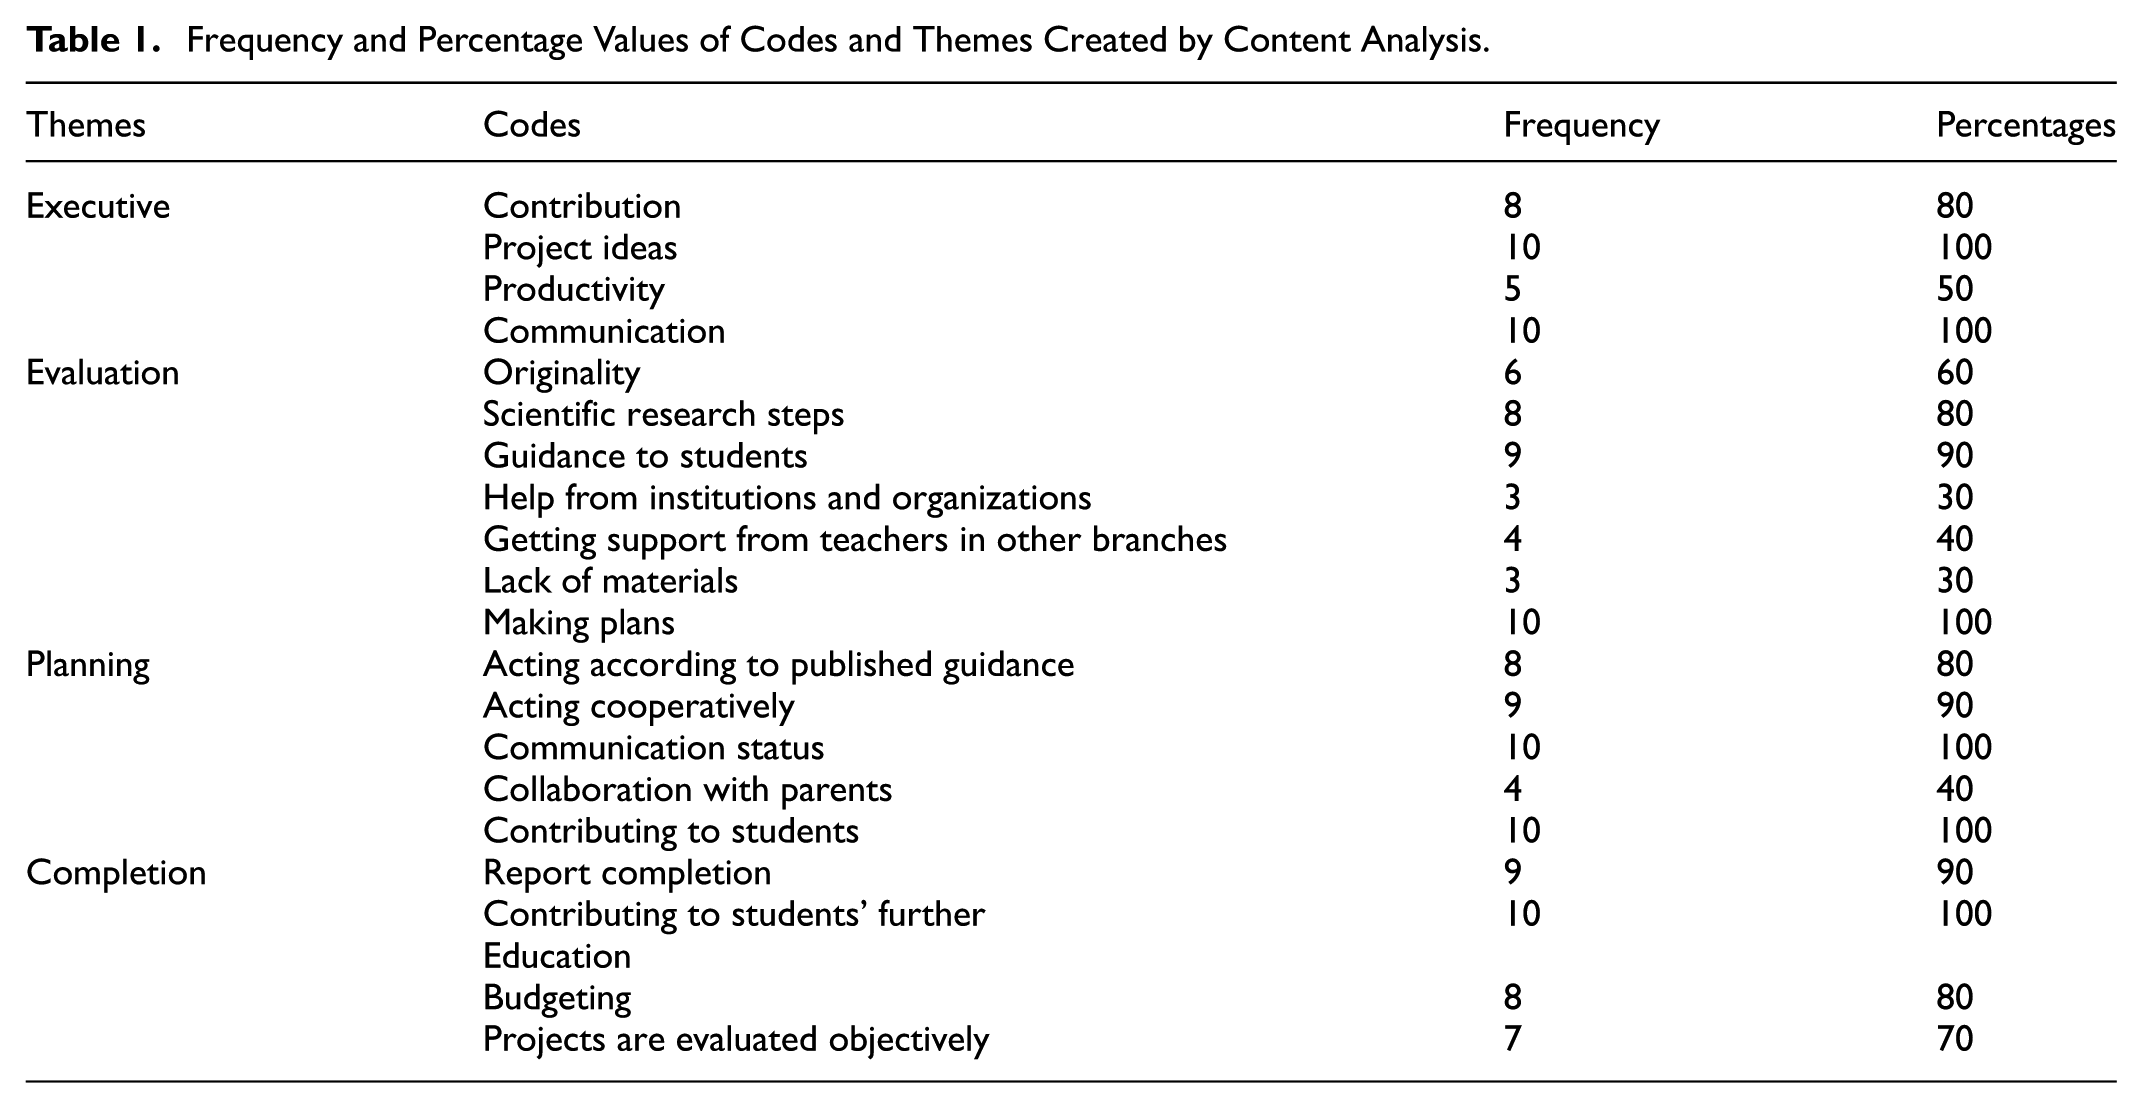
The qualitative phase involved 10 teachers selected using maximum variation sampling (Patton, 2002) to ensure diversity in terms of school level (primary, secondary, high school), teaching experience (ranging from 1 to 20+ years), and subject areas (science, mathematics, social studies). This heterogeneity enhanced the potential for capturing a wide spectrum of experiences related to project consultancy. This part of the research is a qualitative research with the aim of understanding in depth the attitudes of teachers toward project consultancy and the factors affecting these attitudes. In this context, the “phenomenology” design, which is one of the qualitative research designs, was preferred. Phenomenological design is a method used to examine how individuals experience a particular phenomenon and the meanings they attribute to these experiences (Creswell & Poth, 2016). All necessary institutional permissions were also secured from relevant authorities. The study design posed no physical or psychological risk to participants, and participation was entirely voluntary. To protect participants’ rights, no personal or identifiable data were collected. Confidentiality and data security were maintained in accordance with national regulations and institutional ethical guidelines. The potential societal and scientific benefits of the research are considered to outweigh any minimal risks involved. All participants were fully informed about the purpose, procedures, and use of the data, and written informed consent was obtained prior to participation. In this study, the phenomenological design was chosen to reveal how teachers perceive the phenomenon of project consultancy and the attitudes they develop depending on the experiences they encounter in this process. In this context, research is to focus on the inner worlds of teachers regarding project consultancy, how they perceive this phenomenon and what influences these perceptions, and to systematically reveal these elements. The interviews, lasting 30–60 min, aimed to elicit in-depth reflections on the concept of project consultancy and factors shaping teacher attitudes toward this role. The collected qualitative data were analyzed using the content analysis method (Miles et al., 2014). Codes and themes were generated inductively and iteratively by two researchers to enhance analytical trustworthiness. The classifications were calculated using Miles (1994) formula (Reliability = consensus/consensus + disagreement). In qualitative studies, it is assumed that the desired level of reliability will be achieved when the agreement between expert and researcher evaluations is 90% and above. In this study, as a result of the calculations, a consensus of 93% was found. Four main thematic categories planning, execution, evaluation, and completion were extracted from the data. These themes provided the conceptual foundation for the item pool used in the next phase. While some categories (e.g., execution) yielded more codes than others (e.g., completion), this uneven distribution reflected participants’ actual emphasis during interviews rather than researcher bias.
Quantitative Validation
In the second phase, the draft scale items derived from the qualitative findings were administered to a larger, statistically representative sample of 382 teachers. In the study, maximum variation sampling, one of the purposeful sampling methods, was used to determine the most appropriate sample for the purpose of the research during the quantitative data collection phase. This method aims to increase the richness and scope of research findings by including individuals with different experiences, perspectives, and demographic characteristics in the scope of the research (Creswell & Plano Clark, 2018). Criteria included at least 1 year of project consultancy experience and willingness to reflect on project-based mentorship. The sample was drawn using convenience sampling from various school types and geographic locations in a country, meeting the recommended sample size for exploratory factor analysis (EFA; Hair et al., 2010). A separate sample of 194 teachers was then recruited for confirmatory factor analysis (CFA) to test the construct validity of the scale using an independent group (Brown, 2015). Statistical analyses included EFA to determine the underlying factor structure, CFA to confirm the structure, and reliability tests such as Cronbach’s alpha and test–retest correlation. An independent samples
Data Collection Tool
To gain an in-depth understanding of teachers’ attitudes toward project consultancy and the factors influencing these attitudes, a semi-structured interview method was employed. This approach enables the researcher to guide the discussion around key themes while also allowing participants to freely articulate their perspectives and experiences (Patton, 2002). The interview protocol was developed based on a comprehensive review of both national and international literature on project consultancy in education. Relevant theoretical frameworks and previous empirical findings informed the formulation of the questions. The draft interview form was reviewed for methodological and content validity by three faculty members with expertise in qualitative research and educational sciences. Revisions were made based on their suggestions, and the form was finalized accordingly. The final version of the interview form included three main questions, each supplemented by three probing sub-questions to encourage elaboration and depth. The interview questions (e.g., “Can you describe a challenge you faced while mentoring a student project?”) were based on the literature on teacher agency and mentorship (Goddard et al, 2001) and were informed by Ajzen (1991)
Data Analysis and Findings
The data obtained from the interviews conducted to evaluate the teachers’ attitudes toward project consultancy were evaluated using the content analysis method. Content analysis is a analysis technique that enables the systematic examination of qualitative data and the extraction of meaningful themes and codes from these data (Seidman, 2006). The analysis process began with the transcription of the interview records into computer media. Qualitative data were analyzed using inductive content analysis in MAXQDA. Inter-coder reliability was established using Miles and Huberman’’s formula, reaching 93% agreement, indicating high consistency in theme identification. After the transcription process was completed, the data coding phase began. During the coding process, meaningful units in the texts were identified and appropriate codes were assigned to these units. The codes obtained were grouped according to their similarities and contents and larger categories, that is, themes, were created. These themes enable the data to be understood in a broader context and reveal the main elements that determine teachers’ attitudes toward project consultancy in line with the purpose of the research. As a result of the content analysis, the factors affecting the project consultancy process were collected under 20 different codes and 4 main themes in which these codes were grouped. These themes were defined as “Evaluation,”“Execution,”“Planning,” and “Completion.” Each theme includes important components that reflect teachers’ experiences in project consultancy processes and how these processes are managed. In addition, frequency (
Frequency and Percentage Values of Codes and Themes Created by Content Analysis.
Quantitative Dimension of the Research
In this part of the research, a scale was developed to determine the factors affecting teachers’ attitudes toward project consultancy. This scale was created based on the findings obtained in the qualitative phase of the research. Qualitative findings provided important data that guided the scale development process and contributed to the determination of the items to be used in the quantitative stage. Themes from the qualitative phase directly informed the item pool. For example, the theme “Evaluation” led to items such as “I guide students to reflect critically on their project outcomes.” The code “contribution to students’ future education” informed the item “I provide guidance that aligns with students’ long-term goals.” The items were presented to expert academicians for their opinions to ensure content validity. In line with the evaluations of the experts, necessary adjustments were made to the items, and the validity of the scale was strengthened. Finally, the main data collection process of the research was initiated and the collected data were subjected to statistical analysis.
Creating the Item Pool
The 4 main themes identified as a result of the qualitative analysis and the 20 codes classified under these themes provided a framework for the development of the scale items. These themes and codes were used to create a 52-item item pool that aimed to comprehensively measure teachers’ attitudes toward project consultancy. Each item was consultancy process. A 5-point Likert-type scale was used to determine the extent to which the participants agreed with the items in the scale. These types of scales are a widely used method to assess participants’ level of agreement with a particular statement (Croasmun & Ostrom, 2011). The Likert scale presents participants with various statements and allows them to rate the extent to which they agree with these statements on a scale of 1 to 5. The 5-point Likert scale used in this study was structured as “1 = Strongly Disagree, 2 = Disagree, 3 = Undecided, 4 = Agree, 5 = Strongly Agree.”
Obtaining Expert Opinions (Scope Validity)
To evaluate the validity of the prepared item pool, content validity analysis was performed. Content validity is a method used to determine the extent to which a measurement tool represents the concept it is intended to measure and its adequacy in terms of content (DeVellis & Thorpe, 2021). In this process, expert opinions were sought to evaluate the suitability of the items in the item pool in terms of content, language, and expression. First of all, in order to ensure the linguistic accuracy and understandability of the expressions in the item pool, the opinions of two academicians who are experts in the field of expression were taken. These experts meticulously examined the items in terms of spelling, language, and expression and suggested the necessary corrections. In line with the experts’ suggestions, linguistic and expressional corrections were made to the items and the expressions were made more understandable. Then, a panel consisting of five experts in measurement and evaluation fields was formed to evaluate the content validity of the scale. Scale items were presented to these experts in an expert opinion form and they were asked to evaluate each item with a three-point rating system. Experts evaluated each item with one of the following options: “Appropriate,”“Not Appropriate,” or “Appropriate but needs correction.” The feedback from the experts was analyzed and necessary adjustments were made to increase the validity of the items. Lawshe technique was used to evaluate the results of expert opinions. The Lawshe (1975) technique is a widely used method for assessing the content validity of a scale and provides a systematic analysis of feedback received from experts. Additionally, this technique includes calculating content validity rates and content validity indices for each item (Heberlein et al., 2005). The content validity rate calculation is obtained by dividing the items that are “Appropriate” for a particular item by the total number of experts. This ratio shows how well the item represents the purpose of the scale. The content validity criterion was calculated at a significance level of 0.05 and based on the number of experts of 5. The content validity ratio (CVR) and content validity index (CVI) were calculated using Lawshe’s (1975) technique. Fifteen items with CVR <0.72 were removed. For instance, the item “I explain the evaluation criteria to students at the beginning of the project” was removed due to low relevance ratings. As a result of the evaluation, 15 items that did not meet the content validity criteria were eliminated and the scale was simplified to a total of 37 items. In addition, the content validity index in the study was calculated as CVI = 0.87.
Analysis of Research Data and Findings
The data analysis phase consists of two main parts. EFA was conducted to determine the basic structures and dimensions of the scale. The other analysis, confirmatory factor analysis, was applied to test the accuracy of the structures determined by EFA.
Exploratory Factor Analysis (EFA)
Universe and Sample
The universe of the research consists of teachers working throughout a country. The reason for choosing this phase is to examine and evaluate teachers’ attitudes toward project consultancy. In order to minimize time and cost constraints and to reach a wide range of teachers during the research process, the convenience sampling method was preferred. A rule suggested in the literature was taken into account in determining the sample size. It is necessary to reach at least five times as many participants as the number of items in the scale (Hair et al., 2010). For this reason, it was accepted that reaching 200 to 250 participants was sufficient in terms of social sciences. However, in order to obtain a larger data set and increase the power of the analysis, the survey of 382 participants was evaluated as a result of the survey sent via Google from. A sample of 382 teachers was determined adequate based on the 5:1 item-to-participant ratio (Hair et al., 2010). Demographic characteristics of the participants were 42.4% female and 47.7% male. Of the participants, 24.5% have been teaching for 1 to 5 years, 52.1% for 6 to 10 years, and 23.4% for 11 years or more. Sixty percent of the study area participants work in the public sector and 40% work in the private sector. Geographic distribution: 77.7% of the participants are in the Mediterranean Region, followed by 12% in the Marmara Region and 10.3% in the Black Sea Region.
Exploratory Factor Analysis and Findings
EFA was applied to determine the dimensions of the 37 item draft “Project Consultancy Attitude Scale” and to reveal significant factors. This analysis was performed using SPSS (23.0), IBM SPSS Statistics for Windows, Version 23.0 statistical software. Several important preliminary checks were made on the dataset prior to analysis. As a result of the checks, it was determined that there were no missing values in the data set. To evaluate whether the data met the assumption of normality, the skewness and kurtosis values of each variable were examined. Skewness values ranged between −1.1 and +1.2, and kurtosis values also fell within this range. According to established guidelines (Kline, 2023; Tabachnick et al., 2013), skewness and kurtosis values between −1 and +1 are generally considered excellent for normality, while values between −2 and +2 are acceptable for most statistical analyses, including
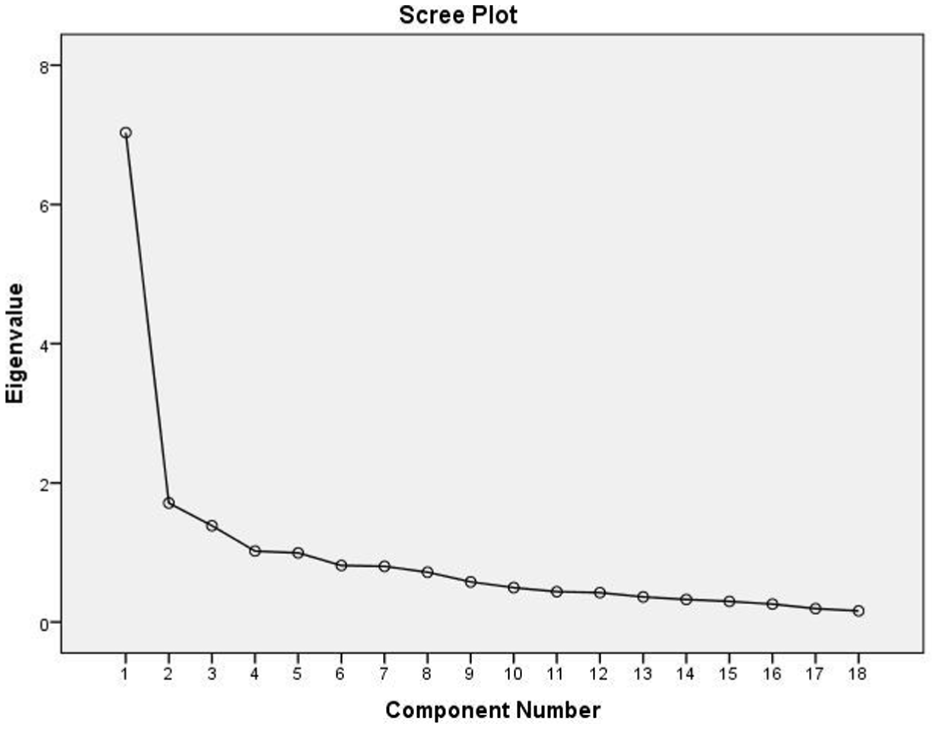
Scree plot.
To determine the number of factors, three criteria were used: eigenvalues greater than 1, scree plot examination, and the percentage of variance explained. Initial analysis revealed 10 components with eigenvalues above 1, but the scree plot suggested a clear inflection point after the fourth factor. Therefore, a four-factor solution was retained, explaining 61.9% of the total variance (factor 1: 39.0%, factor 2: 9.5%, factor 3: 7.6%, factor 4: 5.6%). Varimax rotation (orthogonal) was applied under the assumption of uncorrelated factors. To verify this assumption, inter-factor correlations were examined and found to be low (ranging from 0.246 to 0.599), which justifies the use of orthogonal rotation. Items with factor loadings below 0.30 were removed unless they were considered conceptually critical. A total of 17 items were removed, resulting in a final scale of 20 items across four factors (Table 2).
Results of Exploratory Factor Analysis with Means and Standard Deviations.

Confirmatory Factor Analysis (CFA)
It is recommended to perform CFA to verify the validity of the structure determined by EFA (Brown & Moore, 2012). In this regard, CFA was performed with a data set different from the data set used in EFA (Gallagher & Brown, 2013). For CFA, a new sample of 194 teachers working in the public and private sectors in a country was selected. CFA was conducted on a separate sample (
Confirmatory Factor Analysis and Findings
The CFA process of the Project Consultancy Attitude Scale aims to test the accuracy of the structure consisting of 20 items and 4 factors obtained as a result of EFA. Before starting the CFA, various preliminary checks were made to ensure that the data were suitable for analysis. These checks included steps such as removing extreme values and missing data and checking the normal distribution of the data set. Since the data set does not contain any extreme or missing values, it is assumed to have a normal distribution (Field, 2024). To evaluate whether the data met the assumption of normality, the skewness and kurtosis values of each variable were examined. Skewness values ranged between −1.1 and +1.2, and kurtosis values also fell within this range. According to established guidelines (Kline, 2023; Tabachnick et al., 2013), skewness and kurtosis values between −1 and +1 are generally considered excellent for normality, while values between −2 and +2 are acceptable for most statistical analyses, including
Fit Indices of the CFA Model.

CFA was conducted using LISREL on a separate sample (
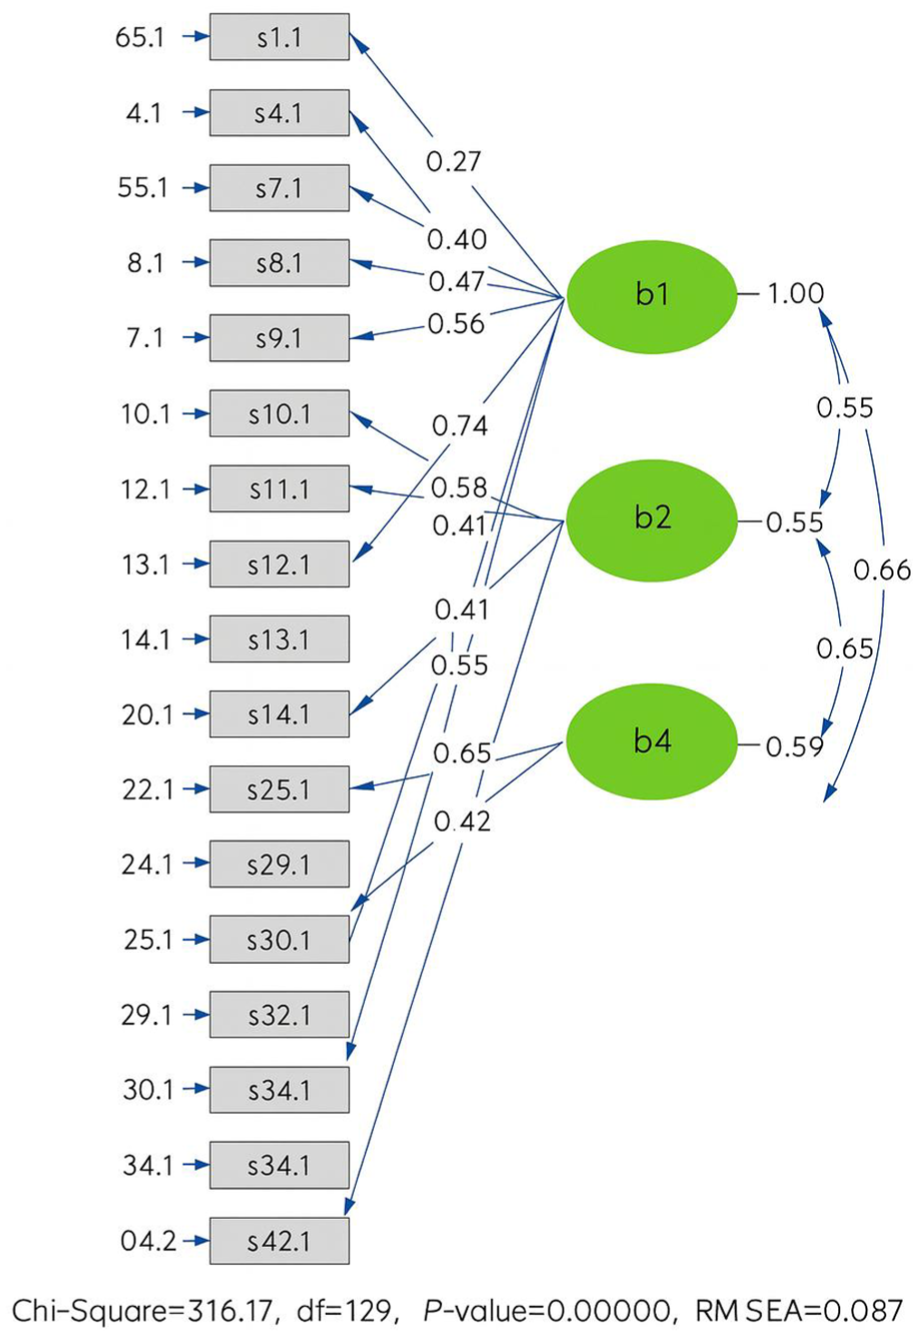
Graphical representation of the measurement model.
When the fit indices of the confirmatory factor analysis model given in Figure 2 are examined (χ2 = 316.17,
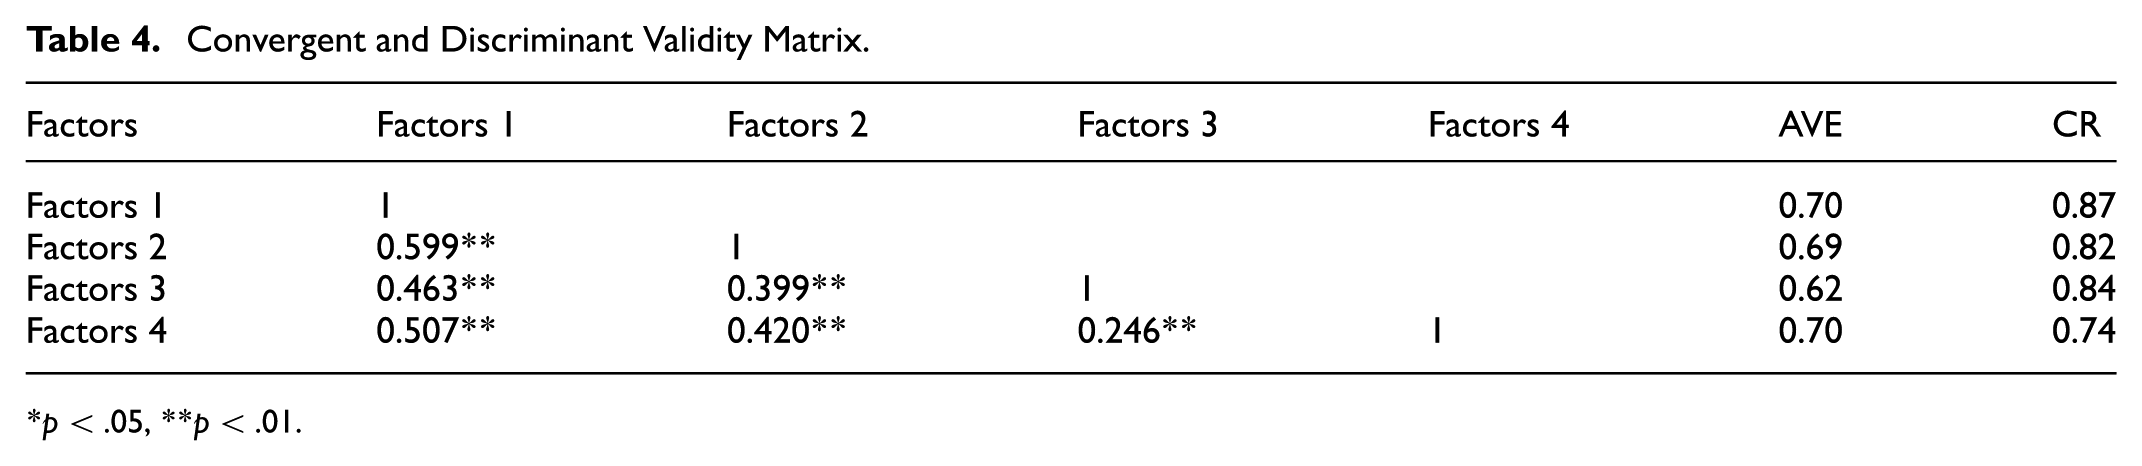
Convergent and Discriminant Validity
Various criteria are used to test convergent validity. One of these criteria is that the standardized factor loadings obtained from confirmatory factor analysis must be at least above 0.5 (Hair et al., 2010). When the analysis results were examined, it was seen that the factor loadings varied between 0.54 and 0.89. This shows that the developed scale meets this criterion. Other important criteria used to evaluate convergent validity are average variance explained (AVE) and composite reliability (CR) values (Hair et al., 2010). The AVE value is expected to be above 0.50 and the CR value is expected to be above 0.70.
Discriminant Validity
Discriminant validity is a type of validity that measures how different a construct is from other related constructs (Hair et al., 2010). One of the criteria used to determine discriminant validity is that the square root of the average variance explained (AVE) value of each factor is greater than the correlation values of this factor with other factors (Doksum et al., 1994). This criterion shows that the specific variance of a factor is higher than its common variance with other factors, thus confirming the separability and distinctiveness of the factors. The results presented in Table 4 show that this criterion was met and therefore the discriminant validity of the scale was successfully achieved.
Convergent and Discriminant Validity Matrix.
The internal consistency of the overall scale (Cronbach’s alpha = .89) and its sub-dimensions (ranging from 0.60 to 0.88) were acceptable.
Reliability Analysis
The reliability of the Project Consultancy Attitude Scale was evaluated with various methods. Reliability analyses were carried out with the following methods. Cronbach alpha internal consistency coefficient was calculated as .89 for the entire scale. Cronbach’s alpha values for the sub-dimensions of the scale were calculated as evaluation dimension: .84, execution dimension: .84, planning dimension: .88, completion dimension: .60. These results show that each sub-dimension has high internal consistency. The minimum acceptable value for Cronbach’s alpha coefficient is generally determined as .70 (Bernardi, 1994). In this case, the internal consistency of the scale and its sub-dimensions is quite high.
Test–Retest Reliability
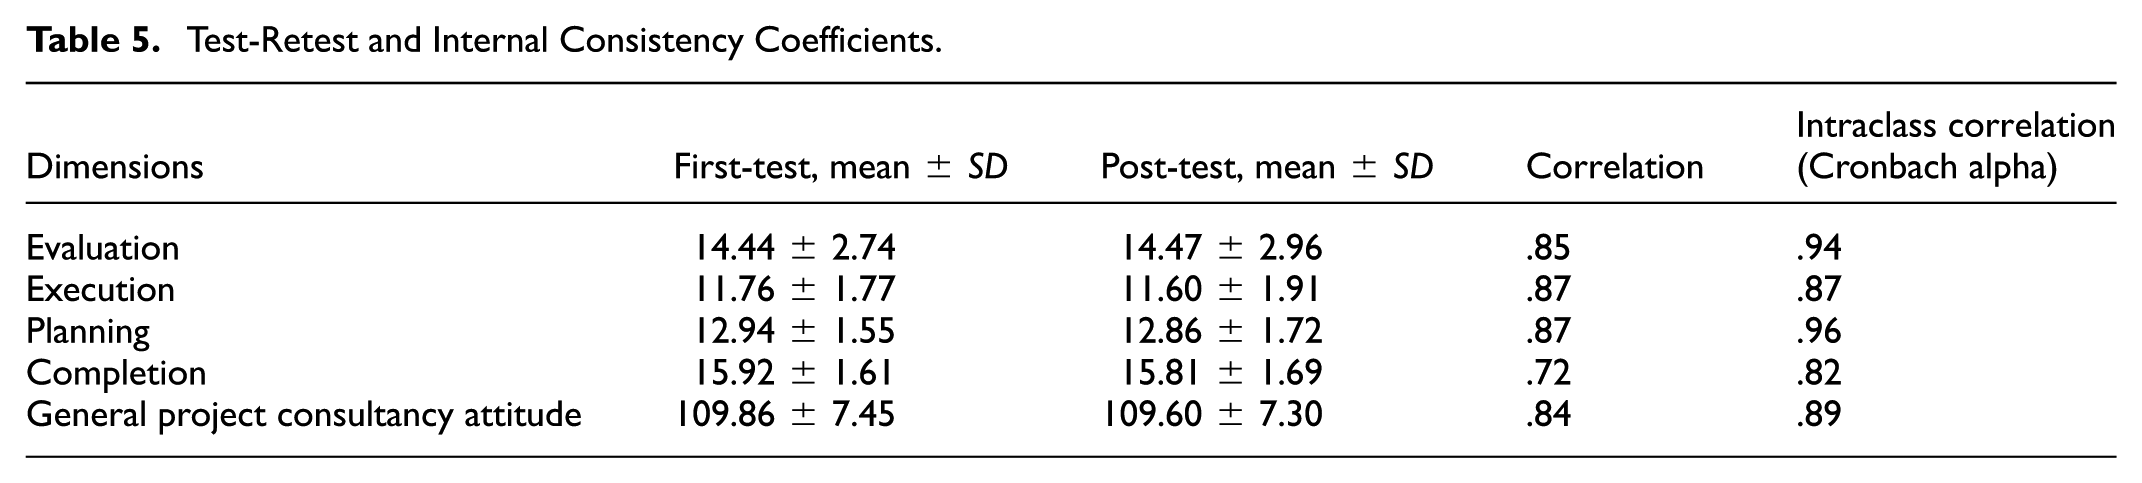
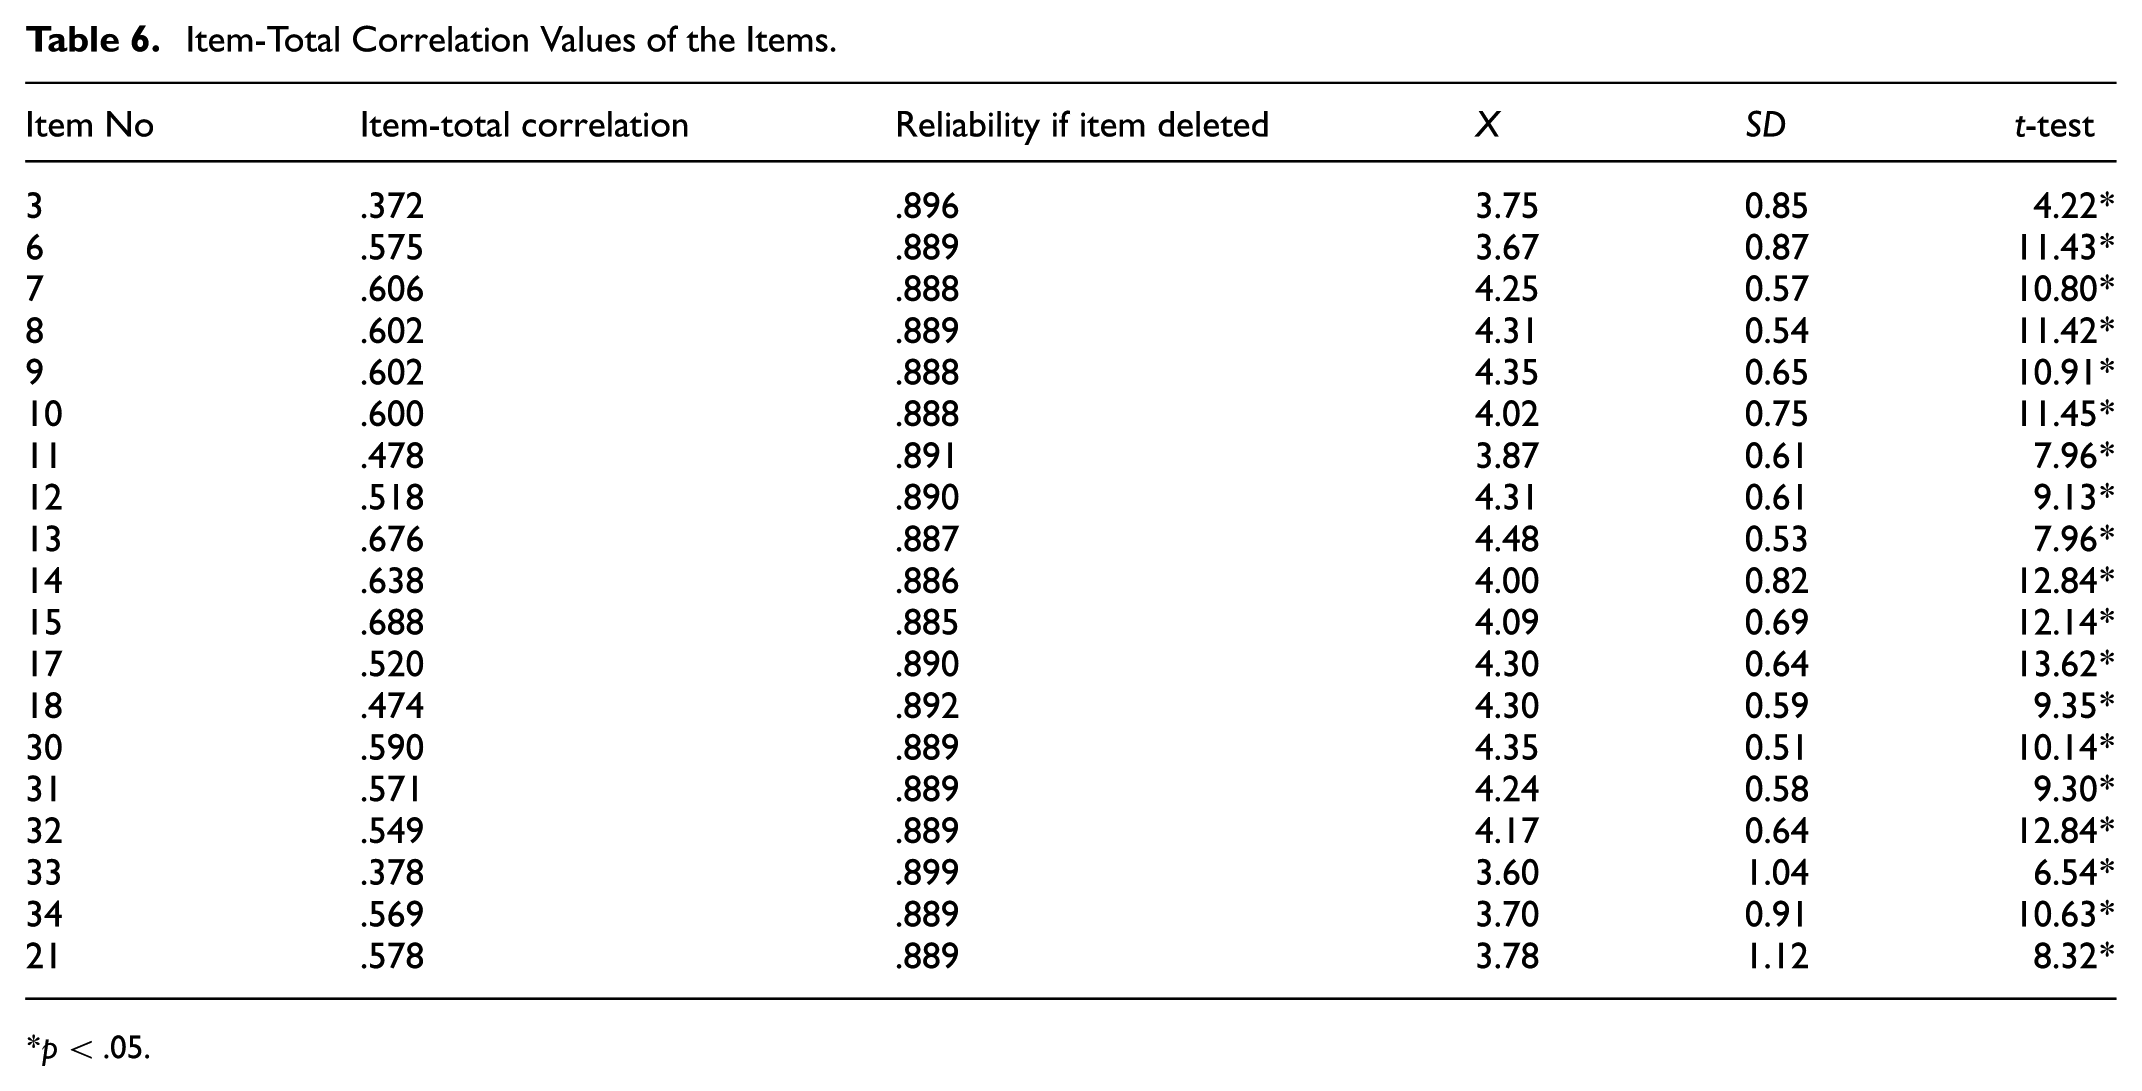
To examine the temporal stability of the Project Consultancy Attitude Scale (PCAS), a test–retest reliability analysis was conducted over a 14-day interval with a group of teachers working at different educational levels. Initially, 55 teachers participated in the first administration of the scale. However, 17 teachers opted out of the second administration. Consequently, the test–retest analysis was carried out with data obtained from 38 teachers who completed both assessments. The mean scores and standard deviations for each sub-dimension were found to be consistent across the two time points, indicating stability. Moreover, correlation coefficients between the first and second administrations were found to be moderate to high, suggesting good reliability over time. The Cronbach’s alpha coefficient for the overall scale was calculated as .84, demonstrating strong internal consistency. At the sub-dimension level, Cronbach’s alpha values were as follows: evaluation = .85, execution = .87, planning = .87, and completion = .72, all of which indicate a high level of reliability. These findings suggest that the PCAS demonstrates strong temporal consistency and internal reliability, further supporting the instrument’s validity and its suitability for repeated use in longitudinal or intervention-based educational research settings. Detailed results of the test–retest analysis are presented in Table 5. As a result of the analyses, the reliability of the Project Consultancy Attitude Scale was evaluated with three different methods (Cronbach’s alpha internal consistency, test-retest and composite reliability) and acceptable reliability levels were obtained in all three methods (Table 6).
Test-Retest and Internal Consistency Coefficients.
Item-Total Correlation Values of the Items.
Examining Teachers’ Attitudes Toward Project Consultancy in Terms of Gender
The results of the independent sample
Gender-Based Differences in Subdimension Scores.

When teachers were evaluated according to gender (
Discussion
This study identified a gap in the national literature regarding the lack of a tool to measure teachers’ attitudes toward project consultancy. To address this, a valid and reliable Project Consultancy Attitude Scale (PCAS) was developed. The research followed an exploratory sequential mixed-methods design.
In the first, qualitative phase, semi-structured interviews were conducted with teachers to explore factors influencing their attitudes toward project consultancy. Analysis of these interviews yielded 20 codes grouped under four main themes: planning, execution, evaluation, and completion. These themes capture the key stages impacting teachers’ attitudes toward project consultancy.
Building on these qualitative insights, the second, quantitative phase focused on scale development. An initial item pool of 52 statements was created based on the themes and codes from the interviews. Experts reviewed these items, and using the Lawshe technique, the pool was refined to 37 items across the four dimensions. The draft scale was then administered to 382 teachers from both public and private sectors. Exploratory factor analysis (EFA) resulted in the removal of 17 items, leading to a final scale comprising 20 items organized under the original 4 dimensions.
The alignment between qualitative themes and factor analytic results strengthened the construct validity of the scale. To assess reliability, Cronbach’s alpha was calculated at .89 for the entire scale, indicating high internal consistency. Subscale reliability coefficients also fell within acceptable ranges.
Confirmatory factor analysis (CFA) was performed on a separate sample of 194 teachers to verify the factor structure. After necessary model modifications, fit indices confirmed an adequate model fit: χ2/
The final PCAS consists of 20 items, with 5 items per subscale, rated on a 5-point Likert scale from 1 (
The evaluation subscale measures teachers’ appreciation for student-centered assessment and originality, while execution reflects active involvement in guiding projects. Planning captures attitudes toward organizing and preparing projects, and completion relates to supporting project finalization and reporting.
While these four dimensions represent core aspects of project consultancy, future research could broaden the scale by including items on professional development or perceived impact on student learning, offering a more comprehensive perspective.
Regarding demographic findings, female teachers scored significantly higher on the Evaluation subscale compared to males, echoing previous research suggesting women may prioritize assessment and formative feedback more. No significant gender differences were found in planning, execution, or completion. These results invite further qualitative exploration to understand underlying causes and potential effects on student outcomes.
Teachers also reported challenges in project evaluation and implementation consistent with prior studies. Projects require systematic planning and are often perceived as complex and time-consuming, competing with other professional responsibilities. Limited access to relevant information and difficulties in organizing it contribute to teachers’ anxiety around project consultancy. To address these issues, in-service training focused on project consultancy competencies is recommended.
The PCAS offers a valuable tool for evaluating teachers’ guidance skills in project management. It can inform individual professional development, support teacher selection processes in project-based education settings, and help identify in-service training needs. Although promising, the scale’s application in hiring decisions or policy frameworks requires further validation and cautious consideration.
Conclusion
This study fills a critical gap by developing and validating the Project Consultancy Attitude Scale (PCAS), a reliable and valid instrument for assessing teachers’ attitudes toward their roles as project consultants. The mixed-methods design ensured both conceptual depth and empirical rigor in the scale development process. Findings revealed notable gender differences in evaluation-related attitudes and emphasized the need for targeted training to support teachers in these roles. By offering a psychometrically sound tool, this study opens up new possibilities for enhancing teacher effectiveness and improving the implementation of project-based learning across diverse educational contexts.
Implications
The PCAS can diagnose teachers’ strengths and areas for growth in project consultancy, thereby informing more targeted and effective professional development initiatives. Furthermore, integrating consultancy-related competencies into pre-service teacher education programs is essential to better prepare educators for the multifaceted demands of this role. However, the sample for this study was drawn from a specific region within a country, which may limit the generalizability of the findings to broader populations. Future research could expand the geographic scope to include diverse educational contexts and cultural settings, enhancing the scale’s applicability and relevance.
In practical terms, the PCAS has several promising applications in real-world educational settings. Schools could incorporate the scale into professional development planning to identify areas where teachers need additional support or training in project consultancy. Additionally, the PCAS might serve as a useful tool during hiring processes to align candidate profiles with the demands of project-based learning environments. At a policy level, aggregated results from PCAS applications could inform national teacher standards and curriculum reforms by providing evidence-based insights into educators’ readiness to act as project mentors and consultants.
Limitations
The sample was drawn from a specific region within a country, which may limit the broader applicability and generalizability of the findings to other geographic or cultural contexts. Subgroup analyses were limited to gender differences, leaving other potentially influential variables such as teaching experience, educational level, and subject area unexplored. Future research should address these limitations by incorporating more diverse samples and examining a wider range of demographic and professional variables.
Future Directions
To enhance the utility and generalizability of the PCAS, several avenues for future research are recommended, organized by timeframe:
Near-term: Item-level refinements should be undertaken to improve clarity and precision. Applying advanced psychometric techniques such as Item Response Theory (IRT) may further strengthen the scale’s measurement properties.
Mid-term: The scale should be tested in diverse regions, countries, educational levels, and subject areas to evaluate its cross-context validity. Additionally, qualitative studies exploring the nature and implications of observed gender differences could provide deeper insights into how these attitudes manifest in classroom settings.
Long-term: Longitudinal research is needed to examine how teachers’ attitudes toward project consultancy evolve over time. Such designs could inform the development of sustainable, long-term professional development strategies. Furthermore, studies investigating the relationship between PCAS scores and actual mentoring behaviors or student project outcomes would provide evidence for the scale’s predictive validity.
Supplemental Material
sj-docx-1-sgo-10.1177_21582440251376055 – Supplemental material for Developing and Validating a Scale for Assessing Teachers’ Attitudes Toward Project Consultancy
Supplemental material, sj-docx-1-sgo-10.1177_21582440251376055 for Developing and Validating a Scale for Assessing Teachers’ Attitudes Toward Project Consultancy by Ayşegül Tongal, Fatih Serdar Yıldırım, Yasin Özkara and Ayşegül Yıldırım in SAGE Open
Footnotes
ORCID iDs
Funding
Declaration of Conflicting Interests
Data Availability Statement
Supplemental Material
References
Supplementary Material
Please find the following supplemental material available below.
For Open Access articles published under a Creative Commons License, all supplemental material carries the same license as the article it is associated with.
For non-Open Access articles published, all supplemental material carries a non-exclusive license, and permission requests for re-use of supplemental material or any part of supplemental material shall be sent directly to the copyright owner as specified in the copyright notice associated with the article.