
Abstract
Introduction
Batty (2006) observes that objects and events scale with size. He highlights that most analyses that entail a power law to characterise that distribution do so for a single point in time. The city-size distribution characterised as Zipf’s law is an empirical regularity that predicts the size and number of population nodes are inversely related (Arshad et al., 2018). Batty (2006) rank clock reveals that although the distribution may be stable, the rank order of city populations is not.
In the economic growth literature, beta-convergence is said to exist when a region with a relatively low income per head experiences a faster growth rate than the average of the group of regions, and the gap between it and richer regions is reduced; low-income regions have a higher growth rate than high-income ones. An initial dispersion of regional values is maintained in rank order, but there is ‘catch-up’. Sigma-convergence is a narrowing in the spread of income levels from across geographic areas at time
The Organisation for Economic Co-operation and Development (2011) questions the meaning of a ‘mean’ regional level. There is no clustering of regional levels around the ‘average’. As such, converging on the mean is meaningless. Lavalette’s ranking power-law is a good candidate for describing both long-tailed and non-long-tailed data (Chlebus and Divgi, 2007), when the Zipf regularity is not expected and power laws can be applied. It can characterise much narrower spatial distributions and has been applied to Italian regions and municipalities (Cerqueti and Ausloos, 2015a, 2015b). Particularly with policy initiatives around inequality, having alternative indicators of spread not based on a mean could be useful. Indeed, Lavalette’s exponent and changes in the exponent could provide useful insights into spatial inequalities.
This paper considers Lavalette’s function and its applicability to district house price-earnings ratios (HPERs). Housing affordability is a topical local issue yet a gap in our knowledge is what happens at the local level. One underutilised source of data provided by the Office for National Statistics is district house price to earnings ratios in England and Wales. At the regional level, Gregoriou et al. (2014) analyse the UK housing affordability picture over 1983–2009, averring there is a dislocation between income and price. Is this the case across all districts?
The paper considers how stable the distribution of house price-earnings ratios is over time, how robust the ranking order in ratios are in the face of variations in affordability, and proffers an explanation for the shape and movement of the distribution. The robustness of the ranking order is undertaken using a time-based Spearman’s rank correlation. The time-path is used to demonstrate the degree intra-distributional mobility over the period. Moreover, it is concluded that, as it has strong similarities with the time-path of the coefficient of variation, Lavalette’s exponent provides an alternative measure of sigma-convergence. Drawing on work in the urban scaling literature and Zipf’s law, in conjunction with finance theories of pricing and affordability, explanations for stability of order and spread are proffered.
The paper is structured as follows. First, there is a brief discussion of house price determination and the distribution of affordability metrics. Second, Zipf’s law and central place theory are outlined, and also the complication that administrative spaces injects. Next, rank preservation and Batty’s clock are considered. This is followed by an outline of convergence in house prices and the law of one price. There is a discussion of Spearman’s rank autocorrelation coefficient under method. It is adapted to assess the degree of rank order instability. Pareto and Lavalette’s exponents are also reviewed in method. The analysis shows that Lavalette’s exponent provides a useful description of the distribution of data drawn from administrative units. The time-path of the exponent reveals a pattern of sigma-convergence followed by divergence. Spearman’s autocorrelation function reveals intra-distributional mobility, but too little to claim instability. Rather than the general rise in the house price-earnings ratio implied by Gregoriou et al. (2014), when ordered by rank, the resulting ‘gradient’ appears to steepen over the 15 years. An increase in both Lavalette’s calibrating value and the exponent are consistent with a steepening of the ‘gradient’ of ratios. The steepening reveals at the bottom end districts are almost untouched by liberal finance.
The distribution of local house prices
The Bank of England (2015) posits that rental yield (rent ÷ price) is a determinant of fundamental value. Following this asset pricing model, beyond standard structural features such as size and proximity to amenities, underlying a house price is the cost of capital. Miles and Monro (2019) estimate that the sustained decline in real interest rates between 1985 and 2018 can account for all of the doubling of house prices relative to incomes over that period.
Asset pricing models project that housing yields reflect expected rental income growth. With anticipated city productivity growth (Coulson et al., 2013; Van Nieuwerburgh and Weill, 2010) or population growth, rental yields are expected to have a greater locational value in the future, and so current house prices will be higher.
A common thesis is that price rises since the 1980s have been related to more liberal finance. Hay (2009) argues that, from the early 1990s, consumer-led growth strategies and the incentives around allocating mortgage debt inflated house price in both the UK and Eire, propitiously.
A persistent decline in the risk-free rate of return and more accessible credit does not mean that all HPERs should rise in the same proportion. Stein (1995) argues that, because of the inflated property equity that is bestowed on existing owners, where the metrics are more generous, a price rise accelerates [decelerates] more in a boom [bust] periods, which is more likely to be in high house price area. In other words, high house prices and high house price-earnings ratios coincide with greater volatility. This is linked to the financial accelerator (Aoki et al., 2004). With rising prices, higher leveraged dwellings appear lower [not higher] risk to lenders over some of that rise.
In contrast, pessimistic expectations of future growth, locally, will raise agency costs to the lender so that properties with the given rental stream would have lower prices. Glaeser and Gyourko (2005) posit that, as properties are more readily available, a city with a declining population would experience falling local housing prices. Consistent with this, some US states have declining HPER trends (e.g. Indiana, Mississippi and South Carolina) (Hu and Oxley, 2018).
The credit constraint that most buyers will face will be related, in part, to the lender’s view of risk in lending. A hierarchy in HPERs could be viewed as reflecting risk-adjusted returns across space to a dwelling purchase (Sinai, 2010). In this light, one could envisage the rank order of HPERs like the term structure of interest rates. This implies that the ‘gradient’ of that HPER order will be steeper [shallower] in a bubble [bust].
Urban systems and power laws
Mainstream urban economics posits that co-location generates increasing returns to scale in social, household and business domains. The enhanced productivity that underpins higher wages should induce city in-migration. Crowding costs that come with population density strongly feature relatively expensive accommodation, acting as a counterweight to in-migration. A spatial general equilibrium framework (Roback, 1982) posits that individual agents migrate within
An observed regularity and explained by central place theory (Hsu, 2012) is the urban size structure characterised by Zipf’s law. A decreasing number of increasingly large nodes of activity can be expressed as a non-linear relationship between the rank-size of cities and their corresponding populations. Brakman et al. (2020: 304) summarise that empirically at the continental level, Zipf’s law is not strictly adhere to. It is better supported at the national level but with a tendency towards a more uneven distribution of city-sizes in the last 60 years. The distribution of city-sizes across Germany and also within its
Rozenfeld et al. (2011) show that the area of a city also follows a power law. The third leg of the stool, population density, does not. Indirectly, they consider two distributions in ratio form revealing a Zipf exponent of zero: the density of population is unrelated to the corresponding rank order. It highlights that ratios should not necessarily have a power coefficient of unity.
As administrative territories may not necessarily reflect economic units, subdivisions may be arbitrary, and as some English and Welsh cities are divided into districts, this will inflate the number of tracts. Fontanelli et al., 2017 propose that the ‘split-merge’ process of district resizing can render initial power laws of cities into other kinds of probabilistic laws. The distributions in latter stages are represented well by the discrete generalised beta distribution (DGBD). A special case of a DGBD is Lavalette’s law. When examining Italian regions and municipalities’ aggregated tax income over the period 2007–2011, Cerqueti and Ausloos (2015a) find a Lavalette function is statistically appealing in describing a size-rank rule.
Rank preservation
A test of Zipf’s law is that population growth is randomly distributed across the urban size spectrum (Arshad et al., 2018) so that growth [shocks] should not alter the rank order in a general way. Batty (2006) rank clock reveals that the rank order of city populations is unstable. Duranton (2007) considers three groups of city population growth rates: fast, slow, and still. The fast entails rapid changes driven by the location of dynamic industries. The slow refers to movement up or down the urban hierarchy as they grow relative to other cities, and the still reflects the size distribution almost unmoved by the passage of time. This last group tends to be of very large cities.
For housing, shocks have differential effects. Following a positive house price increase, Bogin et al. (2017) find that, in large cities, prices are consistently higher than the ‘pre-acceleration’ level. In small cities, real price gains are not so clear. They conclude that the average growth acceleration rate is a signal of a permanent shift in a location’s economic fundamentals. Using a cost of capital framework, Himmelberg et al. (2005) argue that price sensitivity to changes in real interest rates favours higher price levels in rapidly growing cities. It is concluded that rank inconsistency or [rank-] shuffling in HPERs may favour more expensive districts, possibly in larger or growing cities.
Convergence
Beta-convergence has been applied to regional housing in the UK (inter alia Cook, 2012; Drake, 1995; Montagnoli and Nagayasu, 2015; Tsai, 2018). Tsai (2018) claims the beta-convergence process verifies the law of one price in a house price context. This ‘law’, which draws heavily on spatial arbitrage, implies that a common price results from relocating a good from the low to the high-priced sites, squeezing out differentials. In house prices, this relates to the buyer switching to searching in lower-priced locales.
Beta-convergence in a Sala-i-Martin (1996) sense is described as intra-distributional mobility. In effect, the initial distribution becomes less representative at some point. A gauge of this is the degree of commonality between a benchmark [initial] order and any subsequent one. Mobility could result from a deviation from, or retroversion to, an established order in an error correction sense. So, to be consistent with the growth literature’s view of change, the tendency for dissimilarity to increase with time would be more apposite. A converged group would be characterised by random changes only. Indeed, this could be a phase. As proposed by Quah (1996), a logical outcome of beta-convergence is that the faster growth of the catch-up group carries on, ‘leapfrogging’ formally richer states, generating beta-divergence. The time variability of the distribution or spread should be considered concurrently with the rank order (Gray, 2020).
Method
Zipfs’ law is a special case of the general expression:
Lavalette’s ranking power-law, established by the French biophysicist Lavalette (1996), can be expressed as
Simulations show that a greater exponent (
Changes that occurred in a hierarchy of district values can be discussed using the statistical distribution of rank changes or the distribution of differences. One such measure of change, a time-based Havlin’s (1995) distance statistic, can be presented like an autoregressive function,
Data
Regional and Local Authority District house price and earnings data are supplied by the UK’s Office for National Statistics (ONS). Earnings data are taken from the Annual Survey of Hours and Earnings. Annual estimates of gross earnings are based on the tax year in the reference year and relate to employees on adult rates of pay who have been in the same job for more than a year. Both workplace-based and residential district earnings are available. Work-based earnings are used to capture the effects of commuting of workers across district boarders. House Price Statistics for Small Areas are drawn from the Land Registry, which provides a comprehensive record of property transactions in the UK. The ONS values are all actual prices, including those not involving a mortgage, and annual earnings, including those not engaged in house purchase. The median values capture the typical worker’s earnings and house price paid in a district.
England and Wales (E&W) is divided into 10 regions and, excluding the Isles of Scilly which has intermittent data, 338 districts. The median HPER of ‘all dwellings’ in a year is available for regions and districts from 2004 to 2019. This covers the run up to, and the recovery from, the financial crisis of 2007–2008. An English and Welsh Local Authority District has an average population of around 150,000 but the largest, Birmingham, has around 7 times that.
Regional HPER.

Local house price-earnings ratios.

H Mean = Harmonic Mean.
StDev = Standard Deviation.
Figure 1 displays district HPERs arranged in rank order for 2004 and 2018. HPER at the bottom end has a shorter tail than at the top. Both distributions are Plot of the HPER in rank order of size between 2004 and 2018.
Results 1: Rank stability
Time-paths of Spearman’s coefficients for E&W and the regions are displayed in Figure 2. The path labelled E&W (right group, thick line) is of a rank autocorrelation function based on 2004, such that the value of Rank autocorrelation function. EE = East of England (South), NE = North East (North), EM = East Midlands, SE = South East (South), WA = Wales (North), WM = West Midlands, SW= South West (South), YH =Yorks & Humberside (North), LON = London (South), NW = North West (North), E&W= England and Wales.
One might explore the time-paths to look for patterns. The
Results 2: Exponents
Pareto and Lavalette exponents.

1Bootstraps confidence interval.
To illustrate the fit, Figure 1 shows the distributions generated for 2004 and 2018 using the estimated Lavalette exponents from Table 3 and the mean values in Table 1. The simulated values are a remarkably close fit for the realisations. As the goodness of fit measures are all over 84% (not reported), Lavalette’s function can also summarise the districts when in their regional groups as well.
Figure 3 shows the time-paths of the exponents in the three groups again. The Lavalette exponents. For key, see Figure 2.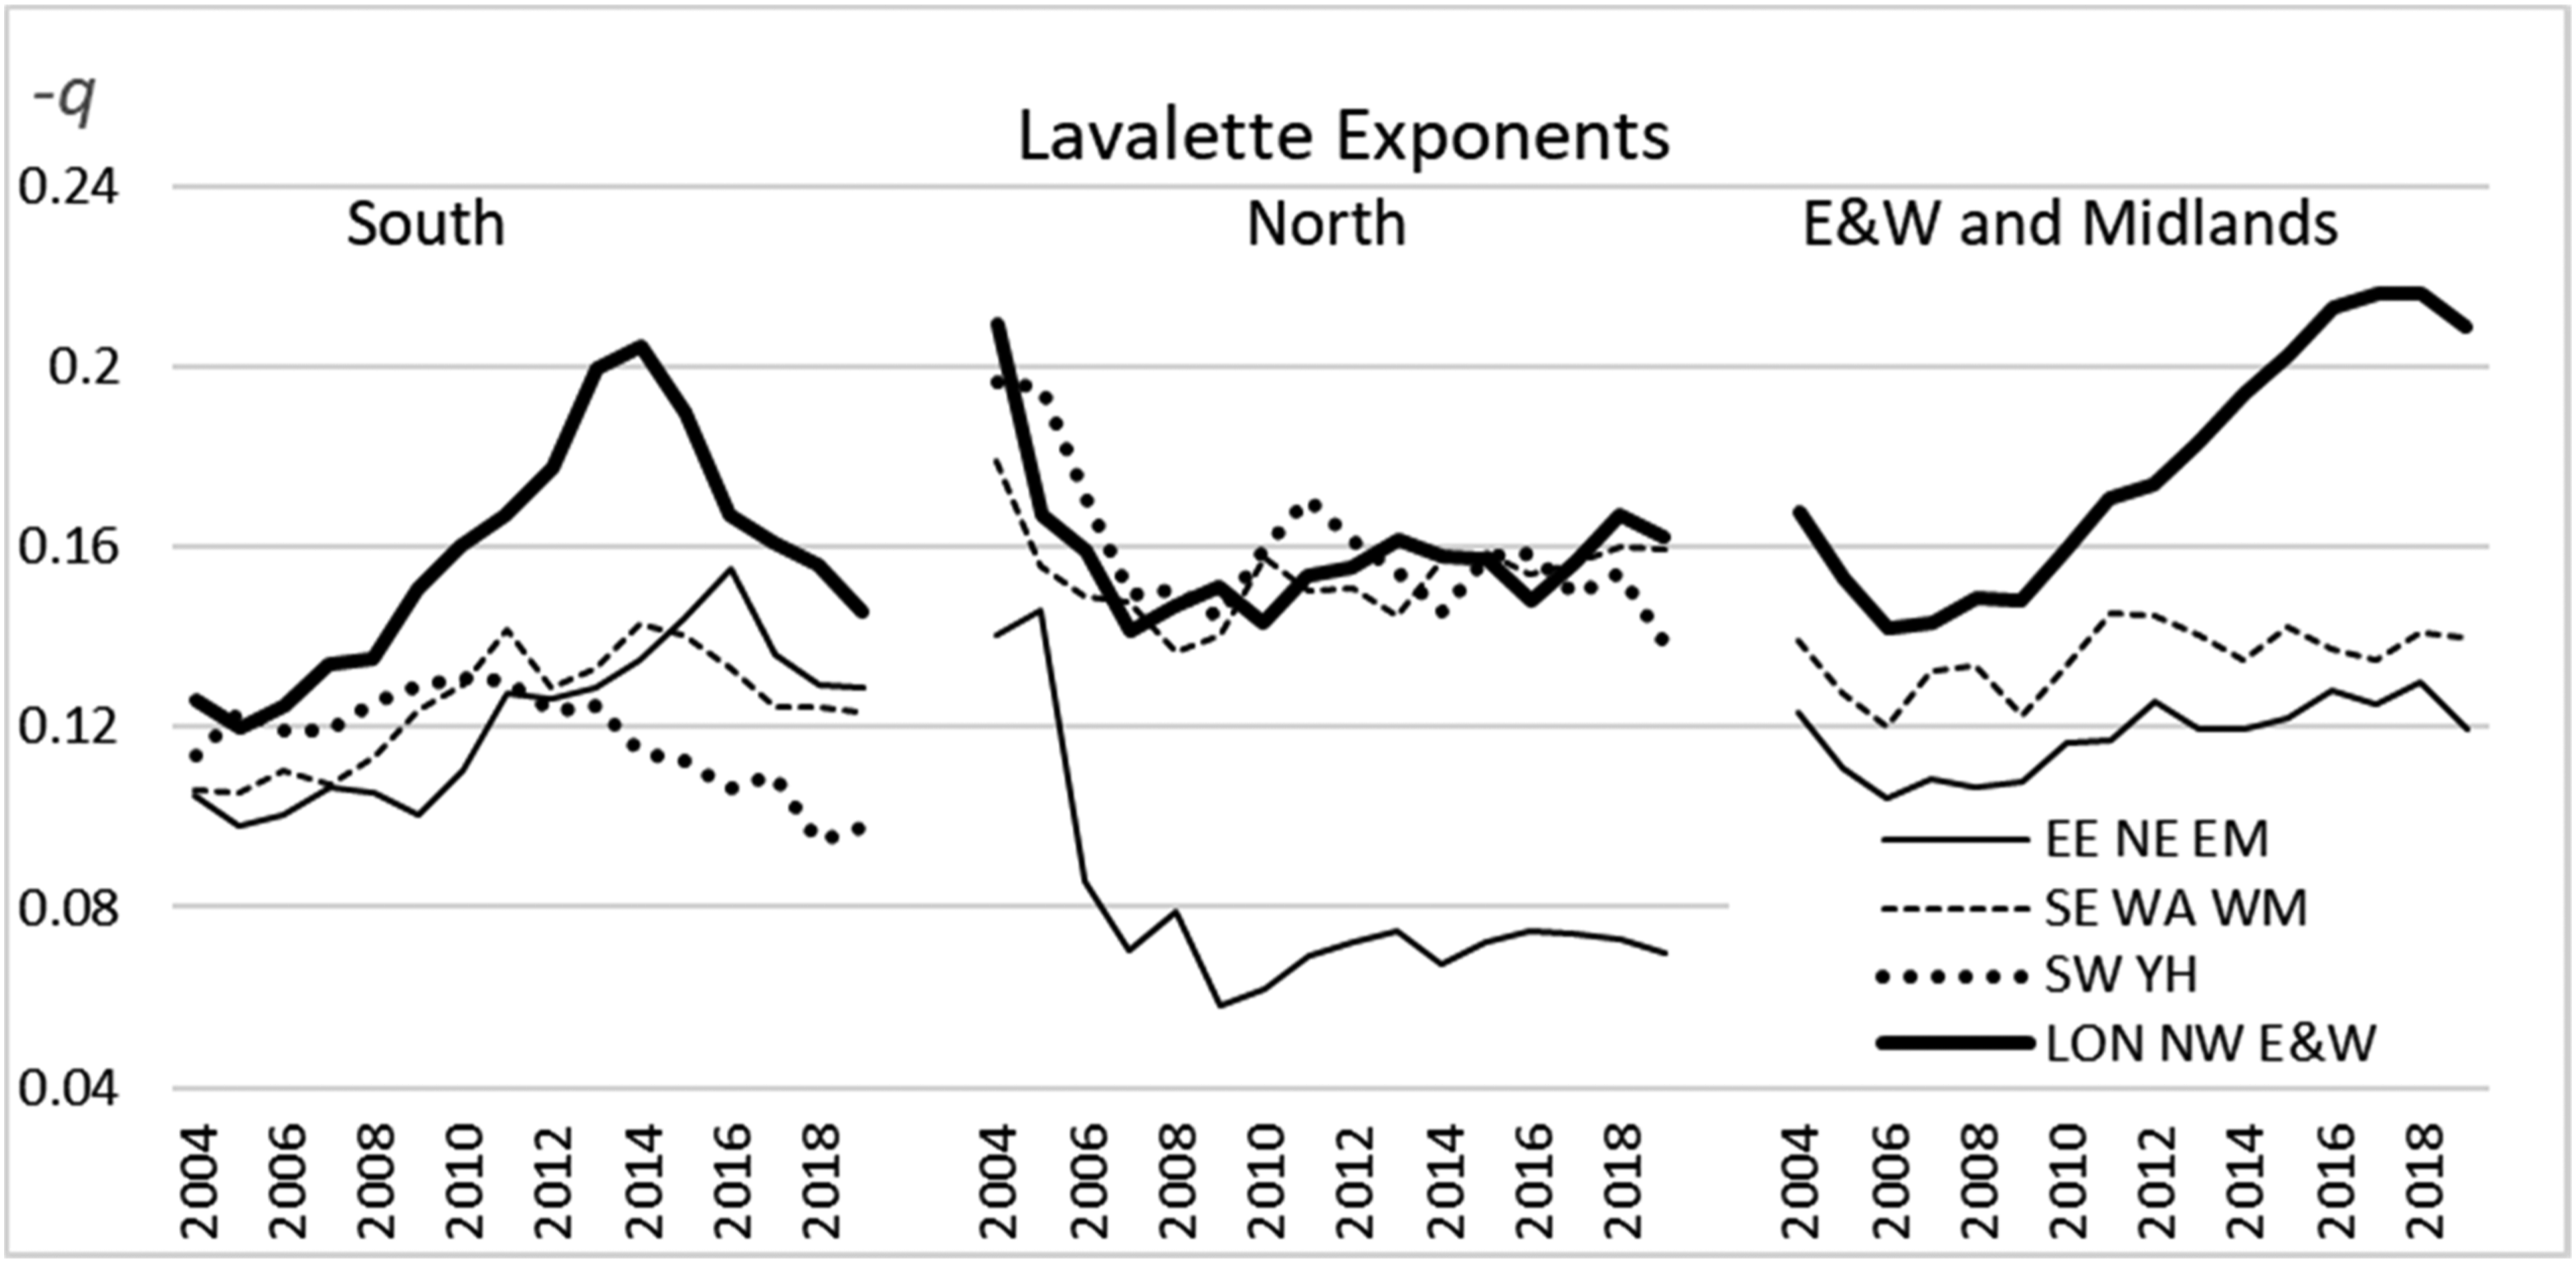
Comment
Lavalette exponents and the cross-sectional CoVs are found to trace such similar time-paths for E&W 2 and for the regions that reproducing both is unnecessary. The long tails at the top end render simple means of the district ratios to be biased upwards, so explaining why harmonic means are effective in aligning district and regions averages. One might expect long-tailed data to be a common phenomenon. For example, the Organisation for Economic Co-operation and Development (2011: 47) displays a distribution of net employment creation across the OECD (Figure 1. 12) which has striking similarities with Figure 1.
The autocorrelation function shows decreasing similarity with the 2004 order. There is some reranking but despite the degree of general movement, there are strong similarities between the initial and terminal structures. This appears to be a function of the HPER level. Wales, Yorks-Humberside and North West exhibit stable internal rankings, despite an increasing time lapse, and stable estimated
At odds with Tsai (2018), the law of one price is not supported as a practical notion. With CoV being a standard measure of sigma-convergence, bifurcating the period into pre- and post-2008, in the first period, HPERs are found to converge, which is later trumped by greater divergence over 2009–2018. In the first period, the North saw unusually large spreads when the South experienced the obverse. Post-2008, regions outside of the South maintained stable spreads, whilst inside they were broadening. The E&W Lavalette exponents are high relative to most regions’ and do not trace a representative path. The broader distribution towards the end of the period appears to reflect distinct regional groups that are diverging, with the top half of the distribution featuring southern districts.
Over the 2004–2018 interval, there is a broadening of district spreads. This is evident from a similar minimum value but with a much higher maximum one in 2018 in Figure 1. Ignoring the tails, the distribution ‘gradient’ of the HPER in 2018 is steeper. Gregoriou et al. (2014) aver that there is a dislocation between income and price in UK regional housing affordability. This is not wholly supported at the district level. Rather, there is a similar finding to Van Nieuwerburgh and Weill, who reveal a steep rise in the dispersion of house prices across US regions during 1975-2007, using the (CoV) as a scale-neutral measure of dispersion. Here, there is a steepening in HPERs, captured by both the calibrating value and Lavalette’s
Conclusion
This paper considers the evolution of district house price-earnings ratios over 2004–2019 as provided by the Office for National Statistics. They proffer a richer basis for affordability analysis than regional data. This paper finds the ratios can be summarised well by a Lavalette function. As it caters for long tails, it proffers perhaps a more useful summary of spatial data than simple descriptive statistics where there is a tendency to maintain differentials.
Although there is a general rise in ratios, there is also a steepening of the ‘gradient’ of ratios. Explanations for both are argued to be linked to local risk assessment, credit liberalisation and real interest rates. There is an increase in both the calibrating value and the exponent over the period. The time-path of the Lavalette exponent is used to provide a measure of sigma-convergence–divergence, revealing that spreads expanded. Combined with a rising calibrating value, it is consistent with ratios rising at different rates. As such, assertions in the literature about the law of one price in housing are difficult to support.
Spearman’s rank autocorrelation coefficient is used to assess the stability of the rank order. Despite 15 years of random and systematic movements, and so intra-distributional mobility particularly at the top end of the distribution, rank instability is not generally found. The terminal and initial rank order are associated. The regions in the South and the top half of the distribution is subject to more change than elsewhere, posited to reflect lending practices and price accelerants (Aoki et al. 2004; Stein, 1995).
Overall, recognising persistence in spatial inequalities, Lavalette’s law and Spearman’s correlation coefficient offer simple scale-neutral additional measures for the analyses of inequalities, without presuming a clustering around an average.