
Abstract
Introduction
Urban spaces have complex and distinct socio-spatial interactions that may lead to inequalities. European Territorial Cohesion guidelines (Marques et al., 2018) have emphasized the need to focus on policies that take into account both the potentialities and needs of each territory, whilst promoting solidarity and equity through the reduction of geographical and social disparities. Such spatial justice dimension (Davoudi, 2007) implies territorial structures organized in different hierarchies, willing to cooperate, and where patterns of accessibility are suitable to respond to local and global needs (ESPON, 2016). Organizational models must guarantee accessibility to distinct services and amenities, considering flexible geographies, as territories possess different structural and functional characteristics.
Research has focused on accessibility as an instrument of territorial cohesion, for example, by measuring proximity to services of general interest (Marques et al., 2019b). Yet it has also increasingly looked at the importance of having nearby green infrastructure (Ekkel and De Vries, 2017). Urban greenspaces have been recognized as fundamental amenities, multi-functional ecosystem services that are both critical to enhance the resilience and the sustainability of urban systems (Chiesura, 2004; Mendonça et al., 2021), and to provide social, economic and health benefits, supporting quality-of-life and well-being (Fleming et al., 2016; James et al., 2015; Salmond et al., 2016).
Indeed, different types of planned green infrastructure, as city parks, community gardens and green corridors, influence ecosystem service delivery, providing positive environmental benefits (Gałecka-Drozda et al., 2021; Graça et al., 2018). These can include air quality regulation, cooling effects, flood control (Aram et al., 2019), and the decreasing vulnerability to disasters (Jeong et al., 2021), and to other urban risks (Mukherjee and Takara, 2018). Consequently, the environmental comfort they provide, along with the activities they potentiate (as leisure, sports and socializing) (Pietilä et al., 2015), have an impact on how inhabitants experience the outdoors, overcome sedentary lifestyles, and improve their personal health (James et al., 2015; Kondo et al., 2018). Such can range from the relief of stress (Tyrväinen et al., 2014) to the reduction of feelings of insecurity, precisely due to the sense of identity they are able to provide (Ogletree et al., 2022; Saraiva and Teixeira, 2023; Sukartini et al., 2021).
Ultimately, all this potential contributes to social integration and can be transformative (De Sousa Silva et al., 2018; Kabisch and Haase, 2014; Verheij and Corrêa Nunes, 2021; Wüstemann et al., 2017), but only if it does not overlook socio-economic disparities (Mears et al., 2019). Therefore, allocation of greenspaces can be much more than an indicator of environmental justice (Fang et al., 2023; Mears et al., 2019); it can be an indicator of social justice (Dai, 2011; Wolch et al., 2014; Wu et al., 2018).
Greenspaces, and greenspace types, have a heterogeneous distribution across urban areas, so they have disproportionally benefited different population subsets (Graça et al., 2018; Wolch et al., 2014). Studies have argued that lower income households or minorities have diminished access to greenspaces (Wolch et al., 2005, 2014; Wu et al., 2018). This is deemed more pressing in higher-density cities (Huang et al., 2023), where urban and health vulnerability is more acute (Marques et al., 2021; Tipple, 2006; Xiu et al., 2011). The improvement or augmenting of green and blue spaces increases the attraction and real estate value of locations (Roebeling et al., 2017), which may lead to adverse socio-economic impacts like green gentrification (Mendonça et al., 2024; Wolch et al., 2014). Socio-economic deprived groups are the ones that possess fewer opportunities to travel longer distances to reach amenities, and so are more dependent on local resources (Mears et al., 2019; Wolch et al., 2005). The availability of nearby greenspace may help mitigate inequalities associated with socio-economic deprivation.
One may ask how “green enough” (Wolch et al., 2014) a city has to be, and how greenspaces can be distributed, so that socio-economic, health, and human needs are properly addressed. Concomitantly, it is necessary to understand and evaluate urban vulnerabilities in the same spatial framework. Research has extensively looked at the access to greenspace, but as Huang et al. (2023) point out, there is a lack of evaluation of socio-economic deprivation based specifically on the characteristics of high-density cities (Zhang et al., 2021). Merging these ideas by performing multivariate analysis, can lead to more comprehensively addressing social and territorial cohesion issues, thus potentiating the development of sustainable solutions for well-being and social justice. This is particularly critical today, as cities wish to invest in green regeneration and the boosting of sustainable economies (Cousins, 2021; Kato-Huerta and Geneletti, 2022; Mendonça et al., 2021).
The city of Porto, in Portugal, stands at this crossroad. It has declared itself a “green city” and is currently expanding its public green infrastructure. According to the official municipality website (https://www.cm-porto.pt/), Porto has 455 hectares of public access green and biodiverse space, amounting to 22 m2 per inhabitant. As one of the signatory cities of the EU’s The Green City Accord, and following the 2016’s Municipal Strategy of Climate Change Adaptation, the city has pledged to double this amount in upcoming years. This means an additional 160 hectares of parks, gardens or green corridors. The plan also considers improved active accessibility, and boosting attractiveness so as to draw visitors away from the city center (Lewis et al., 2022).
The purpose of this study is to inform the planning of public greenspaces in Porto, by developing and presenting a methodology that evaluates equity in accessibility to quality greenspaces, measured not in an environmental perspective, but by their amenities and morphological insertion, and, considering the city’s socio-economic vulnerability profiles. Greenspaces need to “
There has been recent research that has developed spatial approaches to understand urban social vulnerability (Berke et al., 2019; Roy et al., 2024) or equity in the urban structure at various scales (Attard et al., 2023; Barbosa et al., 2024) but those that relate specifically social vulnerability to greenspaces are relatively scarce. In Bangladesh, for example, Rahman and Zhang (2018) calculate a vulnerable groups’ social demand index, based on distance to greenery by administrative units, but it does not separate, in the end results, the different types of vulnerability nor of greenspaces. Few studies have tried to address simultaneously the three dimensions—quantity, spatial and social—and fewer still have understood the third as a comprehensive and complex phenomenon that needs to encompass the distinct characteristics of vulnerability. Using statistical information and data collected in situ, multi-correspondence analysis was performed to create vulnerability profiles at statistical section, which were then crossed with distinct proximity levels of accessibility to different types of greenspaces.
Urban vulnerability and equity in access to greenspaces
Urban vulnerability is complex and multifaceted (Brown et al., 2017) and its impacts in southern Europe have been widespread, especially in the last decade following a succession of economic, health, energetic, political and humanitarian crisis (Ari et al., 2022; Bosco and Verney, 2012; Dimian et al., 2021; Gilodi et al., 2024; Grané et al., 2021; Whitehead et al., 2014). By 2023, 21% of Europe’s population, 94.6 million people, were at risk of poverty or social exclusion, according to Eurostat (2023). This represents the amount of people living in households experiencing at least one of the three risks: poverty, severe material and social deprivation, and/or living in a household with very low work intensity. In Portugal, this number was close to the EU average (20.1%), meaning over two million people, and during the 2010s, the country has been especially affected, leading to the rise of unemployment and taxes, cuts in welfare and wages, and the appearance of new types of poverty (Marques et al., 2019a).
Consequently, urban and social vulnerabilities have become more visible (Gilodi et al., 2024; Ranci et al., 2014), but so has the understanding that these impacts are unfairly distributed. They are neither uniform at a spatial nor at a social scale, and they differ according to the many domains of vulnerability (Grané et al., 2021; Marcińczak et al., 2015; Méndez et al., 2015). There is no consensus on how to identify and characterize vulnerable persons, as it derives from the cumulative overlapping of various dimensions (Marques et al., 2019a). One dimension that has gained increased attention has been the accessibility to quality public greenspaces, due to their above-mentioned capability of contributing to the mitigation of socio-economic inequalities (Mears et al., 2019; Wu et al., 2018; Wüstemann et al., 2017).
As more people live in urban areas, and with housing market financialization (Marques et al., 2022), the pressure on the supply and demand of greenspaces have become more uneven, affecting differently distinct socio-economic groups (Huang et al., 2023). The unequal spatial distribution of greenspaces, which may coincide with existing socio-urban inequalities, including less potential for mobility and lesser accessibility to transport, goods and services, results in an environmental and social justice issue for vulnerable groups (Mears et al., 2019; Verheij and Corrêa Nunes, 2021; Wolch et al., 2014; Wüstemann et al., 2017). The meaning of “justice” is simply that different social groups have the right to have equal opportunities of accessing environmental benefits without discrimination, regardless of race, income or educational level (De Sousa Silva et al., 2018; EPA, 1998; Kabisch and Haase, 2014; Kato-Huerta and Geneletti, 2022). Kruize (2007) cites other authors that prefer using the more neutral term “environmental equity,” to similarly define equal distributional of environmental amenities (and burdens) among socio-economic groups.
Going back to the three dimensions discussed by Huang et al. (2023) and Kimpton (2017), it can be said that access to public greenspaces is potentiated or restricted by existing supply (both in terms of quantity and quality); the inability to access them due to mobility costs (time, distance, money) and different pressures from the demand side; and by personal factors including awareness, daily habits and the balance home/family life (Dai, 2011; Jennings et al., 2017). Supply is more than just the quantitative offer; that is, the ratio “green-area per inhabitant” often used as a reference for comparisons, or their spatial distribution. Qualitative characteristics have implications on usage, as size, maintenance, type of vegetation, amount of amenities or perception of safety (Saraiva and Teixeira, 2023; Verheij and Corrêa Nunes, 2021; Wolch et al., 2014). For example, looking at the Portuguese cities of Lisbon, Porto and Évora, Madureira et al. (2018) uncovered that larger size was less relevant for usage; people preferred smaller, cosier greenspaces, appreciating cleanliness, tranquility, good maintenance, benches for seating, water bodies and variety of plant life.
However, in a previous study, Madureira et al. (2015) had also pointed out that these likes and dislikes differ according to the social, cultural or economic backgrounds of the population. The discussions about what makes a good greenspace (Lindholst et al., 2016) or how much green is green enough (Wolch et al., 2014), cannot be dissociated from an understanding of the distinct socio-economic and morphological structures the city possesses, especially because the balance can easily shift. Increasing the number and the quality of greenspaces can make neighborhoods healthier and aesthetically appealing, but it can also lead to green gentrification (De Sousa Silva et al., 2018; Gould and Lewis, 2016; Mendonça et al., 2024; Pearsall and Eller, 2020; Verheij and Corrêa Nunes, 2021; Wolch et al., 2014). If increased cost of living and real estate values can only be supported by a given population segment, then other segments are driven away from the very same green amenities that were designed to benefit them. Cases of private greenspaces, for example, within gated communities (Matos, 2010) can further create social inequalities.
Recent literature clearly points to evidence of inequality in the distribution of greenspaces among different socio-economic and ethnic-racial profiles. In the US, Rigolon (Rigolon et al., 2018; Rigolon and Németh, 2018) shows that urban parks have better accessibility, quality and facilities in locations with higher average incomes and lower number of residents from minority groups. Comparing over 50 German cities, Wüstemann et al. (2017) found positive influence of income, age, education and whether there is a child in the household, on the available amount of urban greenspace. Surveyed residents belonging to the highest income class had considerably more greenspaces closer to home that those that earned less than 1.300 Euros monthly. The values were also higher for those with tertiary degrees, for older individuals and for households with children. Even when deprived areas are closer to greenspaces, the quality often seems to be inferior, as in the case of Sheffield, in the UK (Mears et al., 2019), or residents feel there is a poorer perceived accessibility and safety, leading to less frequent use, as in the case of Bristol (Jones et al., 2009).
In Portugal, few studies have produced such integrated assessments, comparing greenspace accessibility to socio-economic vulnerability, by types. In Lisbon, Pereira et al. (2023) analyzed walkability equity as compared to socio-economic status. Greenspaces are ranked second (after public transport accessibility) in terms of inequality; nearly 80% of the population had access to only 40% of urban green areas. Before, Luz et al. (2019) had seen that accessibility (alongside heterogeneity of vegetation density) were main reasons for residents not to visit greenspaces in their zip-code, even though there was no apparent relation between resident’s out-flux and their sociodemographic characteristics. In this case, a survey was used to determine sample household income class, whereas in the study of Pereira et al. (2023) a composite indicator was produced at census block level, combining census data (education, housing conditions, occupation), the Portuguese version of the European Deprivation Index, and property values as proxy for income.
For Porto, Hoffimann et al. (2017) uses statistical correlation and ordinal regression to test whether socio-economic differences in greenspace quality and accessibility are statistically significant. In this case, although most neighborhoods did have an accessible greenspace, mean distance increased with neighborhood deprivation. Furthermore, greenspaces closer to deprived neighborhoods had significantly more maintenance concerns, lack of amenities and equipment. Socio-economic deprivation was, like in Pereira et al. (2023), based on The European Deprivation Index using Census data, and greenspace characteristics were obtained through a survey. The following year, Graça et al. (2018) complemented that the uneven distribution of greenspaces across Porto’s socio-economic strata altered the capacity for providing ecosystem services. The parish of Campanhã, for example, with the lowest percentage of population with college degree and owner-occupied dwellings, was the one with greenest area amongst socio-economic strata, but because half are vacant lots and wastelands, among other reasons, it had the lowest estimates of ecosystem services delivery. Here, socio-economic strata were computed once again based on Census data, using, in turn, population with college degree, population age, building age, and building ownership/tenancy.
Methodology
This research follows the three-part analysis structure discussed by Kimpton (2017) and Huang et al. (2023). Namely, understand accessibility to urban greenspace in terms of quantitative indicators, a spatial approach and a socio-economic understanding. The literature has been converging this crossing, but it is still either more global (comparison between cities), so necessarily restricted in terms of spatial detail, or else more focused on other pertinent issues, like the distribution of ecosystem services and other environmental concerns. Existing papers also rely mainly on finding overall statistical correlations, the results mostly interpreted numerically but not reflected spatially, thus not illustrating and comparing how distinct areas (and consequently distinct socio-economic groups) distinguish themselves.
As represented schematically in Figure S1 of the Supplemental Material, this paper takes a micro-scale, socio-spatial vulnerability perspective, meaning that it builds from an assessment of how vulnerability is distributed–responding to the critiques of Huang et al. (2023)–and proceeds to determine its access to greenspace and greenspace types. This distinguishes this research from the previous, almost decade-old research in Porto (Graça et al., 2018; Hoffimann et al., 2017), also taking into account the evolution the city has had in the interim. Some of the imbalances may shift with the addition of over 100 hectares of green areas in the 2020s, so new assessments are justified. It should also be noted that greenspaces in this research are seen as amenities, destinations of interest, characterized by their geo-morphological rather than their environmental elements. Not that the latter are less important; rather that the former has been less the object of research. Therefore, we propose an assessment taking into account the morpho-spatial characteristics of greenspaces, that go beyond size and location, to consider features of the parks themselves (like if they possess sport facilities, following Hoffimann et al. (2017)), but also the morphological elements that surround them. Namely, how parks are inserted in the city, through the analysis of topological measures of street segments and place metrics, as explained below.
Greenspaces used stem from the compilation performed by Cavallaro (2024) of green areas of public fruition, based on Porto’s Municipal Masterplan. These public urban parks or gardens (PUPGs) encompass areas that are public and free of charge; which have either seating areas or grass; and either flowerbeds or grassy fields as vegetation, besides trees. These characteristics were considered the minimum requirements for the site to be both a public open space and a greenspace. The result was a total of 89 PUPGs. A new dataset was then created to mark the entrance to each space, in either the actual entrance in the case of enclosed PUPGs, or the initial point of every crossing/walking path, in the case of open spaces that can be crossed any time of day.
PUPGs assessment was made based on objective criteria, following Cavallaro (2024). Six elements were considered: type (by size), type of access, type of amenities/facilities, proximity to schools and two measures of segment centrality. Size considered the subdivisions in UN-Habitat (2018) and in the Urban Design Compendium (Davies, 2007), adapted to Porto’s scale. Neighborhood-level PUPGs were considered those up to 0.4 ha and a distance up to 400 m; Local-level PUPGs were those between 0.4 to 2 ha, and a distance up to 400 m; City-level PUPGS were those between 2 to 10 ha, and up to 1000 m distance; and finally Metropolitan-level PPUGS were considered those above 10 ha.
Type of access (enclosed, gated or not) was based on the definitions by UN-Habitat (2020a; 2020b). Amenities/facilities selected for assessment were compiled by the authors based on previous literature (Cavallaro, 2024), considering purposes related to social interaction, recreation, physical activity, comfort and relaxation. These include the existence of playgrounds, walking trails, grassy fields, seating areas, gym, restrooms, café and shops, picnic tables, sports facilities or water features.
Pedestrian street network used for accessibility and morphological analysis was edited and cleaned from an OpenStreetMap source file. Care was taken to check for possible disconnects, simplifying two-way streets and intersections, and removing semi-private segments as, for example, garage entrances. Using the Space Syntax QGIS plugin, the street network was further cleaned. Unlinks were checked to ensure all tunnels and overpasses were properly represented. Average walking speeds were considered to be 5 km/h, and service areas of 5, 10 and 15 minutes on foot were computed, following Stoia et al. (2022), as well as the proximity to schools.
Two further classic measures were computed. First, integration, “a normalised measure of distance from any a space of origin to all others in a system. In general, it calculates how close the origin space is to all other spaces, and can be seen as the measure of relative asymmetry” (Hillier and Hanson, 1984). And second, choice, which “measures how likely an axial line or a street segment it is to be passed through on all shortest routes from all spaces to all other spaces in the entire system or within a predetermined distance (radius) from each segment” (Hillier et al., 1986). Entrances to PUPGs were classified according to the respective values of integration and choice of the street segments that served them.
Based on all these characteristics, a Multiple-Correspondence Analysis (MCA) was performed to group PUPGs into distinct types. MCA is a type of factorial analysis which classifies patterns of relationships between categorical dependent variables, grouping them into types according to their common response modalities (Abdi and Valentin, 2007; Greenacre, 2017; Yelland, 2010). Six distinct types were reached using this method, G1 to G6 Vulnerability analysis was based on data from the most updated 2021 Census of the National Statistics Institute, at statistical section level (INE, 2021). Other authors have previously used composite indicators to spatially present vulnerability for the Portuguese cities of Porto and Lisbon (Hoffimann et al., 2017; Pereira et al., 2023). Here, complexity was added to the characterization of socio-economic and housing indicators, and a methodology was devised so that the process can be updated and replicated to other context and time-frames, allowing direct comparison.
Hence, variables considered were population age (considering classes: 0–24; 25–44: 45–64; over 65; and over 75 years old); level of education (no schooling; 1st and 2nd cycle; 3rd cycle; high school; higher education); population with economic activity (Employed; Unemployed); population without economic activity (Students; Retired; Stay-at-home); Employed population (considering degrees and sectors of qualification: unskilled; agriculture, industry and construction; administration and technicians; high-value professions); Foreigners/migrants (population with foreign nationality, or that have resided outside Portugal in the previous year); Household Size (1–2; 2–4; more than 5 persons); derelict buildings; and building occupancy (rented, or owner-occupied dwellings). Each variable was understood using geo-spatial statistics, and then another Multiple-Correspondence Analysis (MCA) was performed to develop individual micro-scale profiles. As a result, six profiles (A to F) were obtained, dividing the city into more and less vulnerable statistical sections.
Finally, the six vulnerability profiles and the six PUPGs’s types were crossed spatially considering the service areas computed, in order to respond to the research questions and understand and comment accessibility equity to Porto’s greenspaces.
Case study presentation
Porto is located in the northwest of Portugal (see Figure S2 in the Supplemental Material). It is the country’s fourth most populated city, with almost 232 000 inhabitants, but is at the core of the country’s second largest metropolitan area, after Lisbon, with over 1.7 million inhabitants (almost 20% of the country’s population) (INE, 2021). It is spatially limited to the South by the Douro River, to the West by the Atlantic Ocean, and is immediately surrounded by a series of closely articulated municipalities; Vila Nova de Gaia (the country’s third largest city), Matosinhos, Maia, and Gondomar.
The Metropolitan area lost around 23 000 inhabitants in the period between the last two Census (2011–2021), with the city of Porto itself loosing over 5000. In fact, Porto has been considered a shrinking city for some decades, with population only starting to pick up in the late 2010s (Sousa and Barcón, 2021). This has been a consequence of a steady urban regeneration process and a continuous rise in international popularity that started in the 2000s, especially after being 2001’s European Capital of Culture (Balsas, 2004, 2007). The arrival of Ryanair and Easyjet flights in the late 2000s, and the boosting of Airbnb in the 2010s (Chamusca et al., 2019; Fernandes et al., 2018), associated to a lower standard of living, led the city to an enormous rise in tourism, now closely reaching overtourism (Fernandes et al., 2023). Porto won several international tourism awards, as Best European Destination in 2012, 2014 and 2017 by the European Consumers Association, or the World’s Leading City Destination in 2022 and Best City Break 2023 by the World Travel Awards. However, this has hampered the
Porto’s population is mostly distributed in a ring around the historical city center, in and around major arteries as Constituição Street, Fernão de Magalhães Avenue, and Boavista Avenue, and then particularly in the northwest parish of Ramalde, and the northern parish of Paranhos. Over half of Porto’s population (52%) is active (i.e., between 25 to 64 years old), but one-fourth (26%) is over 65 years old, an increase from 23% in 2011 (INE, 2021). Children (0 to 14 years of age) constitute 11.4% of the population. There is an overall tendency of the more central subsections in having a higher percentage of older adults, whereas the more peripheral subsections show a higher percentage of youths, a tendency that is also visible when analyzing the contiguous neighborhoods immediately outside Porto’s urban perimeter.
Socio-economic vulnerability analysis
Socio-economic vulnerability profiles (source: own).

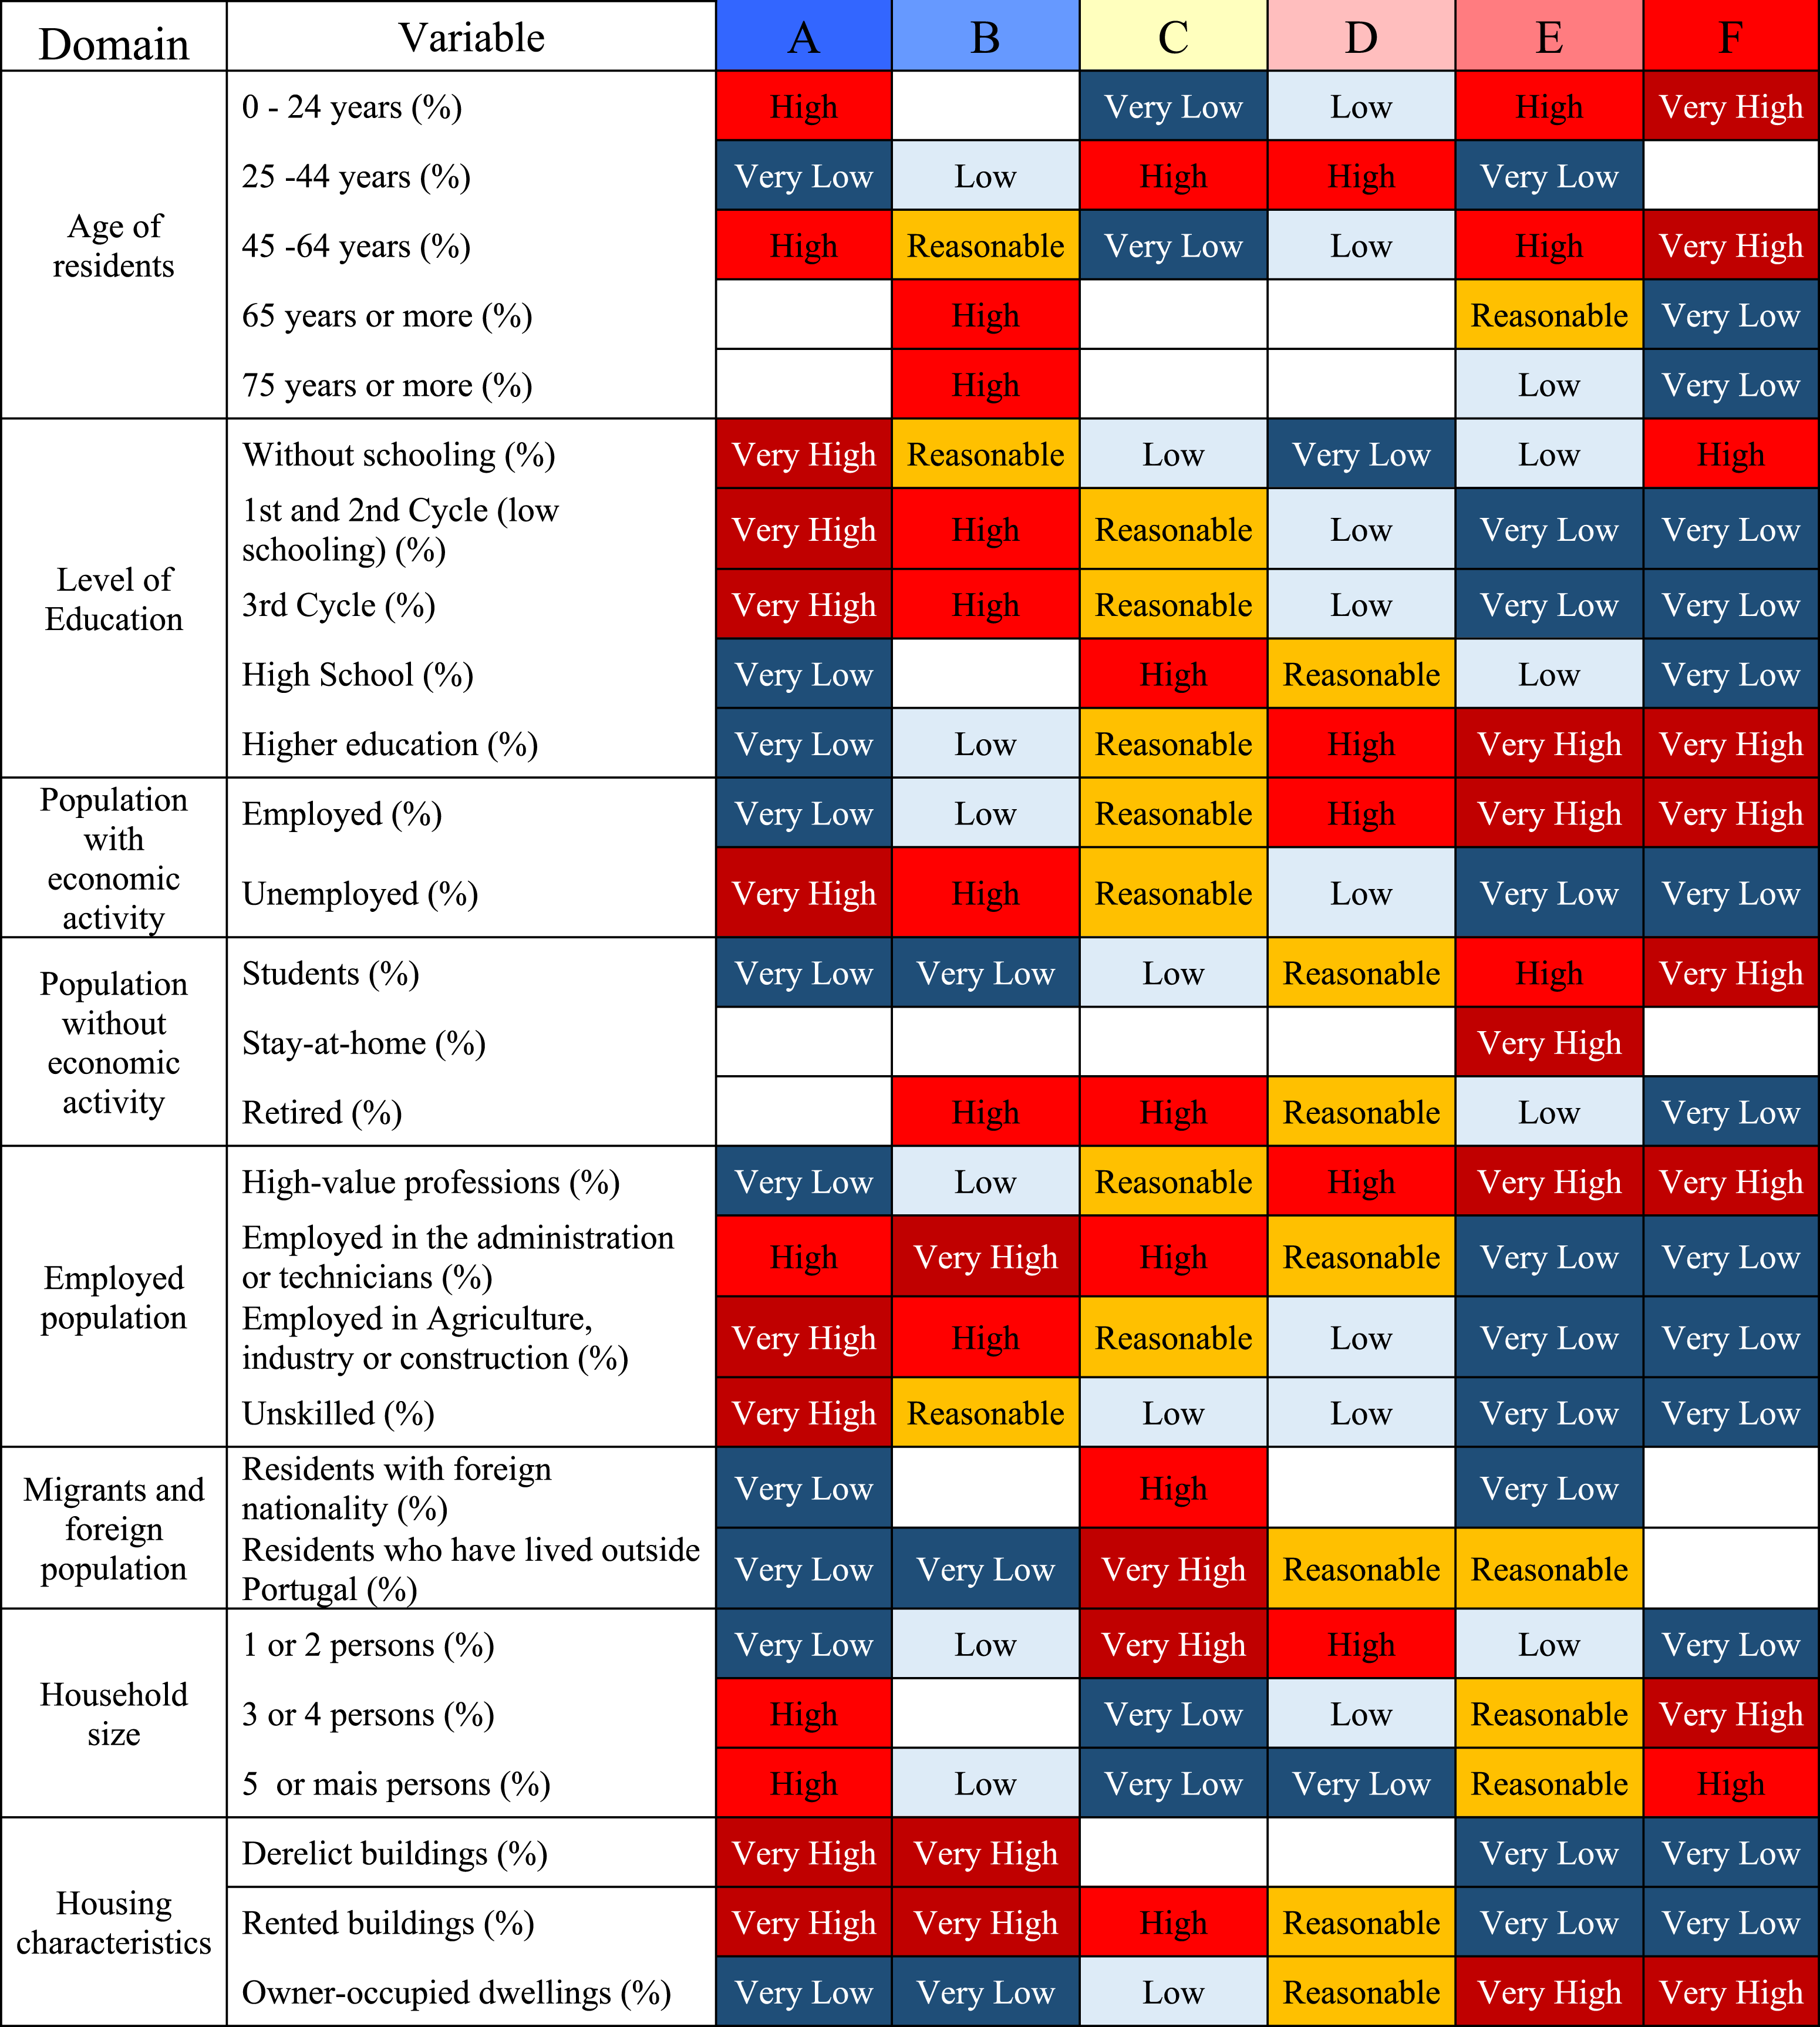

Socio-economic vulnerability profiles in Porto at statistical section level (source: own, based on Census data).
As reported schematically, statistical sections related to Profile A (the most vulnerable) correspond to areas that have, comparatively, very little young working population—it is mostly under the age of 25 or over 45–that possess low levels of schooling, few students and that have high rates of unemployment. The employed generally are not in the highest valued professions; there is a very high comparative percentage of unskilled workers, or those in the areas of construction, industry and agriculture. These inhabitants (16% of the population), generally live in large households (over three persons per dwelling) either signifying large families or, as is sometimes the case, overcrowding. The dwellings are generally rented and the houses have a significant degree of dereliction. These areas are more prevalent in the spatial edges of Porto, or else associated with social housing neighborhoods, such as the one clearly noticeable in the southwest part of the city.
Sections under Profile B (23% of the population) are generally in the first ring around the center. They contain very few youngsters and students; population is mostly over 45 and especially over 65 years of age and retired. Similarities with Profile A include low levels of schooling, high unemployment rates, low quality housing, tenancy, and low-high-valued professions, although here those employed in Administration and Technicians stand out.
The core of the city is occupied by sections of Profile C, corresponding to 21% of Porto’s inhabitants. Even though there are still older, retired dwellers, this is an area with mostly active population (between the ages of 25 and 44), without children, in generally rented households of 1 or two persons. This may be a sign of the attraction Porto’s renewed downtown has for working singles or couples, Portuguese or otherwise. Rehabilitation of buildings and dwellings has also promoted this trend with reduced housing areas and smaller housing typologies. The number of people with a university diploma is medium, but those with a high-school diploma is high, and the number of unskilled workers and students is low. This profile is also noteworthy for the comparative number of migrants and persons who previously have lived abroad.
Sections in Profile D are close to those of C, but with the tendency towards the city’s west, and in particular the place where the Atlantic Ocean meets the River Douro. It contains 21% of the population, mostly young adults (ages 25–44), with low number of youngsters, in small households constituted of one or two persons. Here, the population has high levels of education (high school and above), employment rate is high and generally in highly valued professions.
Finally, although sections of Profiles E and F can occasionally be seen elsewhere, they are predominantly in the western side, along Boavista and Marechal Gomes da Costa Avenues, the ocean’s edge and around the largest City Park. In sections of Profile E (16% of the population), live people with higher education, who are employed in the most highly valued professions, and who own their own homes. There is no clear household size pattern, yet these are generally families over three persons, between the ages of 45–65 and below 24, that are students. Curiously, this profile also has a high level of stay-at-home persons, which may indicate that one of the parents may not work. Furthermore, this profile has a comparatively very low level of foreign population.
Sections of Profile F, clearly surrounding the City Park and including only 4% of the city’s population, are again constituted by the highly educated, employed in professions of high value, who own their own home and belong to large households (over three persons). There is once more a prevalence of families with working population between 45 and 64 years of age, and those under 24. The number of uneducated inhabitants, and also of students, is high, signaling children and teens. The differences are few in relation to Profile E, except that here the trends are more clearly enunciated, making this the city’s less vulnerable profile.
Location and characterization of greenspaces
Figure 2 presents the location of the 89 PUPGs in the city of Porto, divided by a typology based on their size and proximity potential, as previously explained. It also shows the walking catchment area. Public Urban Parks and Gardens (PUPGs) in Porto, and walking catchment area (5, 10, 15 min) (source: own).
Characterization of different PUPGs in Porto (source: own).

Greenspace types in Porto (source: own).


Greenspace types and distribution in Porto (source: own).
Type G1 includes 7 PUPGs, often spatially close to the city’s ring road, yet in low choice and integration segments. They offer amenities like sports or children’s facilities, but they are concentrated away from schools. Type G2 contains 15 PUPGs, mostly small, that are also in very segregated locations of the network, with low integration and especially low choice. They are generally located close to residential areas, particularly those west and north of the city center. These green spaces are located in more recent and fragmented urban areas, where road segments are less connected to the surrounding city.
Types G3 and G4 are situated in Porto’s densest and most consolidated areas. Type G3 includes 42 PUPGs. The majority are of neighborhood level, although they are also small and don’t have amenities. They can be distinguished from G1 and G2 because they are located in areas of local centrality, spanning practically all quadrants of the city. Due to this, these spaces play a key proximity role in the established network. Type G4 corresponds to 13 PUPGs, which are mostly local and tend to be found in areas of even higher local and global integration, as well as choice. These are generally squares or gardens without grassy fields. They are well distributed throughout the more consolidated urban areas, including the inner ring and the surrounding built-up areas. Their area of influence is potentially larger than that of G3.
The G5 and G6 greenspaces are larger and more functional than the previous. Type G5 includes just 10 PUPGs. These are city-level parks with amenities, including cafés, toilets, water fountains and trails, and many are closed at certain hours. These parks are located closer to River Douro, or in the city’s northwest. They include important landmarks such as the Crystal Palace Gardens and the Covelo Gardens. Finally, Type G6 includes the remaining 2 PUPGs. These are the two major metropolitan city parks: the City Park to the west and the Oriental Park to the east. They occupy a large area, are located in places with high potential for pedestrian traffic and have amenities for long-term use, such as picnic tables and trails.
Crossing vulnerability profiles with accessibility to different PUPG types
Service areas of 5, 10 and 15 minutes walking were computed from the entrance points of each PUPGs, divided by their types. It should be assumed that as PUPGs increase in scale, they are catering to a larger population segment than just those that can reach them on foot. Even so, for the sake of this paper’s argument, and of the proximity chrono-city, we will transversely consider walking accessibility. Figure S3 in the Supplemental Material shows the catchment for the six types of greenspaces, revealing obvious geographical differences.
How these catchment areas relate to the six profiles of socio-economic and urban vulnerability are displayed in Figure 4. As previously discussed, overall population is more or less evenly distributed between the first five profiles (15–22% each), with only the highest-end profile amounting to just 4% of the population (Figure 4(a)). However, as it can be seen in Figure 4(b) to 4(d), the distribution is not as even when looking at the proximity to greenspaces types, which means that there are territorial disproportions; some population groups are over- or under-represented. Percentage of inhabitants by socio-economic profile (a) in the city; (b) up to 5 min walking from the six types of PUPG; (c) 5–10 min walking; (d) 10–15 min walking (source: own).
The most vulnerable profiles, Profile A and Profile B, have a visible under-representation close to greenspace G4: squares and gardens in highly accessible and busy places in the city center. Curiously, there is an inversion when comparing with the two major urban parks (Greenspaces G6). Both profiles amount for 38,5% of the population in 5-min walking, mostly due to the Oriental Park, which shows that the Municipality’s investment in creating and expanding it greatly contributed to the access of more vulnerable segments.
Profiles C and D, however, are not represented at all in the 5-min walking interval from the two G6 parks. Their greatest affinity is in relation to PUPGs G3 and G4; that is, the ones that, albeit smaller and with fewer or no amenities, possess greater accessibility, both at local and neighborhood level. Together, Profiles C and D account for almost 60% of the population within 5-min from a G4, and for almost 50% from a G3. These employed, educated young adults, living alone or with another person, may not be able to afford prime locations, but are able to be placed in locations of high accessibility value.
The highest-end socio-economic profile, Profile F, albeit amounting to just 4% of the total population, accounts for 13% within 5-min from the G6 major parks. Together with Profile E, they represent 30% of the population in each of the three analyzed time periods, which shows that, even though green gentrification is not necessarily occurring in large part due to the influence of the Oriental Park, there is a clear affinity of these profiles to the City Park in the west. Profile F also shows association to PUPGs G1; green areas with amenities but with low accessibility, signaling, for example, single family neighborhoods where high-end families dwell, especially to the west.
Table 4 summarizes the findings, explaining them in a simpler way to decision-makers: - The most vulnerable (Profile A and B) are able to reach the large-scale, metropolitan-level Oriental Park (confirming the pertinence of this investment), as well as other city-level parks, but are clearly not close to those in locations that possess great centrality or travel-through potential in the network. Their greenspace needs seem to be catered, but they are unable to live in prime, central locations. - The contrary happens with socio-economic Profiles C, composed of young working adults, generally without children, who can rent their homes in locations of high accessibility and so are close to smaller greenspaces in high integration and choice axes (G3 e G4). Profile C is under-represented, especially in short distances, to greenspaces in urban segregated areas (G1 and G2) and city-level and metropolitan-level (G5 and G6). - Profile D (young adults with higher education, high employment rate and skilled professions, small families) show some affinity to smaller PUPGs (G2 and G4); however, this means that they are unable to reasonably reach the two metropolitan parks on foot, but being this the more flexible population segment, public or active transit solutions may/should be equated. - Socio-economic Profile E, which represents middle-high class families with children, has the most even distribution between all the greenspace types, with slight affinities to both large and small, and both segregated and central spaces. This type is spread out in the city and can select the locations it sees fit. - Finally, the least vulnerable Profile F has a very disproportional affinity (4 times its weight) to the large metropolitan parks, due to the clear occupancy to the west, close to the main City Park. This group can choose where to locate, so it is also found in segregated areas, but close to greenspaces with amenities (PUPG G1). For that reason, they do not need to be close to city-level parks with amenities, hence a clear absence of this profile. Summary of findings (strong affinity between a vulnerability profile and PUPG type marked green, low affinity marked red) (source: own).


Discussion and conclusions
The tri-part analysis presented allowed understanding how different socio-economic groups fared in terms of walking proximity to distinct types of greenspaces, in the city of Porto, Portugal. The literature assumes such accessibility as an indicator of social justice (Dai, 2011; Wolch et al., 2014; Wu et al., 2018) as often it is seen that socio-economic deprived groups have less opportunities to travel to amenities and less opportunities to choose where to live and where to work. Consequently, they may be neglected in terms of access to quality green infrastructures (Mears et al., 2019; Wolch et al., 2005).
Performing integrated, multivariate analysis, can lead to more comprehensively addressing social and territorial cohesion issues associated to nature-based solutions and environmental justice (Cousins, 2021; Kato-Huerta and Geneletti, 2022; Mendonça et al., 2021). Furthermore, focused, detailed analysis of the urban realm are required, because vulnerability and socio-economic conditions possess distinct territorial patterns at the micro-scale.
Distinct profiles were created, both of socio-economic vulnerability and types of greenspaces, thus crossing the quantity, spatial and social approaches existing in the literature. Different types of greenspaces possess different geographies within the city, as do the vulnerability profiles. This means that distinct groups have greater proximity to certain types of greenspaces, but poorer association to another. The most vulnerable groups, unlike what the literature has shown in other cities, are not necessarily farther from the greatest green opportunities when considered as a population unit. This is in large part due to Porto’s Oriental Park (ostensibly in one of the city’s poorest areas) that was inaugurated in 2010 and later expanded. However, given that these groups are also geographically dispersed, it is important that these differences within profiles not go unnoticed. For example, the Ramalde area, which is located to the northwest of Porto, has neither good access to city nor metropolitan parks. Furthermore, even if the population in Porto is relatively evenly distributed across different levels of vulnerability (something that may not occur in other contexts), that distribution is not equal when factoring in the different types of PUPGs. The population in the most vulnerable profiles (A and B; 38% of total) accounts for over 35% of the inhabitants over 15 minutes away from PUPGs 1, 2, 5 and 6 (a similar representation); but over 62% of inhabitants over 15 minutes away from PUPGs 3 and 4 (a clear over representation), those in locations of local centrality and travel-through movement. This research has given some interesting insights into possible demands. For example, a portion of the vulnerable Profile B has good access to the city and metropolitan parks and given that they have a higher than average percentage of older adults, this may indicate the need to implement programs and amenities targeted to this age group. In the same rationale, profiles C and D have higher percentages of working adults, who possibly spend a lot of their time at work and may not use the PUPGs around their residences during work hours, which can point to different patterns of use for these spaces. With the rise of remote work-from-home, this group may also suddenly spend more time in the public spaces around their homes. On the other hand, Profile B, with higher than average number of retired people, has poor access to PUPGs which offer more amenities (as G4), something that can direct decision-makers on how best to amend these needs.
In future research, subjective criteria should be included in the definition of the greenspace types, such as perceptions on maintenance and cleanliness. Another important factor is the fact that distinct groups have different social needs, which should be further assessed. This analysis should also be extended to cover the entire metropolitan area, where imbalances are likely to be more pronounced.
Supplemental Material
Supplemental Material - Assessing equity in the accessibility to urban greenspaces: A socio-spatial vulnerability perspective in Porto, Portugal
Supplemental Material for Assessing equity in the accessibility to urban greenspaces: A socio-spatial vulnerability perspective in Porto, Portugal by Miguel Saraiva, Fernanda Cavallaro, Teresa Sá Marques, Barbara Teixeira, Gabriela Ribeiro in Environment and Planning B: Urban Analytics and City Science.
Footnotes
ORCID iDs
Funding
Declaration of conflicting interests
Data Availability Statement
Supplemental Material
Author biographies
References
Supplementary Material
Please find the following supplemental material available below.
For Open Access articles published under a Creative Commons License, all supplemental material carries the same license as the article it is associated with.
For non-Open Access articles published, all supplemental material carries a non-exclusive license, and permission requests for re-use of supplemental material or any part of supplemental material shall be sent directly to the copyright owner as specified in the copyright notice associated with the article.