
Abstract
Keywords
Introduction
Exercise takes many forms, and ranges in physical strain, body engagement, and thermal strain. Activities can range from low- to high-intensity, such as a low-intensity walk, to extreme sports such as mountain free climbing. The commonality of these activities is that when the body reaches a high enough metabolic level it will produce sweat.1,2 Sweating from eccrine glands, which are responsible for body temperature regulation, is a powerful mechanism of thermal regulation that is unique to humans, it’s one of the main reasons humans can perform extraordinary feats such as running marathons. 3 The natural cooling mechanism of sweat, is often able to compensate for the heat generated from exercise. However, clothing can hinder the cooling via evaporation of sweat to various degrees depending on textile characteristics, such as fiber type, thickness, air permeability, and others. Fabric selection can impact several relevant properties such as water transport and evaporative resistance. 4 Through standard test methods, it is possible to evaluate the dry and evaporative heat transfer properties of fabrics to determine the predicted cooling that could occur during wearer interaction. 5 However, these test methods often utilize a single sweat producing period,5,6 which does not include information on the resting phase. Even when such a phase was included7,8 it involved only one cycle, and this may not be completely representative of “stop–go” activities such as hiking or cycling where an individual may complete several bouts of work–rest sequences throughout the duration of the activity. Therefore, these gaps were addressed using a sweating guarded hot plate (SGHP) test that incorporated several time sequences of work–rest as an extension to current tests.8,9
Fabrics that are commonly worn during exercise, polyester, wool, and cotton,7–9 were selected to compare relative cooling effects. These fiber types exhibit different hydrophilicities and exotherm properties 7 and therefore provide a platform to determine the sensitivity of the modified test protocol. Cotton is known to be hydrophilic, meaning that it has an affinity to water, while polyester is more hydrophobic, meaning it does not have an affinity to water and does not absorb water well. 10 Additionally, wool was selected since it exhibits hygroscopic properties, which means the outside of the fiber structure has more hydrophobic behavior, but the core of the fibers is hydrophilic in nature. 11 These materials are often used when studying the thermal properties of fabrics and have been found to give different output levels of cooling performance.7,12–14 Fiber type is one of the fabric properties which affect water uptake and subsequent cooling, in addition to fabric structure and resultant physical properties, such as thickness, porosity, and moisture vapor transmission rate (MVTR), which can have a significant impact on the thermal properties of different fabrics.15,16 For this reason, all the fabric samples in this work were constructed in a simple single jersey structure to mitigate some of these factors.
Standard test methods like ASTM F18689 are useful for capturing the evaporative resistance of fabrics but are mostly useful for evaluating “steady state” conditions. Other test standards like ASTM F36286 can capture the dynamic behavior of a fabric during sweat secretion in different phases. Using these tests, the respective wicking behavior of the fabric and the resultant cooling can be explored to some degree. However, as a standard, these tests are typically conducted in isothermal conditions, and not in common environments. We proposed a method for evaluating and comparing the cooling of fabrics during sweating while in non-isothermal conditions while still having the capability to isolate the evaporative heat loss. 17 However, there has not yet been developed a test that considers and combines multiple work–rest sequences and explores performance of different fiber types during those conditions. The previously mentioned ASTM standards also do not give guidance on performing tests that incorporate multiple work–rest cycles on the SGHP. Therefore, by using the area-under-the-curve (AUC) method proposed by us before, 17 this study was able to assess the evaporative cooling of different fiber types during three different sequences of work–rest cycles. This research brings forward relevant information on textile evaporative cooling that captures the dynamic nature of stop–go sports and its potential impact on the wearer.
Methods
For this series of tests, three fabric types were tested on the sweating guarded hot plate (SGHP, Thermetrics, USA) with a test chamber conditions and wind speed of 21°C and 65% rh, and 1.0 m/s respectively. The SGHP was heated to 35°C and set to a sweat rate of 550 g/m2/h. In these experiments, there was no semi-permeable barrier between the plate and the fabric and thus the water simulated sweating by spreading in and under the fabric, as well as being absorbed by the fabric and evaporating from the plate and/or the fabric following the principles of the ASTM F3628 method. 6 The characteristics of the samples are presented in Table 1.
Sample characteristics.

The experiment consisted of three different timelines of simulated sweat–non-sweat sequences (or work–rest). A total of 27 tests (three replicates) were carried out with the following test timeline parameters:
Basic: 20 min acclimatization, followed by three cycles of 30 min sweating and 30 min “non-sweating.”
Variant 1: 20 min acclimatization, followed by three cycles of 20 min sweating and 20 min “non-sweating.”
Variant 2: 20 min acclimatization, followed by three cycles of 20 min sweating and 10 min “non-sweating.”
To compare these materials during the different sequences, the Area Under the Curve (AUC) was calculated after the baseline (dry) heat loss was subtracted from all results to isolate the evaporative cooling. 17 The baseline was determined in the minutes 15–20, prior to the first sweating cycle, while stable heat flux occurred. The AUC was assumed to be the total additional evaporative cooling energy that occurred during the respective sweating and non-sweating periods. The AUC values were calculated for each timeline variant for every sweating and non-sweating period, three sweating, and three non-sweating periods. For the statistical analysis, the factorial effects model with multiple crossed factors was used to determine the significant effects.
Results
In Figure 1, the average results from each of the fabrics in the three different protocols is shown, after correction with the dry heat loss. The results show a clear increase in heat loss due to sweating in all fabrics, with clear differences between the fabrics. The fabrics all show some level of reduction in heat loss due to dry-out as well, but with clear distinctions between the fabrics. In human thermoregulation, this is the point where the body no longer requires cooling but demonstrates the increase of cooling in the respective phase.

Average heat flux curves of samples at different sweat-non-sweating phases over complete time trials. (a) Basic: 30/30 sweating/non-sweating; (b) Variant 1: 20/20 sweating/non-sweating; and (c) Variant 2: 20/10 sweating/non-sweating sequences.
Figure 2 contains the bar plots of the AUC values calculated after the adjustment with the dry heat loss. The error bars are 95% confidence intervals. Like Figure 1, Figure 2(a) is the basic sequence of 30 min cycles, the middle (Figure 2(b)) is the first variant of 20 min cycles, and the bottom (Figure 2(c)) is the second variant of the 10 min non-sweating cycle. The data shows consistent energy losses for the cotton fabric (CL), a higher variability for the polyester fabric (PB) and a gradual increase for the wool fabric (WB). These trends are specifically strong in the 30 min sweating–drying cycles and the 20 min sweating–drying cycles. During the shortened 10 min non-sweating time, there was similar variability across all fabrics and cycles.

AUC values calculated after the baseline (dry) heat loss adjustment (a–c). Areas under the curve are presented for each cycle part and separately for the sweating and non-sweating phases.
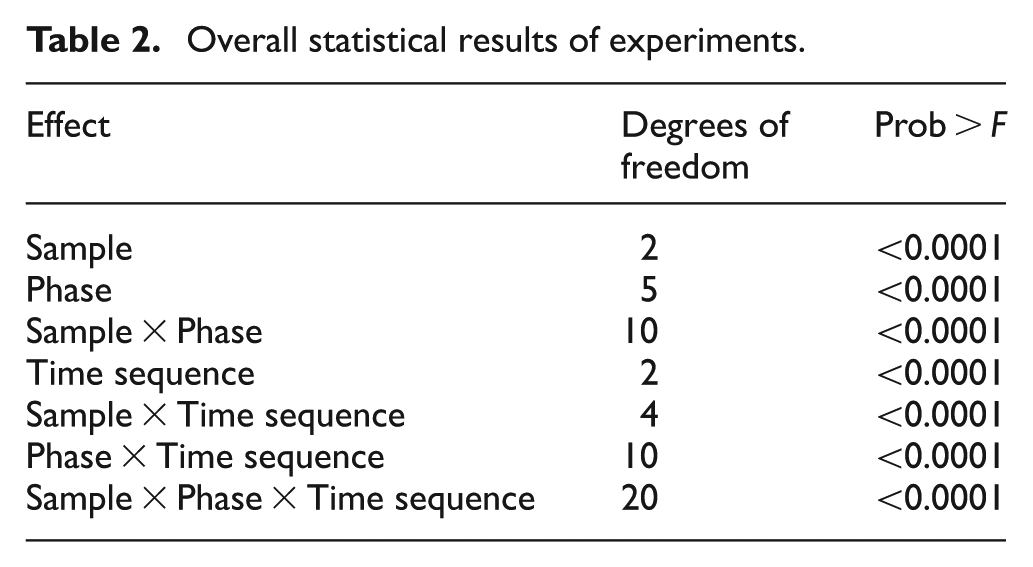
The statistical analysis presented in Table 2 shows the main effects, sample, phase, and time sequence (Basic, Variant 1, Variant 2), demonstrating a significant effect. Additionally, interaction effects were observed between the main effects, which means the AUC values would have different trends depending on the level of main effects. Consequently, there were significant differences between the three cycles for all fabric and fiber types.
Overall statistical results of experiments.
From the heat plots it is possible to estimate the variability in the curves from the start of the “activity phase” to the end of the final “rest phase” by calculating the correlation coefficient
Linearity (

As the correlation coefficient is a quantitative measure of variability it serves as an indication of the variability on responses across the three sweating-drying phases. These results show that the wool fabric exhibited a much lower variability in cooling effect throughout all three cycles whereas cotton and polyester showed a high degree of variability as expressed by their much lower
Discussion
It is important to contextualize these experiments based on the type of scenario. During these tests, presumably all the sweating periods on the SGHP correlate to metabolic activity of the user during the “work” portion of exercise that would need to be compensated for by evaporative heat loss via sweating. However, the non-sweating period would be representative of the “rest” period. Based on these descriptions, physiologically, the body no longer requires cooling from sweat evaporation and any cooling during the rest phase of the test would result in the “after-chill” effect felt by the user. The after-chill effect is excess cooling of the body and could therefore cause discomfort to the wearer and as such the sweating and resting phases would not align entirely with the exercise periods. Realistically sweating would begin after the exercise/activity has started and the body has warmed up and subsequently the sweating would stop during rest after the body has cooled down. 1 Therefore, a sweat/no-sweat bout on the SGHP would be analogous to a work–rest bout in a stop–go sport setting; however the sweat cycle will be shifted in time as sweat would still be needed during the initial part of the rest period, when the body is warm. The key assumption here is that the cooling during the drying period is not needed as the body would no longer have a physiological need for cooling. However, there may be unique subjective discretion depending on the preferences of the user, but this cannot be evaluated on the SGHP.
It was observed in Figure 1 that samples PB and CL exhibited a similar increase–decrease pattern in heat flux in the basic 30 min sequence that correlated with the sweating and non-sweating periods of the SGHP, but somewhat shifted in time, while sample WB demonstrated a continual, yet gradual, increase in heat flux throughout the entire test. WB exhibited this behavior in the 20 and 10 min sequences as well (Variants 1 and 2, respectively). The basic 30 min sequence generally demonstrated higher heat flux values during the entire test more than either of the variants. For example, at minute 50 of the basic sequence the heat flux was 90 W/m2 while in the 20 and 10 min sequences it was 80 W/m2. This was expected as there was an extra 10 min of sweating in the first bout of the basic sequence, which equaled 30 total extra minutes of sweating at the end of the test against Variant 1 and 2 sequences. Sample CL demonstrated the greatest variations, with distinct highs and lows throughout the time intervals, but resultantly yielded a lower decrease in heat flux values as the non-sweating time was shortened. Interestingly, the patterns of heat flux for sample PB varied significantly between Varianta 1 and 2. In Variant 1, there was a consistent increase through the second sweating period, but then sample PB showed a significant decrease in heat flux at minute 100 during testing close to the same value of CL at 50 W/m2. This pattern was found to be consistent (repeatable) across all three replicates tested and we found no clear explanation why it occurred. In Variant 2, there was a similar increase in heat flux as the first variant, but this continued through the final drying period of the test. The second and third non-sweating periods of sample PB during Variant 1 aligned more with the behavior of sample CL, like in the basic sequence. But it’s difficult to say if this would have persisted if the test consisted of more than three bouts of work–rest. This could possibly be linked to the initial absorption of liquid being delayed by the hydrophobic nature of the polyester fabric, which subsequently could delay the drying as well.
There was a notable delay between sweating commencing and heat flux increasing in samples PB and WB in all the tests. Since both PB and WB fiber types exhibit hydrophobic behavior, albeit to different degrees, this could be one possible explanation, while the hygroscopic properties of wool, exhibiting exotherm effects during the water vapor absorption phase, are most likely the cause of the delayed and slowed steady heat flux increase throughout the test.
All the tests indicated that WB gave a consistent increase in cooling regardless of the work–rest bout duration, with reduced after-chill in the first cycles. This may be advantageous in scenarios where limited cycles are conducted in cooler environments, where after-chill might be an issue. In hot environments, over multiple cycles the wool exhibited similar cooling to the other fabrics. Overall, the data suggests that during high heat strain with high sweat production and/or limited evaporative potential, all fabrics tended to converge at a level where the fabrics were totally wetted, and evaporative heat loss was maximized. This study does not provide insight into the effects of fabric structure that could affect maximum evaporative heat loss under such conditions as these were all jersey knits. This observation aligns with earlier results. 5
Instead, the first bout of work may not yield the required evaporative heat loss to balance the metabolic heat production in sample WB. A previous human subject study did not show significant thermal sensation differences between subjects in such an early exercise phase, 7 but the data does suggest this could lead to increased heat strain during activity in hot environments. After sweating has stopped, however, that is, during the drying phase, the wool (WB) samples exhibited limited evaporative cooling whereas the cotton (CL) and polyester (PB) samples showed much higher cooling. Thus, samples PB and CL would expectedly yield a more prominent after-chill feeling during the rest periods of exercise compared to WB—especially as the rest period duration decreased. This attribute of WB could be desirable in cooler and windier conditions, based on the preferences of the user. In warm or hot environments, it would likely be more advantageous to give an increased sense of cooling. Since it’s assumed in these tests that the drying phase requires no cooling via sweat evaporation, the preferences of the individual would likely play a significant role. As a result, it may be worthwhile to further explore these dynamic cooling and non-sweating scenarios with a variety of subjects under different environmental conditions, for example in stop–go sports especially in cool conditions. The data from these experiments, in conjunction with previous work, suggests that fiber types can have a significant impact on thermal strain and thermal comfort, which may be different under different environmental conditions, even though these effects are transient in nature.
The AUC values in Figure 2 similarly demonstrated in the basic time sequences that WB provided an increased level of cooling as the test time duration continued. The wool sample (WB) demonstrated higher values of cooling during the third sweating phase than the other samples, 5000 J/m2 for WB vs. 3200 and 4300 J/m2 for PB and CL respectively. Statistically significant differences were seen between WB and PB. During the third resting phase, WB exhibited an AUC (5700 J/m2) value higher than CL (4500 J/m2) and similar value to sample PB (6800 J/m2). This indicates that wool exhibited similar total cooling in the third bout of this sequence. Interestingly, sample PB demonstrated by far the most dynamic changes between the work and rest period, as much as 4520 J/m2 between the first cycle in the basic sequence, which indicates that the wearer would presumably experience a quite significant “after-chill” effect when wearing PB after the first exercise bout. This was observed in every cycle to a lower magnitude—the lowest being in cycle 2 that resulted in a difference of about 1100 J/m2. Therefore, the after-chill sensation would likely be lower in the subsequent bouts. It should be noted here that we used a basic hydrophobic polyester fabric here, without a wicking treatment. In previous studies, we have shown that polyester with wicking treatments would exhibit similar behavior to the CL fabric, with possibly even faster responses and higher maximum cooling peaks.
After the first sweating cycle, sample CL gave the most consistent level of cooling throughout all phases of the test. The highest value observed was 4600 J/m2 in the first non-sweating cycle and 4200 J/m2 in the second sweating cycle—only a difference of about 400 J/m2. Statistically, there were no differences within the sweating cycles and non-sweating cycles for CL.
In the first variant (20 min time sequence), sample WB showed significantly higher cooling than the other samples during the third sweat period but no difference in cooling during the third non-sweating period. This suggests an advantage of the wool in the final work period and lack of disadvantage for the final rest period. Sample PB again demonstrated the highest changes between the sweating and non-sweating period, but the largest gaps were between the first sweating and dying phase and the second drying and third sweating phase; both demonstrated a difference of about 2450 J/m2. Sample PB would again give a strong after-chill sensation during the rest periods.
The second variant showed quite different patterns, as seen in Figure 2, but this was due to the shortened non-sweating period. WB provided significantly lower cooling during the final work period than PB and CL samples, 3000 J/m2 lower than PB. But WB also provided the lowest after-chill in the final rest period, although only statically lower than PB. PB demonstrated an increase of AUC values through the second sweating period then a decrease for the second non-sweating cycle, followed by a quite large increase to the third sweating period—a change of about 3200 J/m2. Variant 2 yielded some unusual trends in the data when looking at the AUC Values, but the general patterns from Figure 1 were mostly consistent except for sample PB. The basic sequence and Variant 2 suggest that WB would perhaps be advantageous in scenarios where more cooling would be desired in the later phases, with limited after-chill during brief rest periods. It is very likely, however, that the WB samples would take a significantly longer time to completely dry if the fabric was completely wetted. For example, when hiking, more cooling would possibly be desired in the latter stages of a hike as the increase in elevation becomes more extreme as opposed to at the base of a mountain. The main concern is lower cooling during the work periods, especially in the first two cycles, but for relatively active individuals, with limited sweating activity time, this may not be a concern. It should be noted that PB gave by far the most variation when analyzing Figure 2 in almost every scenario, and therefore the expected cooling from this sample may be less reliable than either the cotton or wool sample.
To capture the reduction in variability as an expression of the buffering effect of fabrics, we analyzed the correlation coefficients, expressed as
From the results, it may be appropriate to say that wool has superior buffering of heating and cooling compared to polyester and cotton, as exhibited by reduced differences in heat loss between the sweating and non-sweating periods. Polyester and cotton could exhibit significantly higher after-chill sensations which would lead to discomfort for the wearer, an observation made in previous work. 17 It also appeared advantageous to explore multiple work–rest cycles as materials may not exhibit the same behavior in multiple bouts as in the first bout, which would be the case if standard test protocols (such as ASTM F1868) were followed. In addition, and according to the F3628 test method precision and bias statement, “an interlaboratory study has not been conducted. This method will need to progress more before this can occur.” 15 However, to substantiate the reproducibility claims test replicates were conducted at the Textile Protection and Comfort Center, where comparable results to the preliminary results were obtained indicating reproducibility seen in Figure 3.

Reproducible average of heat flux graph showing the performance over the successive stop–go cycles.
Within the scope of this paper the
Conclusion
The data shows that wool consistently gave a steady increase of cooling together with thermal buffering, regardless of activity, timeline, or time-sequence pattern. The same test methods showed that polyester and cotton generally produced high cooling during rest periods. During non-sweating periods, when sweating and cooling are likely not required by the wearer, the high AUC values of cotton and polyester indicate that discomfort from after-chill may occur, resulting from the shifts in the fabric’s thermal conductivity over time. Therefore, the AUC is not solely related to evaporative cooling but is also tied to changes in the thermal conductivity of the fabric. As the water is around and within the fabric structure, air is displaced by water in parts of the fabric structure. As water has a much higher thermal conductivity, this will increase the thermal conductivity. As the fabric samples are not fully saturated with water, this effect is not expected to be dominant. 5 Additionally, a test with multiple repetitions of a work–rest scenario outlined the differences in cooling between the different fiber types—with some unique observations as the rest period duration was shortened. Irrespective of time sequence, multiple work–rest scenarios provided additional information which would be limited if a single sweating/non-sweating cycle was observed.
The option to select alternative scenarios could enable users to emulate the specific stop–go sports activity of their own test interest. A possible compromise could be a test with multiple options, used individually or in tandem, which could then be altered to increase similarity to a specific scenario; however, a baseline test standard must be included.
A 30 min sweat and 20 min drying could possibly be an option based on the results of these tests. One other consideration is different sweat-rates which would imply different metabolic activities during various sports. It is suggested that a manufacturer, targeting specific sporting scenarios, will benefit from a modest metric by which a fabric can be specified. This research includes fabrics with similar fabric thicknesses and structures (see Table 1) and characteristics which should be a major consideration for future comparative testing of sportswear fabrics. In scenarios requiring thermal buffering and minimal post-exercise chilling, the linearity of the heat flux curve, utilizing the