
Abstract
Keywords
Key points
• Weightbearing computed tomography (WBCT) is less prone to perspective distortion of the lower limb due to lower limb malrotation, operator-dependent bias, and bone superimposition. Additionally, WBCT allows for capture of 2-dimensional (2D) and 3-dimensional (3D) measurements with better interobserver reliability than conventional radiography.
• WBCT’s rapid evolution includes continuous refinement of different parameters that help diagnose, classify, evaluate, and appraise treatment options in progressive collapsing foot deformity (PCFD) patients.
• Recently, several WBCT parameters were validated as diagnostic tools with reasonable sensitivity and specificity to differentiate between progressive collapsing foot deformity (PCFD) and normal individuals.
• WBCT could help evaluate different classes of PCFD deformity (class A, B, C, D, and E).
• Foot and ankle offset (FAO) is the most specific parameter to diagnose PCFD, whereas middle facet subluxation (MFS) is the most sensitive.
Introduction
Flatfoot represents a spectrum of deformities affecting joints of the foot and ankle. Early literature described flatfoot deformity as flattening of the medial arch of the foot. 24 Recently, the development of more advanced imaging techniques has enabled 3-dimensional (3D) analysis of different joints of the foot and ankle, which provides better insight into flatfoot deformity. 32 Recent advances have also led to the development of the concept of progressive collapsing foot deformity (PCFD).35,38 In 2020, a consensus group proposed PCFD as a new nomenclature associated with a classification system that could better portray the different presentations of flatfoot deformity.10,38
WBCT has been a reliable tool when evaluating complex foot and ankle conditions. 33 This has been specifically demonstrated in the setting of PCFD.11,34 In comparison to conventional plain radiography, WBCT is less prone to perspective distortion of the lower limb because of lower limb malrotation, operator-dependent bias, and bone superimposition. 15 Additionally, it allows for capture of 2-dimensional (2D) and 3D measurements with better interobserver reliability.9,18,26
This manuscript aims to summarize key WBCT metrics used in evaluation of PCFD cases, highlighting their clinical utility and relevance to surgical planning.
2D Measurements
The axial plane
This plane is parallel to the horizontal platform with the horizontal edge of the images aligned with the first metatarsal axis. 11
1.
2.
The Coronal Plane
This plane is perpendicular to the horizontal platform. The horizontal edges of the images are aligned with a line perpendicular to the bimalleolar axis of the ankle. 11
1.
2.
3.
4.
5.
6.
7.
8.
9.
10.
The Sagittal Plane
This plane is perpendicular to the horizontal platform. The horizontal edges of the images are aligned with the longitudinal axis of the second metatarsal. 11
3D Measurements
Foot and Ankle Offset (FAO)
FAO is a 3D biometric WBCT measurement and has been demonstrated as a good overall alignment assessment in PCFD and other foot deformities. It quantifies the relationship between the tripod of the foot (first metatarsal, fifth metatarsal, and calcaneus) and the center of the ankle joint (Figure 1).

Foot and ankle offset (FAO) semiautomatic measurement. Using the 3 planes (axial, sagittal, and coronal), the most plantar voxel of the first metatarsal, fifth metatarsal, and calcaneus are detected (A, B, and C, respectively). The most proximal as well as central voxel of the talus is detected in both coronal and sagittal images (D). The software calculates the center of foot tripod (M1-M5-C) and the expected position of the ankle joint center (E and F). The displacement percentage in patient’s talus position (T) in relation to foot tripod (M1-M5-C-F) is determined as the FAO (E). 34
In other words, the FAO represents the axial offset between the weightbearing centers of the ankle joint and the bisecting line of the foot tripod. 34 Mean FAO was found to be 2.43% (95% CI 2.05-2.82) in the largest reported database of WBCT measurements in patients with various foot and ankle conditions at a single academic institute. 43
In a study by Lintz et al,
39
the authors found that the mean FAO was 2.3% (SD 2.9, 95% CI 1.5-3.1) in patients with neutral alignment. In PCFD patients, the FAO average measurement was 11.4% (SD 5.7%, 95% CI 9.6-13.3) (
Distance mapping and coverage mapping
Distance mapping is a state-of-the-art technique to study the relationship and relative positioning between different bones in the foot and ankle. Careful slice-by-slice tracking of all WBCT images can be performed to obtain a 3D reconstruction. To generate distance mapping results, the 3D images need to be meticulously traced along the silhouette of each individual bone. The tracing process can be extensive and needs to be as precise and accurate as possible. 19 Tracing can be done manually or by using certain software packages, which expedites the process. These packages include Mimics Innovation Suite (MIS; Materialise, Leuven, Belgium), which is a fully supported semiautomatic segmentation of any bone structure, and Bonelogic Ortho Foot and Ankle (DIS; Disior, Paragon28, Helsinki, Finland), which is a fully automatic segmentation tool dedicated to foot bones. When 21 PCFD patients underwent assessment of their WBCT imaging using the 2 software packages, there was no statistically significant difference in various measurements between the semiautomatic and the fully automatic methods. 40
In a case-control study by Dibbern et al, coverage was decreased in the articular regions of the subtalar joint, whereas impingement was increased in the nonarticular regions in PCFD patients. Significant uncoverage occurred only at the middle facet (mean difference = 46.6%,
Auch et al. performed distance mapping analysis of the distal tibiofibular syndesmosis (DTFS), which was assessed semiautomatically on axial plane WBCT 1 cm proximal to the tibial plafond. Sixty-two symptomatic PCFD patients were compared with 29 controls. It was found that the FAO had a 6.9% increase in patients with PCFD compared with controls (
A case-control study by Behrens et al
6
assessed potential differences in Chopart joint coverage (talonavicular and calcaneocuboid joints coverage) between PCFD patients and controls. In PCFD patients, talar head coverage decreased in both plantar medial and dorsal medial regions (–79%,
WBCT and PCFD Classification
The WBCT parameters addressed in this article can provide quantification that is useful in the context of the PCFD classification system. According to the consensus meeting, PCFD could be classified into 2 stages (stage I = flexible, stage II = rigid) and 1 or more of 5 classes (class A = hindfoot valgus deformity, class B = midfoot/forefoot abduction deformity, class C = forefoot varus deformity/medial column instability, class D = peritalar subluxation or dislocation, and class E = ankle instability).21,38
Although there is no global consensus on cutoff values for several foot and ankle measurements on WBCT, the metrics and associated reference values reported in this study could be useful reference parameters when assessing foot and ankle deformities. In the authors’ opinion, WBCT is an integral and crucial tool to evaluate and treat PCFD. The following table displays each class in the PCFD consensus classification coupled with corresponding WBCT parameters (Table 1).
PCFD Consensus Classification Coupled With Corresponding WBCT Parameters.

Abbreviations: FAA, forefoot arch angle; FAO, foot and ankle offset; HMA, hindfoot moment arm; HVA, hindfoot valgus angle; MFS, middle facet subluxation; PCFD, progressive collapsing foot deformity; TFMA-S, talus–first metatarsal angle–sagittal; TNCA, talonavicular coverage angle, degrees; TTA, talar tilt angle; WBCT, weightbearing computed tomography.
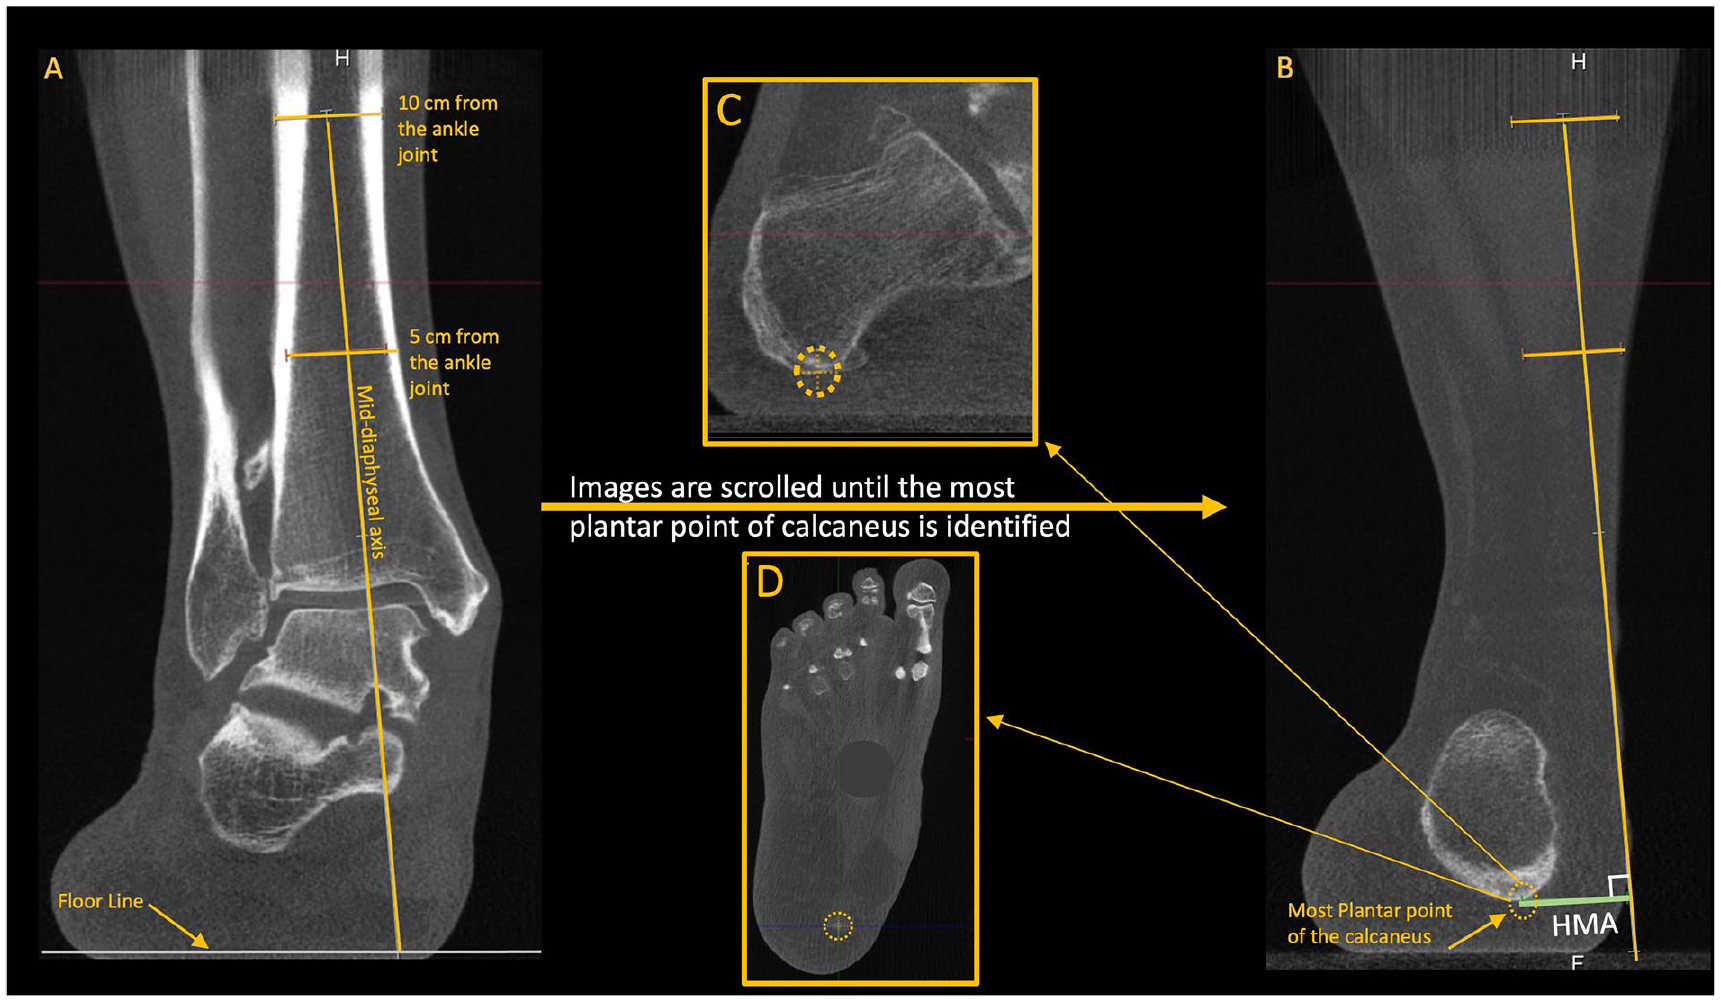
Hindfoot moment arm (HMA). (A) Using the coronal plane, 2 mid-diaphyseal lines are drawn at 5 and 10 cm proximal to the ankle joint to determine the anatomical axis of the tibia. (B) The axis line is then extended inferiorly, crossing the floor line. (B, C, and D) The HMA is determined by the distance between the anatomical tibial line and the most inferior voxel of the calcaneus (confirmed on all planes). 36
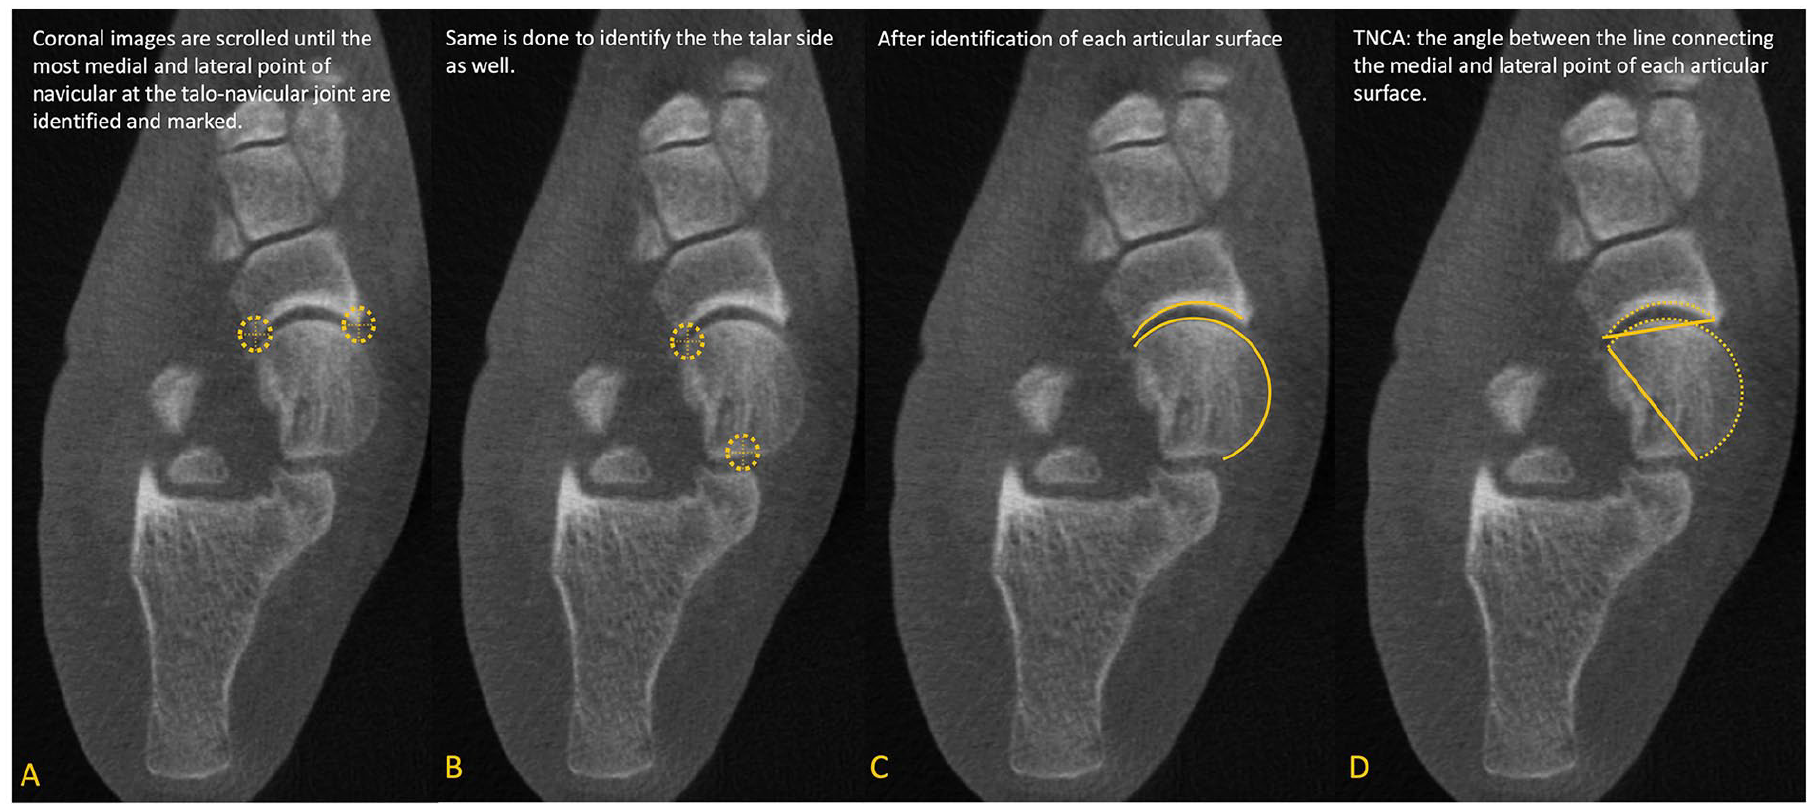
Talonavicular coverage angle (TNCA). On the axial view, (A) Marking medial and lateral edges of the proximal navicular articular surface. (B) Marking medial and lateral edges of the talar head articular surface. (C) Full proximal navicular and talar head articular surfaces highlighted. (D) Talonavicular Coverage Angle marked, with lines connecting medial and lateral edges of the proximal navicular and talar head articular surfaces. 34

(A) Subfibular impingement. Coronal image shows direct abutment of the talus against the fibular as well as decreased space between the fibular and calcaneus, which is also confirmed on the axial view. (B) Sinus tarsi impingement. Sagittal view shows direct bony impingement at the sinus tarsi between the lateral talus and calcaneus, which is also confirmed on the coronal image. 30

Forefoot arch angle (FAA). Using the sagittal and axial images, the medial cuneiform (MC) is identified, and the axial cut that shows the whole length of the MC is chosen for measurements. The FAA is then measured between 2 lines: one tangential to the already established most plantar aspect of the medial cuneiform and the most plantar voxel of the fifth metatarsal, and the floor line. 34 (A) Cross-section of the Weight-bearing CT imaging is brought to the distal aspect of the medial cuneiform, just proximal to the plantar aspect of the first tarsometatarsal joint line. (B) The corresponding coronal plane image is utilized to calculate the Forefoot Arch Angle, and represents the first full image of the entire medial cuneiform in the coronal plane. (C) The Forefoot Arch Angle is measured as the angulation between a line connecting the lowest point of both the medial cuneiform and fifth metatarsal and the floor line.

Middle facet subluxation percentage (MFS%). The sagittal view is meticulously evaluated to detect the cut that shows the middle facet perfectly with the longest length, and then the coronal view is evaluated at the same point. The length of the middle facet of the talus is measured (D1). The distance between the most lateral aspect of the calcaneus to the most lateral aspect of the middle facet of the talus is measured as well (D2). MFS% = D2/D1. 34 (A) The longitudinal length of the middle facet of the subtalar joint in the talus and calcaneus is marked. A cross-section of the weight-bearing CT imaging is brought to the anteroposterior midpoint of the middle facet in the talus. (B) The corresponding coronal plane image of the middle facet of the subtalar joint is depicted, with the measurement of middle facet subluxation being highlighted as the fraction between the uncovered distance and the mediolateral distance of the middle facet articular surface in the talus.

Talar tilt angle (TTA). On the sagittal view, the center of the talus is set, and the view is changed to the corresponding coronal plane, where the talus center is also detected. The center of the talus is again set in the sagittal plane (usually coincident with the tibia), the view is changed to coronal, and the tangential line to the superior talar surface is established. The talar tilt angle is measured between 2 lines drawn tangential to the articular surfaces of the distal tibia and talus.31,36 (A) Cross-section of the Weight-bearing CT imaging is brought to the apex of the talar dome in the sagittal plane. (B) Cross-section of the Weight-bearing CT imaging is also brought to the mediolateral midpoint of the talar dome in the coronal plane. (C) Talar tilt angle is highlighted as the angulation between a tangent line to the talar dome articular surface and one tangent to the distal tibia articular surface.
Senior Author’s Approach
In our practice, WBCT is routinely obtained for PCFD patients preoperatively and postoperatively at 3, 6, and 12 months, and then annually after that. Initially, we establish the diagnosis of PCFD when FAO is more than 4.6% and MFS is greater than 28.7%. Attention is also given to the presence of sinus tarsi impingement and SFI. Further, WBCT can help characterize deformity classes and help planning therapeutic approaches for them. For class A, we commonly use the HMA, which will also provide us with a notion on how much the calcaneus would need to be displaced to regain a position under the tibial axis. The TNCA is the metric we use to determine class B, using 40 degrees as a threshold to consider performing a lateral column lengthening procedure. Medial column instability and forefoot varus, class C elements, are established by the presence of gapping at the TMT or NC joint as well as using the TFMA and the FFA. An overall perception where the instability is present (TMT, NC, TN or all medial column) can help decide where and how to address a class C. Presence of class D and the presence of significant PTS and subfibular impingement have an influence toward a possible subtalar fusion. Ankle valgus tilting and class E are determined by the TTA with implications on the need for a deltoid ligament reconstruction (or a supramalleolar osteotomy) in flexible cases or a total ankle replacement (or an ankle fusion in very selected cases) in rigid deformities. Moreover, FAO and MFS, as well as distance and coverage maps, are normally used to assess the obtained correction on the postoperative period, as well to help establish recurrence and the necessity for further treatment.
In a flexible condition, that is, 1A, 1B, 1C, 1D, or 1E, our surgical approach usually starts with endoscopic gastrocnemius recession and peroneus brevis transfer to peroneus longus proximal to the superior peroneal retinaculum to decrease deforming forces. Medial displacement calcaneal osteotomy is performed to address flexible hindfoot valgus deformity (class A PCFD). If there is significant collapse of the longitudinal arch (class C PCFD), assessed by increased TFMA-S and decreased FAA, a Cotton osteotomy is considered. If there is need for pronounced correction or there is objective WBCT evidence of first tarsometatarsal joint instability (plantar gapping), our preference is for a modified Lapidus procedure using a plantarflexion bone-block allograft wedge (LapiCotton) to restore the medial longitudinal arch and help reestablish the foot tripod. Usually, forefoot abduction (class B PCFD) is restored after medial displacement calcaneal osteotomy and first ray plantarflexion procedures are performed. If no complete correction is achieved, usually assessed by the TNCA with simulated fluoroscopic imaging, a lateral column lengthening (LCL) would be considered. After bone realignment, if needed, a medial approach to the ankle and midfoot is performed, and reconstruction of the superficial and anterior deep deltoid is performed using hamstring allograft or commercial suture tape/internal brace. Through the same approach, evaluation of the spring ligament and posterior tibial tendon are completed, which can lead to either a tissue debridement, reconstruction, or flexor digitorum longus tendon transfer.
Conclusion
WBCT is a powerful tool for evaluation of all aspects of PCFD. FAO is the most specific parameter to diagnose PCFD, whereas MFS is the most sensitive. Increased use of WBCT, as well as rapidly evolving 3D technology, will help refine different metrics. Pretreatment and posttreatment evaluation using the described techniques might offer surgeons and patients a more precise judgment of PCFD and its correction, potentially leading to better patient care.
Supplemental Material
sj-pdf-1-fao-10.1177_24730114251316547 – Supplemental material for Weightbearing Computed Tomography Measurements in Progressive Collapsing Foot Deformity: A Contemporary Review
Supplemental material, sj-pdf-1-fao-10.1177_24730114251316547 for Weightbearing Computed Tomography Measurements in Progressive Collapsing Foot Deformity: A Contemporary Review by Aly Maher Fayed, Matthew Jones, Kepler Alencar Mendes de Carvalho, Nacime Salomão Barbachan Mansur and Cesar de Cesar Netto in Foot & Ankle Orthopaedics
Footnotes
Ethical Approval
Declaration of Conflicting Interests
Funding
ORCID iDs
References
Supplementary Material
Please find the following supplemental material available below.
For Open Access articles published under a Creative Commons License, all supplemental material carries the same license as the article it is associated with.
For non-Open Access articles published, all supplemental material carries a non-exclusive license, and permission requests for re-use of supplemental material or any part of supplemental material shall be sent directly to the copyright owner as specified in the copyright notice associated with the article.