
Abstract
Keywords
Introduction
Open source software (OSS) ecosystems are built by decentralized collaborations of thousands of software developers. Developers write specialized libraries by relying on the work of others, growing a complex network of dependencies. The result is a distribution of work and effort that has been shown to create immense value (Blind and Schubert 2023; Greenstein and Nagle 2014). Two key risks threaten the functionality of the system as a whole: the propagation of bugs and vulnerabilities through the ever-growing network of dependencies (Decan et al., 2019), and its reliance on small groups or even individuals who fix such problems in widely used libraries (Avelino et al., 2016; Eghbal 2020; Pfeiffer 2021). Yet risk assessments of OSS ecosystems have thus far largely neglected the fact that these risks are interrelated: key individuals often maintain several libraries across the network of dependencies that make up a software ecosystem. When such individuals leave the ecosystem, multiple libraries may go unmaintained and become unchecked potential sources (Lehman 1980; Valiev et al., 2018) or conduits (Decan et al., 2018; Ohm et al., 2020) for issues in the dependency network. Efforts to quantify systemic risk—the risk that problems in a specific library can impact the functioning of the system as a whole—in such ecosystems should consider this correlation.
Indeed while these two perspectives both highlight important problems, significant systemic risks in OSS ecosystem emerge through the complex The dependency network among the 100 most downloaded libraries in the Rust ecosystem, observed July 2020. A directed edge between two libraries indicates a dependency. Distinct colors highlight three groups of libraries that have the same developer making the most commits in the previous year. For example, Developer B makes the most commits in each of the three red libraries. Across all 100 libraries, there are 59 unique most active developers, indicating that key individuals often play an important role in multiple interdependent libraries.
In particular, we adapt methods used to study the propagation of errors in complex systems to the case of open source software ecosystems. We use a simulation approach to quantify systemic risk and apply it to data from the Rust ecosystem. We simulate the removal of developers from the system, which induces potential failures in libraries that they maintain, which in turn spread with some probability to downstream dependencies. The likelihood that a library fails, governed by a
Our method highlights key libraries that these purely technical dependency-based measures overlook: among the top 1000 Rust libraries by count of their downstream dependencies, our measure of library systemic importance is moderately correlated with its direct (Spearman’s
Background
We review the measurement of systemic risks and cascades in complex systems. We then turn to the specific case of such risks in software ecosystems, discussing both social and technical factors.
Resilience and vulnerability of complex systems
The field of complexity science has long studied the vulnerability of interconnected systems. Studies of cascading failures in financial networks (Haldane and May 2011; Thurner and Poledna 2013), supply chains (Diem et al., 2022), power distribution networks (Kinney et al., 2005), regional economies (Tóth et al., 2022), and healthcare systems (Sardo et al., 2019) all highlight that a few key nodes in a system can play a systemically important role that is not obvious from their local topology or individual size. The spread of errors in coupled networks is even less predictable (Poledna et al., 2015; Schneider et al., 2013). Previous descriptive work in the software engineering research community has pointed out the potential application of complex systems approaches to the study of software systems (Decan et al., 2019; Mens and Grosjean 2015).
Studies of complex systems simulate the spread of failures from specific sources to quantify overall systemic risk and the importance of individual entities in the system (Peters et al., 2008). In these simulations, the functions governing how errors spread are tailored to the specific situation. For instance, recent work on the resilience of supply chains has used production functions such as the Cobb-Douglas and Leontief functions to model the effect of upstream failures on a node’s production (Diem et al., 2022). The choice of a specific production function captures whether inputs are complements or substitutes. In the software context, the effort of maintainers and the functionality of upstream dependencies are complementary. The initial condition of the error or failure is also important: contagion in financial networks often begins with the default of a large loan or a bankruptcy. In the case of any specific application, care must be taken to understand the mechanisms of how errors spread.
Vulnerabilities of open source software ecosystems
Technical vulnerabilities
Bugs and vulnerabilities spread through software ecosystems via dependencies (Valiev et al., 2018). A 2018 study estimates that half of libraries in the NPM ecosystem are affected by upstream vulnerabilities (Decan et al., 2018). In 2016, a developer of an auxiliary string formatting program called
Upstream issues can also occur in more substantial pieces of software. Many of these systemically important libraries are overlooked because they have worked well in the background for many years. The Heartbleed bug, introduced into the widely used OpenSSL cryptography library in 2012, made roughly half a million webservers and their user passwords and cookies vulnerable to attack (Durumeric et al., 2014). Though the bug was quickly resolved, servers remained vulnerable until patched.
Software systems are also frequently attacked via loopholes introduced by upstream dependencies (Ohm et al., 2020). In 2017, intruders exploited a vulnerability to access an Equifax database, exposing personal finance data of over one hundred million people. Equifax used an outdated version of Apache Struts 2, a web application framework which had a publicly known (and patched) security vulnerability (Luszcz 2018). Another example of software that is widely relied upon is
These risks in the “supply chain” of OSS are increasingly recognized and quantified in the empirical software engineering literature (Amreen et al., 2019; Ma 2018). Many upstream dependencies are small libraries in the mold of
Social roots of ecosystem vulnerability
Early advocates for the OSS model of software development argued that small contributions of many developers would lead to high quality software (Raymond 1999). And although the decentralized peer production process has resulted in remarkably successful software (Benkler et al., 2015), the reliance on volunteers and unpaid labor to maintain such widely used software often leads to an
The extent to which software relies on individual developers has been conceptualized as the
When libraries go under-maintained or become deprecated, issues tend to build up. It is one of Lehman’s Laws that software quickly becomes ineffective or nonfunctional without maintenance (Lehman 1980). In practice, the same individuals who write the original code of a program are the ones who maintain it, a task which often requires quick interventions when something goes wrong (Cook 2020). Unmaintained libraries are not adapted to changes of the broader ecosystem. When upstream libraries introduce breaking changes, a deprecated library will cease to function as expected and can pass issues downstream. This is not just a theoretical concern: over half of NPM libraries depend transitively on at least one deprecated library (Cogo et al., 2022).
Previous work diagnosing the health of ecosystems has not directly addressed the phenomenon of developers working on multiple libraries within an ecosystem. Such developers can make highly valuable contributions, for example, because they facilitate coordination and communication between interlinking parts of a larger system (Herbsleb and Grinter, 1999) or because they are uniquely placed to anticipate failures or issues (Cataldo and Herbsleb, 2013). Although their attentions may be divided (Vasilescu et al., 2016), developers involved in multiple part of an ecosystem are in a position to better consider how new developments in one library may affect others. At the same time, these same aspects make such developers essential to the system as a whole. When such a developer leaves the OSS world, whether it is because they find a new job and no longer have the time, or because they retire, or simply because they no longer want to participate, they may leave several key libraries under- or unmaintained at the same time.
Data
We now turn to the data we use to build and test our systemic risk measurement framework. We use data from the Rust ecosystem, utilizing a dynamic database of dependencies and contributions to Rust libraries assembled by Schueller et al. (Schueller et al., 2022). Rust is a relatively young but growing programming language, which was recently adopted as the second official language of the Linux kernel project. We chose Rust for several reasons. First, the Rust dependency manager Cargo stores data on the evolution of dependencies between libraries overtime. It also has data on the number of downloads over time, allowing us to test the impact of hypothetical failures on end users. Second, a large majority of Rust libraries available on Cargo are hosted on GitHub or Gitlab (over 80%, increasing to over 90% for libraries downloaded at least 10,000 times (Schueller et al., 2022)), likely because of the language’s youth relative to these platforms and its community’s strong OSS orientation, allowing us to download nearly all libraries and their complete development histories. Finally, as a growing ecosystem, Rust allows us to track the evolution of systemic risk across its life-course.
In short, the Rust ecosystem offers, to the best of our knowledge, the most complete data on contributions, dependencies, and outcomes of any OSS ecosystem. We note that while other ecosystems may not have the same quality and scope of data, our framework is modular and can be adapted to different datasets.
Package metadata, repositories, dependency network
The core of the dataset is derived from a database dump from Cargo (available on https://crates.io/data-access) containing extensive metadata about packages. The dataset includes package names, URLs, versions, dependencies, creation date, and daily downloads. URLs can be linked to valid repository (repo) URLs on GitHub, Gitlab, and other platforms. It also provides details on dependencies between packages, enabling the construction of a dependency network at any point in time, which is important as libraries add and remove dependencies on a regular basis. The database discards information about versions by considering only the dependencies of the latest version of a library—recognizing that version conflicts are a major way in which libraries break because of undermaintenance (Decan et al., 2019; Wang et al., 2020).
Developer contributions
We consider commits as the elemental contributions that developers make to projects. Though we acknowledge that other forms of contributions such as issue reporting represent valuable contributions to OSS projects and ecosystems as a whole (Trinkenreich et al., 2020), solving problems created by changes in upstream dependencies, for example, typically requires committing code. The dataset we employ disambiguates user accounts and removes bot accounts (Golzadeh et al., 2021; Schueller et al., 2022). We associate developers to libraries, weighing their contributions by their share of the total commits made. In the analysis carried out in the rest of the paper we fix the scope of the dataset: we consider the dependency network between Rust repos as observed on January 1, 2022. We consider contributions (commits) made to repos from January 1, 2021 to January 1, 2022. To emphasize this point of flexibility, we refer to
Methods and analysis
Modeling library functionality via production functions
The key insight our paper brings from the complex systems literature is that when systems have rich interdependencies, small changes in seemingly unimportant parts of a system can have an outsized effect on the functioning of the whole (Peters et al., 2008). To carry out this kind of analysis in the context of spreading failures in the Rust ecosystem, we will now describe how to quantify a library’s functionality in terms of social and technical inputs.
A library
Risk is minimized when a library has active maintainers and functioning dependencies. Risk is highest when all developers having stopped maintenance work on the library and/or all upstream dependencies have failed. To combine the two sources of risk, we adapt the notion of a
In our case, we argue that maintaining developers and functioning upstream dependencies are both required for a library to continue to work. These two inputs to software maintenance can only substitute for each other in a limited way. This perspective aggregates and necessarily simplifies several sources of risks, but provides a flexible framework to consider the impact of both social and technical vulnerabilities. Specifically we use a Cobb-Douglas style production function (Brown 1957) 
For example, a library or package with one half of its contributors available, and two-thirds of its upstream dependencies functioning, will have a roughly 43% (1 − ((1/2)1/2 ⋆ (2/3)1/2)) risk exposure, that is, its chance of failing. We selected the Cobb-Douglas production function to model the spread of risk because it suggests that contributors and upstream health are complements and imperfect substitutes, and that libraries can fail if either is missing. Indeed the Cobb-Douglas functional form is often used to model or estimate the relative contributions of labor and capital to output in a firm or industry (Brown 1957). The relative weighting of dependencies and maintainers can be adjusted via the exponents. Other production functions such as the Leontief production function (1 − min ( The chance of library failure in terms of the shares of inactive developers and failed upstream dependencies, as quantified using a Cobb-Douglas production function. A library with all of its original developers still active, and 60% of its direct upstream dependencies functional has a roughly 80% chance to survive.
Spread of failures
In order to model the spread of library failures in the ecosystem, we need represent two kinds of relationships. The first kind consists of maintenance activity by developers in specific libraries. We store this information as a matrix∗
The second kind of relationships within the ecosystem we consider are the dependencies between libraries. We store this information in a matrix
We now define two vectors that track the state of the system.
The second vector
When all libraries are fully functioning, every coordinate of
Our scenarios consider what happens to the libraries after a contributor leaves the ecosystem. The departure of a developer triggers potential issues: either directly on those libraries to which she contributes, or indirectly, on those libraries which depend on libraries she maintains, as suggested by Lehman’s Law (Lehman 1980). This information is captured by the following self-referential equation
In this equation ⊙ denotes element-wise matrix multiplication. Likewise, the exponents are to be taken element-wise.
In our application, 

This sequence converges towards a stable solution in a finite number of steps, which we denote
We now describe the specific calculations we make. We proceed by initializing all entries of the library state vector
We now carry out one step of an example diffusion on a toy ecosystem. We visualize this example in Figure 3. In this ecosystem, there are four libraries maintained by three developers. The normalized contributors’ matrix is An example ecosystem. (a) The network of dependencies between four libraries. (b) The three contributors to the libraries. Percentages denote what share of contributions they make to a specific library. For instance, contributor 1 makes 50% of all contributions to library 2. In our example calculation, we simulate the consequences of the departure of contributor 2 from the system.

Column 2 indicates that contributor 1 is responsible for half of the contributions to library 2, while contributors 2 and 3 are responsible for one quarter each. Contributor 2 is the sole contributor to library 1. The normalized dependency matrix, on the other hand is a square 4 × 4 matrix:
This matrix indicates that library 1 has no upstream dependencies (column 1), while libraries 2 and 4 depends solely on library 1. Library 3 (column 3) depends on both libraries 2 and 4. We calculate what happens according to our method if contributor 2 is removed from the system, as indicated in Figure 3. We obtain the following equation:
Carrying out the matrix multiplications and the exponents (element-wise) of the two factors yields
In the next step of the calculation, the left factor would be unchanged, but the right factor would be changed, reflecting the spread of the probability of failure from libraries 1 and 2 (recall that the removed contributor 2 contributed to both). As the reader can verify, the removal of contributor 2 leads to a chain reaction in which the functionality of all libraries in the ecosystem is affected. Specifically the next step of the iteration yields
The next iteration after that results in a library state vector of all zeros:
Ranking contributors, libraries, and the ecosystem as a whole
With this method to model the spread of failures resulting from the removal of individual contributors, we proceed to test the robustness of the whole Rust ecosystem, aiming to rank contributors and libraries for their systemic importance. To do so, we simply repeat the iterated calculation above for every contributor in the ecosystem. That is, we remove each contributor, alone, a single time. Note that more complex removals are possible—the diffusion equation is flexible and can accommodate any valid input contributor state vector. For example, one could remove all contributors supported by a specific corporation or foundation.
For each contributor we remove from the system, our calculations yield a final library state vector 
As not all libraries are equally important to the ecosystem as a whole, we weigh these entries by the share of downloads the specific library has of all total downloads. Specifically the download-weighted risk of a simulated removal to library 
where the denominator in the right factor of the product denotes the sum of downloads of all libraries. Recall that downloads (like commits) are counted only in the year January 1, 2021 to January 1, 2022 for the analysis and results presented in this paper.
Summing the resulting download-weighted risk score over all libraries in the ecosystem yields our final risk score for a specific scenario (defined originally by the input contributor state vector
Ranking contributors
Ranking contributors in terms of their systemic importance in this context is straightforward. Given the removal of contributor 
In other words, this measures the average impact that the removal a contributor from the system would have on a random observed download of a library in the Rust ecosystem.
Overall ecosystem risk
We derive global measure 
This quantity can be used to compare the change in overall risk due to some intervention, as we will implement later in the paper. It also provides a baseline which we use to define library importance.
Ranking libraries
Finally, we also derive a measure ranking the systemic importance of libraries. This is perhaps the most important ranking, as interventions can most easily be made at the level of libraries. Specifically, we consider how often a library serves as a conduit of spreading failure to downstream dependencies. We do this by rerunning the full set of developer removals and failure propagation calculations with each library “immunized” to failure, one by one. In terms of our equation, the immunized library’s entry in the library state vector 
Results
We plot the rank-ordered distribution of Contributor Impact in Figure 4. We observe a remarkable concentration of systemic risk: with the top 10 contributors accounting for over a 40% of the risk observed in our analyses. We observe a similar, though slightly less concentrated distribution when we consider the importance of different libraries in terms of their Risk Transmission Score, see Figure 5. This recalls our motivating example from earlier in the paper: individual developers are playing an important role in multiple important libraries. The rank-ordered contributions of Rust contributors to systemic risk, on a logarithmic scale. The top 10 developers account for 43% of systemic risk. The risk transmission rank (RTR) importance of Rust libraries, on a logarithmic scale. We quantify a library’s importance by rerunning our failure cascade model with that library immunized against failure, and then comparing the overall outcome against the general case when the library can fail. The top 10 libraries account for 22% of the total observed differences across all libraries.

To compare our method of ranking important libraries with alternative measures, for example, by the count of their transitive dependencies, we zoom in on the very top ranked libraries. We plot libraries ranked among the top 20 according to Risk Transmission Rank Libraries of the Rust ecosystem in the top 20 according to either their risk transmission rank (RTR) or the count of (downstream) transitive dependencies. We observe several libraries in the top 10 of the RTR, hence likely of systemic importance, that are not even in the top 100 according to the number of transitive dependencies they have.
Interventions
While it is valuable to highlight vulnerabilities in a system, our methodology can be used to suggest how to intervene in the system to improve its resilience by allocating scarce development resources. In particular, our ranking of libraries in the Rust ecosystem can be used to allocate support. For instance, a foundation or firm may have funds to sponsor development or maintenance on a specific library. Though in reality, developer resources are not fungible and cannot be allocated to any library in arbitrary amounts (Mockus 2009), a prioritization in terms of risk remains useful. Thus in this section, we describe an intervention in terms of development time contributed to a fixed number of libraries. We compare the impact on systemic risk of various allocation strategies based on rankings of libraries, including our Risk Transmission Rank score. We first describe alternative rankings, then describe how we implement the interventions, and finally report results.
Rankings
Ways to rank libraries in the rust ecosystem to allocate developer resources in an intervention.

In a technical sense, a library is important in an ecosystem if many other libraries depend on it. These dependencies can be direct or indirect (sometimes called transitive). We therefore use the count of
In practice, libraries are often ranked by their use and popularity in the broader community. We measure use via the count of
Intervention design and quantifying impact
While software developers and software development time is not a fungible resource, we make the simplifying assumption that a donor can contribute to a library by adding a single developer. Developers added this way make a uniform weekly contribution of commits, which we fix at 5/7 times the number of days across which we analyze the system (in our case 365). We denote this contribution factor (5/7 times 365) by
After allocation, we rerun our framework—one by one we remove each developer in the system and calculate the resulting cascades. We calculate
We need to make one modification to the methodology in this case. Specifically, if we are adding contributions to a library as part of an intervention, we should not simulate what happens if these new resources are withdrawn. Rather, we represent these extra contributions as a kind of 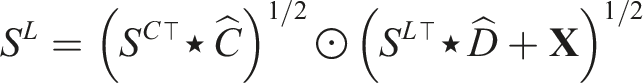
Here
Intervention results
We visualize the improvement in systemic risk as a function of developers added according to the different ranking heuristics in Figures 7 and 8. We observe a sharp decrease in overall risk using the Risk Transmission Rank, the number of downloads, or the number of transitive dependencies to rank libraries. Using GitHub stars, library age, or a random ranking to allocate development resources are significantly less effective strategies. Given that GitHub stars are a major source of visibility in the OSS community (Borges and Tulio Valente 2018), we suggest that equating systemic importance with stars may be leading to systemic mis-allocation of attention and help. The change in overall systemic risk as a function of developers added by various library ranking heuristics, ranging from adding one contributor to 100 (log scale). Extending the previous figure to scenarios adding between 100 and 1000 developers to the ecosystem.

Cumulative reduction of systemic risk when adding developers according to different intervention strategies, relative to the baseline systemic risk. whether adding just a few or many developers, adding them to high RTR ranked libraries yields the greatest decrease in systemic risk.

Discussion
OSS ecosystems tend to evolve, like many complex systems, towards efficiency. If there is a library that does something well, it can quickly become widely used. However, this drive towards efficiency may increase systemic risks. Studies of risk in ecosystems that focus on the structure of technical dependencies overlook the potential synchronized risks coming from departing developers active in multiple libraries. In this work, we present a framework to quantify these risks.
Our method highlights individual libraries which are worthy of more attention and support. As the most central and important developers in OSS ecosystems are under increasing pressure and stress (Eghbal 2020), measures of ecosystem health need to consider the interaction of these social aspects with their technical structure (Constantinou and Mens 2017). In other words, OSS ecosystem sustainability can be thought about via the networks of dependencies between its libraries and how their maintainers span them. Within individual libraries or projects, the importance of socio-technical congruence—that is the coordination between people working on interdependent modules—is well known (Cataldo et al., 2008); our paper suggests how such congruence at the ecosystem level could provide warnings and help maintainers of downstream libraries anticipate upstream issues. More generally, our work contributes to a growing literature on the sustainability and resilience of key software supply chains (Lamb and Zacchiroli 2021; Ohm et al., 2020; Zimmermann et al., 2019).
The primary shortcoming of our work is the evaluation of our ranking of developer and libraries importance using ground-truth empirical data. Two distinct challenges make this difficult and merit future work. First, we need to detect the consequential departure of developers from roles as maintainers, either in specific libraries or the ecosystem as a whole. It is difficult to distinguish unplanned departures from more gentle farewells, in which other developers are ready to take over or a library is clearly labeled as deprecated and its downstream dependencies are informed. Second, we need to quantify the impact of such a departure, which may manifest in many ways. One possibility is to consider the growth in issues reported in downstream libraries and their rate of resolution over time. Another is to consider the spread of security vulnerabilities around un- or undermaintained libraries (Zheng et al., 2023).
Otherwise, our framework also has several potential empirical extensions. One could expand data to other ecosystems (Decan et al., 2019) or define dependencies at more granular levels (Blincoe et al., 2015; Hejderup et al., 2022). One could also expand the scope of contributions to include issue reporting and community management (Trinkenreich et al., 2020), or consider heterogeneity in commit sizes (Gote et al., 2021). Issue and pull request response times and rates (Dey and Mockus 2020), could be deployed as metrics for system health.
Another simplifying assumption of our work is that the libraries we observe are functioning and properly maintained, no matter how many developers they have. This is often false, as shown by Champion and Mako Hill in their recent work on the Debian package ecosystem (Champion and Hill 2021). They introduce the notion of underproduction and quantify it by tracking issue survival rates. One could extend our model by adapting this measure or by adopting different kinds of production functions.
Our framework can also be adapted to analyze the consequences of multiple developers leaving an ecosystem at the same time. This is not a hypothetical scenario—the increased reliance on centralized sponsors of libraries and even ecosystems presents another kind of risk. For example, many of the core developers of the Rust ecosystem were employed by Mozilla. In a round of layoffs in the summer of 2020, many of these developers lost their jobs at the same time. While Rust seems to have weathered this storm, it demonstrates that often multiple developers leave a system at around the same time. External geopolitical shocks like wars and economic sanctions between nations can also have a significant impact on software developers and the ecosystems they operate in (Wachs 2023). Our framework can also be used to study how different kinds of resources are allocated to support OSS. While our analyses considered the case of individual developers being added to specific projects, it can also be adapted to study the potential impact of, for example, collective efforts to fix issues in multiple libraries in a specific system 2 .
In general, people leave OSS projects for reasons that may be correlated within an ecosystem, such as the end of funding of a university project or changing workplaces (Miller et al., 2019). Luis Villa of Tidelift, a firm that helps users and firms support OSS with financial contributions, suggests that we should perhaps rather talk of a “boss factor” than truck factor. 3 Indeed, many of the most widely used and influential OSS projects are maintained by companies and paid individuals (Germonprez et al., 2019). In this way, OSS ecosystems can be thought of as a co-production of volunteers and companies (O’Neil et al., 2021). Policymakers seeking to promote the use of OSS should consider these aspects of sustainability (Blind et al., 2021).
Our work provides additional motivation for getting more people involved in OSS. Mentorship of new contributors has been shown to be a key determinant of people becoming active participants in ecosystems (Steinmacher et al., 2021). At the same time, our work shows indirectly how social barriers to participation (Steinmacher et al., 2015) make software ecosystems more brittle in the long run. More work is needed to understand how disparities in participation in open source, for example, owing to gender (Terrell et al., 2017; Vasilescu et al., 2014) or geography (Braesemann et al., 2019; Takhteyev 2012; Wachs et al., 2022), block us from realizing more stable systems.