
Abstract
The objective of this study was to determine if a relationship exists between sonographic pathological findings of the ankle/foot and self-reported ankle/foot pain. Symptomatic and asymptomatic participants were recruited and evaluated using sonographic imaging of the ankle and foot bilaterally. Participants also completed the Short Form<@150>12 (SF-12, a national physical and mental health scoring system), a visual analog scale (VAS) for pain, and the Victorian Institute of Sports Assessment–Achilles (VISA-A, a scoring system for Achilles tendon abnormalities), as well as provided a health history and demographic information. Twenty-five participants were evaluated. Symptomatic participants had below average physical SF-12 scores (mean [SD], 48.3 [7.3]), while asymptomatic patients had above-average physical SF-12 scores (54.9 [4.0]). Painful right ankle and/or foot were significantly associated with SF-12 physical health (
Ankle/foot pain is one of the most common reasons people make an appointment to see their physician. 1 A recent systematic review demonstrated that as many as 20% of the population may have frequent ankle/foot pain, and each year over seven million Americans are hospitalized for problems related to the feet. 2 As a consequence, the economic burden of ankle/foot pain costs US insurance companies billions of dollars annually. 1 Evaluating patients with ankle/foot pain using sonography could help to select those patients in need of treatment as well as make appropriate use of health care resources.
The ankle is the most injured joint in the body and a common source of musculoskeletal (MSK) pain. 3 Lateral ligament injury is the most common site of ankle injury seen in outpatient primary care. Posterior ankle pain is another common complaint. Sonography allows for the identification of common injuries or MSK disorders of the ankle, such as ligament sprains, tendon rupture, joint effusions, soft tissue masses, and peritendinous swelling. In addition, sonography provides a dynamic real-time evaluation of the ankle structures. 4 The focus of this research was to determine whether a hand-carried ultrasound (HCU) unit can assist in the screening evaluation of ankle/foot pain. Furthermore, an attempt to capture holistic, or whole individual, data combines tools not previously studied or regularly used together to assess individuals with ankle/foot pain.
A review of the most recent guidelines from national and international organizations supports the use of MSK sonography for many conditions, yet some differences exist. According to the
In light of these current ankle/foot sonography practices, it would seem that guidelines are widely available, but the use of sonography to evaluate ankle/foot pain is not complete without using this diagnostic tool as part of a holistic evaluation of the patient. To evaluate this question, we hypothesized that an HCU unit can be used in conjunction with self-reported information to correctly screen patients with ankle/foot pain.
Methods and Materials
All study methods and procedures were approved by The Ohio State University’s Institutional Review Board. Symptomatic and asymptomatic participants were recruited purposively such that a one-shot blinded case study design was used for feasibility. The selection of participants was accomplished by recruiting with a posted flyer requesting volunteers for an institutional review board<@150>approved study that explores ankle/foot pain. Participants were also recruited to make up a set of volunteers who were asymptomatic for ankle/foot pain. The 25 participants were split into 17 symptomatic volunteers and 8 asymptomatic volunteers. Any participants between ages 18 and 65 years were admitted, with exclusion criteria of diabetes, past ankle surgery, or current pregnancy. Participants with a history of ankle injury were included.
Study Protocol
All participants were first consented and provided a standardized questionnaire to complete. The survey included four sections. The first portion was the Short Form<@150>12 (SF-12) to assess the participant’s overall physical and mental health, in keeping with a holistic approach. The second portion was the Victorian Institute of Sports Assessment–Achilles (VISA-A), a validated questionnaire for measuring Achilles tendinopathy. 8 The third section included a visual analog scale (VAS) for pain, the common self-pain indicator used regularly in medical centers, and the fourth section gathered sports activity level and participation along with demographic information. Following the survey, an investigator, not blinded to participant symptoms, took an extensive history from each patient, which included whether the pain was acute or chronic, caused by overuse or trauma, and so forth. A second examiner, an MSK sonographer with five years of clinical experience, blinded to the type of participant recruited, used a modified scanning protocol to screen the ankle and foot bilaterally. This protocol, based on AIUM (2012) and ESSR (2010) technical guidelines, included 15 ankle/foot views (see Table 1), including short axis (SAX) or transverse sweeps of the medial, lateral, posterior, and anterior compartments.6,7 Several of these structures are shown in Figures 1 to 4. A 12-5 MHz linear probe was used with a GE Logiq i (GE Healthcare Ultrasound, Waukesha, Wisconsin) system. Each evaluation was done on default MSK manufacturer settings with both compound scanning technology and harmonics. This same equipment receives bimonthly quality control testing with both a 2D and Doppler flow phantom. A standoff pad was used by the sonographer during the scanning sessions to avoid near-field artifacts.
The Fifteen Ankle/Foot Scanning Views Evaluated Bilaterally with Sonography.

LAX, long axis; SAX, short axis.

Long-axis (longitudinal) sonogram showing a normal, asymptomatic right Achilles tendon.
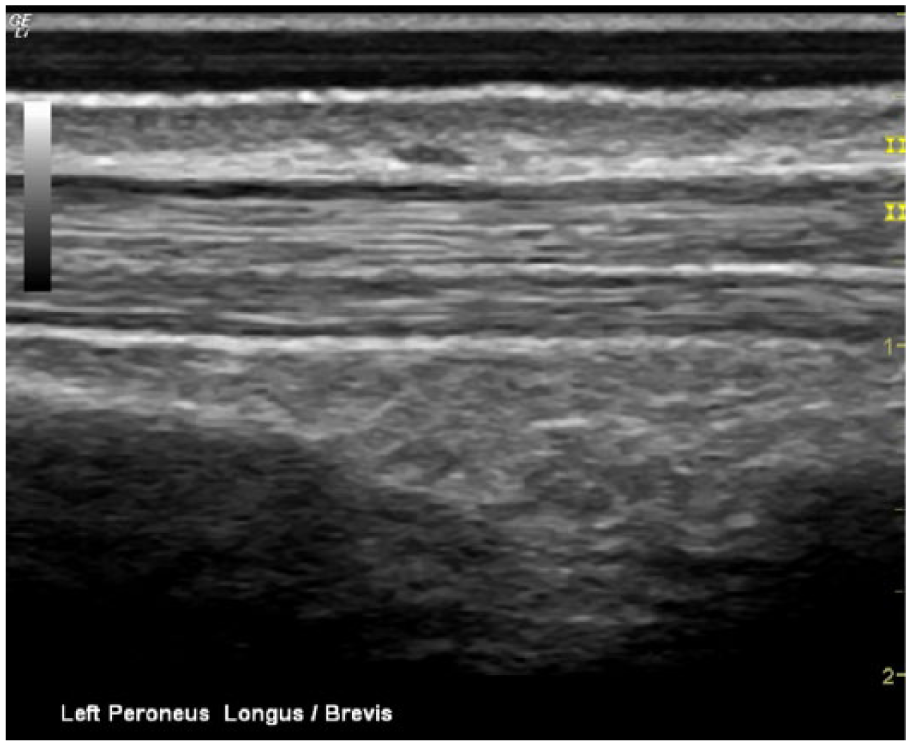
Long-axis sonogram showing the normal, asymptomatic left peroneus longus and peroneus brevis tendons.
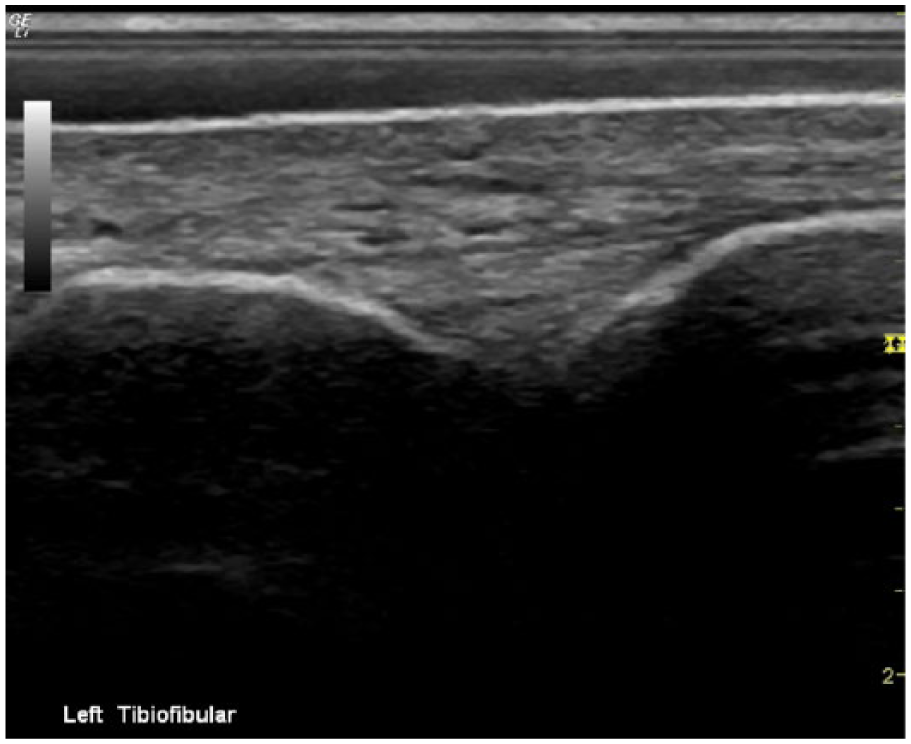
Long-axis sonogram showing a normal, asymptomatic left tibiofibular ligament.

Long-axis sonogram showing an abnormal, symptomatic left tibiofibular ligament with calcifications and associated bony abnormalities.
Image Analysis
The same MSK sonographer, still blinded to study results, made sonographic image evaluations based on the D’Agostino scoring system to evaluate tendon thickness/echogenicity, calcification, bone erosion, and vascularization. 9 These same elements had been rated with excellent agreement (>80%) via an initial Delphi exercise to evaluate spondyloarthritis. 10 In addition, a modified evaluation score for “Other” was added for the detection of fluid, abnormal muscle fiber patterns, and subluxation of the peroneal tendons. The details of the scoring system are shown in Table 2. The scoring system for the other screening tools was as follows: 1. VAS<@151>rating of pain was on a scale from zero to 10, with zero meaning the person experiences no pain at all and 10 representing the worst imaginable agonizing pain. 2. SF-12 physical and mental subscores place responses on a score from 0 to 100, with 50 representing the national average. 3. VISA-A also provides a score from 0 to 100, where 100 represents a perfect score for Achilles tendon ability. Last, an evaluation was made of palpated myofascial trigger points (MTrPs). Problems from any part of the musculoskeletal system, including the Achilles tendon, can produce an associated muscle response. A person may also exhibit a muscle twitch response upon palpating an active myofascial trigger point, which is a taut nodule within a muscular band, related to the area of pain. They may commonly be referred to as a muscle knot. The MTrP scoring system is shown in Table 3. Once palpated, sonography over the area was done and trigger points were identified as ovoid hypoechoic areas, disrupting the normal fibular muscle pattern. 11
D’Agostino and Modified (Including Other Category) Scoring of Ankle/Foot Sonograms.

Scoring of Myofascial Trigger Points (MTrPs).

Statistical Analysis
Data analysis was done using statistical software packages (SAS v.9.2 [SAS Institute, Cary, North Carolina] and MATLAB v.R2014a [MathWorks, Natick, Massachusetts]) to compare the dependent variable, self-reported pain, to the independent variables of holistic diagnosis. The levels of the dependent variable were the VAS and self-reported pain, as noted in the patient history. The levels of the independent variable were the SF-12, VISA-A, D’Agostino, and MTrPs. Statistical significance was selected a priori at
Results
A total of 25 participants were evaluated by both the intake coordinator and the MSK sonographer to collect the data used for analysis.
Descriptive Data
A total of 17 symptomatic and 8 asymptomatic participants were enrolled. There were no statistically significant differences in age or sex between the two groups. There was a total of 11 men and 14 women, ages 18 to 63 years old with a mean age of 33.6 years and median age of 28 years. Ankle/foot pain was reported on the right side in 14 participants and on the left in nine participants (bilaterally in six of the participants). A large number of the total participants were students (11/24, with one nonrespondent). Some of the other occupations listed included a retail manager, data entry clerk, home health care aide, professor, waitress, and research coordinator. Differences in occupation did exist between the two groups, since most of the asymptomatic participants recruited were students (seven of eight) versus only a few students (four of 24) in the symptomatic category. Both groups were very active, with the average participant participating in 10.5 hours of physical activity each week. Only one individual reported no activity, and three participants did not answer this question, yet these same people listed activities. Physical activities included walking, running, swimming, dancing, yoga, and playing various sports from lacrosse to volleyball, soccer, football, and rowing.
Tables 4 and 5 summarize the descriptive data, including the mean and standard deviation for the participants’ responses to the VAS as well as the SF-12 (physical and mental) and VISA-A; included also are the D’Agostino scores (modified and unmodified) and MTrP scores (palpated, as well as scanned).
Descriptive Combined Data between Symptomatic and Asymptomatic Participants.

SF-12, Short Form<@150>12; MTrP, myofascial trigger point; VAS, visual analog scale; VISA-A, Victorian Institute of Sports Assessment–Achilles.
Descriptive Data per Ankle/Foot between Symptomatic and Asymptomatic Participants.

StDev = Standard Deviation; VAS = Visual Analog Scale; VISA-A = Victorian Institute of Sports Assessment – Achilles; MTrP = Myofascial Trigger Point.
Statistical Data
The self-reported pain, as noted in the history taken from the examiner, was a level of the dependent variable in determining if a patient was symptomatic or not in each limb. Since this was reported as a dichotomous variable, the Wilcoxon Rank-Sum test for nonnormally distributed data was used to evaluate differences between those with and without a history of limb pain and the independent variables, including the physical and mental SF-12, VISA-A, and the D’Agostino (modified and unmodified). A summary of the p-values are reported in Table 6, with those reaching statistical significance bolded.
Comparing pain history to select independent variables.

SF-12 = Short Form-12; VISA-A = Victorian Institute of Sports Assessment – Achilles.
As the table demonstrates, the history of pain dependent variable was significantly associated with all of the independent variables except the mental SF-12. The physical SF-12 demonstrated this association in the right ankle/foot and in the bilateral ankle/foot outputs, with a p-value of .007 on the right and .26 on the left, and a .006 p-value bilaterally. This indicates the SF-12 physical score was lower overall for anyone reporting pain in either ankle/foot, and in those who reported right ankle/foot pain. The mental SF-12, however, only showed significance for those with right ankle/foot pain, reporting that these participants had higher mental SF-12 scores than those without right ankle/foot pain. The VISA-A showed the highest significance in differences between the two groups of those who did and did not report ankle/foot pain. Those with reported limb pain had significantly lower VISA-A scores compared to those participants who did not report pain on the right (
In evaluating the D’Agostino scores by side, the statistical test indicated that those who had a history of pain on the right had higher right D’Agostino scores (Wilcoxon Rank-Sum test:
Similarly, the pain history for the comparison of each limb to the modified D’Agostino scores was also statistically significant. Those indicating a history of pain on the right had higher modified D’Agostino scores (Wilcoxon Rank-Sum test: p = 0.01) than those who did not indicate a history of pain. Of the 11 participants without pain on the right, the median modified D’Agostino score was 1.00 (lower quartile = 0.00 to upper quartile 4.00), while for those 14 participants with pain, the median modified D’Agostino score was 5.5 (lower quartile = 3.00 to upper quartile = 10.00). Those indicating they had a history of pain on the left had higher modified D’Agostino scores (Wilcoxon Rank-Sum test: p = 0.03) than those who did not indicate a history of pain. Those without pain in the left limb (N=16) had a median score of 2.00 (lower quartile = 1.00 to upper quartile = 3.00), versus those who had pain on the left, (N=9) who had a median score of 4.00 (lower quartile = 3.00 to upper quartile = 5.00). As anticipated, both the unmodified and modified D’Agostino scores further demonstrated significance for combined limbs.
Analysis was also conducted to evaluate trigger status and reported pain by ankle/foot side, as taken from the participant history. The results are detailed in Tables 7 and 8. The independent variables of the physical SF-12 and the right side trigger status for palpable MTrPs and MTrPs visualized with sonography were statistically significant for those with a history of ankle/foot pain, while left side trigger statuses were not significant when comparing to the participant’s reported history of ankle/foot pain. For example, looking at the palpable MTrPs, 10/14 (71%) of those who reported a history of pain in the right ankle/foot also had positive triggers. This is in comparison to only 2/11 (18%) positive MTrPs in those who did not report having a history of pain in the right ankle/foot. The left side, however, did not demonstrate a large difference, as palpable MTrPs were 33% for pain and 31% for no pain in terms of positive assessment. It should be noted that more right ankle/foot pain was reported (total of 14) than on the left (total of 9).
Right ankle/foot history of pain and Right trigger (Palpable).

Fisher’s Exact test, p=0.0154.
R = Right; Palp = Palpable.
Right ankle/foot history of pain and Right trigger (Sonography).

Fisher’s Exact test, p=0.0421.
R = Right; US = Ultrasonography.
Next, the VAS dependent variable of pain was compared to the independent variables. Linear regressions were done to show how this dependent variable predicted, or did not predict, the independent variables. Analysis of the physical and mental SF-12, as well as the VISA-A results (R2 and p-values) are summed up in Table 9, and again significant values (
Comparing VAS scores to questionnaire independent variables.

VAS = Visual Analog Scale; SF-12 = Short Form 12; VISA-A = Victorian Institute of Sports Assessment – Achilles.
Legends for Figures.
The VAS dependent variable was statistically associated with the dependent variable of pain history. The physical SF-12 scores were statistically significantly, but weakly, associated with the right VAS scores (R2=0.2, p < 0.03). The left VAS scores were not statistically significant, however the combined total VAS scores were statistically significantly (R2=0.03 and p < 0.09). The mental SF-12 reached no significance in accounting for any change in VAS scores by ankle/foot side or combined.
The most significant results were those of the VISA-A questionnaire. Linear regression showed significance for both the right and left sides compared to their respective VISA-A score, as well as the combined VAS and VISA-A scores. The VISA-A scores for the right ankle/foot were moderately associated (R2=0.58, p < 0.001). The VISA-A scores for the left ankle/foot were also moderately associated (R2=0.45, p < 0.0003). Lastly, the combined VISA-A scores for the right and left sides combined demonstrated a moderate association R2=0.54, p < 0.001).
When the dependent VAS variable was compared with the D’Agostino scoring, there was not a statistically significant interaction between the D’Agnostino score and limb (p < 0.59). The D’Agostino score does, however, show an overall trend (not specific to the right or left side), in which as the score increases, so does the VAS. Each point increase on the D’Agnostino score accounts for, on average, an additional 0.42 VAS points (95% CI 0.13, 0.72). Similarly, there was not a statistically significant interaction between the D’Agnostino (modified) score and side (p < 0.43). The modified score does however show the same overall trend (not specific to the right or left side) in which as the score increases, so does the VAS (p < 0.03). Each point increase on the modified score accounts for, on average, an additional 0.34 VAS points (95% CI 0.11, 0.56).
Finally, linear mixed models were used to analyze the relationship between VAS pain scores and trigger status (both palpated and those visualized with sonography). The patient was included as a random effect in the linear mixed model to account for correlation between responses (i.e. right and left ankle/foot). Comparisons of trigger status for each side were tested as contrasts within the mixed model. Diagnostic measures such as residual plots were used to assess model assumptions.
In the right ankle/foot of those with negative palpable MTrPs (N=13) the mean VAS score was 1.38 with a standard deviation of 2.84, compared to those with positive palpable MTrPs (N=12) averaging a VAS score of 4.08 with a standard deviation of 2.50. Participants with negative left ankle/foot palpable MTrPs (N=17) had a mean VAS score of 1.71 with a standard deviation (SD) of 2.76, while the participants with positive left ankle/foot MTrPs (N=8) had an average VAS score of 0.88 with a standard deviation of 1.46. Boxplots of these results are depicted in Figures 5 and 6. For those with negative ultrasound MTrPs (N=17) the mean VAS score was 1.82 (SD 2.90), compared with participants with positive ultrasound MTrPs (N=8) with a mean VAS score of 4.50 (SD 2.33). Finally, those with negative ultrasound MTrPs of the left ankle/foot (N=20) showed an average VAS score of 1.65 (SD 2.64), while those with positive ultrasound MTrPs (N=5) had an average score of 0.60 (SD 0.89). There was a statistically significant association between palpable MTrP and ankle/foot pain (
Discussion
This study, although limited, does provide some important associations with participant self-reported pain as defined by their pain history and VAS score. The descriptive data shows the average scores for every variable assessed, and these sub-scores were either higher or lower (depending on the variable) pointing towards increased pathology or pain for the symptomatic participants compared to those with no complaint. Building onto the descriptive data, the associative significance testing and linear regressions showed the most salient variables, described below.
Not all of the variables were significant as was initially expected. Notably the mental SF-12 scores indicated that symptomatic participants did not have significantly different scores (56.6, SD 5.6) than the asymptomatic participants (55.8, SD 3.7). Both groups scored above the national average set of responses. A possible explanation of the increased mental health scores among the symptomatic group may be attributed to a placebo-like effect, where patients are feeling as if they are getting their concerns and pain finally addressed. 13
The symptomatic participants overall had lower physical SF-12 scores (48.3, SD 7.3) than the national average, while the asymptomatic participants had higher physical SF-12 scores (54.9, SD 4.0) than the national average. The painful right foot/ankles were significantly associated with both the pain history and the VAS scale, whereas the painful left foot/ankles were not significant for either of these dependent variables. The bilateral ankle/foot data from both the pain history and VAS, however, was significant. The combined score significance was likely influenced by the right limb in this study.
Differences in VISA-A scores were the most notable between these two groups of participants (symptomatic average of 69.9 and asymptomatic average of 93.9). While this questionnaire has been validated as a clinical index of Achilles tendinopathy, it can detect other conditions that influence lower limb function, such as an ankle sprain, which is a condition some of our participants reported in their history. Of clinical importance, the VISA-A provides a range of severity of those with Achilles tendinopathy, with presurgical patients scoring an average of 44 (28-60), nonsurgical patients averaging 64 (59-69), and normal controls exceeding 96 (94-99). 8 Within our cohort, six participants scored a 60 or below on the right VISA-A and only two scored a 60 or below on the left VISA-A limb evaluation. This would seem to indicate that a painful right ankle/foot was more influential to the overall score than a painful left ankle/foot.
Corroborating the conclusions drawn from the VISA-A, the VAS scores were much higher for a painful right side than for a painful left side. Only 5 of 9 painful left foot/ankles on the VAS scale were scored above a four (uncomfortable pain). In comparison, 11 of 14 painful right foot/ankles reported a score of four or above on the VAS. Some prior studies on clinically diagnosed Achilles tendinopathy have actually excluded those participants whose pain on the VAS scale was below a four. However, VAS is very subjective and may have to do with how the patient wants the clinician to perceive their pain. For example, only one participant recorded a bilateral VAS score of 10. This same person fell asleep during the examination, and the manipulative techniques did not bring a wince to this person’s face. Not surprisingly this participant was a data outlier. This is in contrast to a participant who clearly winced during the physical examination but rated pain via VAS as only a three.
The D’Agostino and D’Agostino modified scores were significantly correlated to both the pain history by side and combined. However, only the combined scores for each of these were associated with the dependent VAS scores. The D’Agostino modified was slightly more significant for each statistical evaluation and this is likely due to the D’Agostino scoring being specific to enthesitis in spondyloarthritis, whereas the modified scoring attempts to capture more general ankle/foot abnormalities, such as trauma. 10 It should be noted the D’Agostino modified scoring system was used to help identify any sonographic abnormalities to aid in the screening of ankle/foot pain, since a radiologist was not utilized to provide a definitive diagnosis.
Also, the use of a HCU unit was also an important part of this study, as portability would be advantageous to access acute sports injury pain. While the use of a higher frequency transducer may have been helpful in this study, a 12 MHz transducer represents a more widely available and common transducer for a portable ultrasound machine. While the sonographic evaluation provided holistic information, the trigger point evaluation provided associated information for each ankle/foot side via the palpable triggers (although not both limbs combined). The sonography triggers only provided significant information on the right side. Again, the pain status of the right ankle/foot and number of right versus left painful limbs likely attributed to this phenomenon. While this was an overall sample, the consistency with which the MTrPs align (and/or outperform) statistically with other diagnostic tests, notably the physical SF-12, warrants a closer look at the importance of these often overlooked sources of pain, specifically in the ankle and foot.
From the linear regression analyses, the VISA-A provided the strongest correlation with the VAS accounting for nearly 60% of the difference in the right ankle/foot, 45% in the left, and almost 55% when combined. While the physical SF-12 accounted for only 20 percent of the VAS variation, with an R2 = 0.2 in the right ankle/foot and nearly 10% overall, these were statistically significant, so regardless of the low correlation coefficient this information could be a valuable component from a clinical standpoint.
While this study was devised as a holistic evaluation of the ankle/foot, it would be the combination of these variables which could provide the most valuable information. Hawkes and Burns suggest that perceived pain is foremost, therefore the self-reported pain via history and VAS are an important part of the clinician’s examination. 13 Replicating this work could be expedited by utilizing the VISA-A, palpable MTrPs, modified D’Agostino scoring of the sonographic screening, and physical SF-12.
As stated, most of the guidelines are based on research studies in which ankle/foot sonography focuses on specific pathologies. One example is a study of a small cohort of 17 athletes and two controls evaluating synovitic lesions concluding that abnormal antero-lateral soft tissue does not necessarily mean a person is symptomatic. Only synovitic lesions greater than 10 mm were associated with symptoms. 14 The cohort above is similar in that there was a subset of professional dancers, however, we were able to use the combination of diagnostic techniques to better classify our participants.
A study by Kainberger et al. evaluated a cohort of 73 symptomatic and 24 asymptomatic participants reporting Achilles tendon pain, finding abnormal sonographic features in 53 patients (sensitivity, 0.72; specificity, 0.83), with the extent of structural disorders of the tendon properly assessed. They found “tendon swelling (45%), abnormal tendon structure (42%), rupture (15%), and peritendinous lesions (47%).” 15 However, “No changes were detected in low-grade disease of short duration, which suggests symptoms caused by functional disorders.” 15 Although this study did not detect acute injuries, this could be due to the equipment model and lack of using a combination of techniques that are currently available. The use of trigger points, sonographic image analysis, and self-reported history has the potential to triangulate the data and potentially increase the overall sensitivity of the individual diagnostic examination.
Limitations
This study has specific limitations which include a convenient sample and a single examiner for both scanning and sonogram evaluation. Future studies would provide higher levels of evidence by utilizing a match-controlled design and having multiple raters, including a radiologist, with demonstrated strong inter-rater reliability. It would be interesting for future studies to include a longitudinal component to compare self-reported pain to the significant independent variables before and after interventions from inter-disciplinary teams to evaluate how these independent variables, such as trigger status and sonographic features, change with the hopefully improved ankle/foot pain.
Conclusion
In conclusion, this study was an innovative approach to ankle/foot pain with the use of a hand-carried ultrasound unit (HCU) and provided a clearer picture for future holistic screening with this modality. Results of this study indicate an HCU may contribute to a more holistic examination for patients with ankle/foot pain. However more rigorous and focused studies utilizing the variables identified here would be highly suggested.