
Abstract
Keywords
1 Introduction
In past decades, the complex network theory has developed and significantly contributed to the characterization of complex systems. Notably, the complex network analysis of time series has achieved drastic advances in diversified research areas. Reviews of the rapid development in complex network‐based time‐series analysis were presented in the previous studies [1, 2]. Among the published complex network methods, the visibility graph (VG) proposed by Lacasa et al. [3] has established itself as an efficient graph construction approach in the analysis of electroencephalogram (EEG) signals [4], human heartbeat dynamics [5], crude oil price [6], and others. Network motifs are regarded as recurrent subgraphs that are statistically significant to characterize the local structure of a network [7]. Recently, Iacovacci and Lacasa [8] proposed sequential VG motifs that can uncover the nonlinear dynamics underlying time series. The combination of VG and network motif provides a promising method to characterize the complexity of time series from a novel perspective. For example, Choudhary et al. [9] defined horizontal VG motifs as a group if they inherited the same number of edges and employed the groups in heartbeat‐rate analysis. Xie et al. [10] implemented horizontal VG motifs analysis in distinguishing healthy subjects, congestive heart failure subjects, and atrial fibrillation subjects. Ren and Jin [11] proposed sequential limited penetrable VG motifs to extract the information about different flow patterns of oil‐in‐water two‐phase flow. Despite the above‐mentioned achievement, the VG motif provides a limited qualitative on univariate time series, whereas the most widely existent in science and engineering are multivariate time series. Multiplex VG (MVG)‐based methods have been implemented in driver fatigue detection using EEG signals [12], mental disorders analysis using functional magnetic resonance imaging (fMRI) data [13], and nontrivial quantification of coupled chaotic maps [14]. In this study, we developed a novel MVG motif method to estimate the complexity of multilayer network structures.
Sleep plays a crucial role in people’s everyday physical and mental well‐being as it is strongly associated with the performance of many essential daily activities such as reasoning, working efficiency, and mental concentration. There are six sleep stages in a sleeping cycle: wakefulness (W), non‐rapid eye movement (stages 1–4, from light to deep sleep), and rapid eye movement (REM). Sleep is vital for the recovery of the body and brain from fatigue by cycling through the sleep stages. However, with the increasing stress levels, a larger number of people are suffering from sleep‐related disorders and diseases. Sleep disorders are significant risk factors leading to neurological diseases, impaired performances, and deteriorated quality of life. The investigation of sleep disorders has become a topic of great importance in recent years. Polysomnographic recordings, which generally comprise EEG, electro‐oculogram (EOG), electrocardiogram (ECG), and electromyogram (EMG), are acquired from patients to perform sleep‐disorder investigations. The polysomnographic recordings are segmented into 30‐s epochs and classified into the six stages by a disciplined expert based on the Rechtschaffen and Kales (R&K) rules. This process is called sleep stage detection or sleep stage scoring, which is an essential and indispensable procedure in sleeprelated disorder diagnosis, sleep‐related disease treatment, and sleep research. However, manually analyzing polysomnographic recordings is labor exhaustive and subject to an expert’s mental state. Therefore, there is a dire need to develop an automatic sleep‐stage detection system that can provide an objective and repeatable sleep‐stage classification results.
Methods using various physiological signals have been proposed to perform sleep stage detection. Adnane et al. [15] processed ECG signals to extract 12 features and employed support vector machine recursive featureelimination system to realize sleep‐wake stage scorings. Zhang et al. [16] decomposed EEG signals into five frequency bands and extracted the entropy features from each band for sleep‐stage detection. Boostani et al. [17] sketched an EEG‐based sleep‐stage scoring method, which selected the entropy of wavelet coeffcients as the best feature along with a random forest classifier. Acharya et al. [18] illustrated the application of higher‐order spectra and recurrence quantification analysis in the characterization of different sleep stages. Diykh et al. [19] extracted time‐domain features as well as the structural graph similarity to detect sleep states. Zhu et al. [20] developed a difference VG and then selected nine features from the graph domain to detect the sleep stages. Liang et al. [21] introduced autoregressive models based on multiscale entropy analysis to realize automatic sleep scorings. The abovementioned methods extracted features from the time‐domain, frequency‐domain, and nonlinear features from each recording epoch. These features are then selected to realize an optimal combination for sleep‐stage detection. Despite the effectiveness of sleep‐stage detection, the above‐mentioned methods are task specific and limited by the features that are manually selected by researchers. With the goals of the analysis changing, the best suited features need to be reconsidered. Fortunately, deep learning can be employed to address this problem as it is an approach that can extract significant features directly from the data and eliminate the need for manual feature extraction. With the rapid development of some basic but specific neural networks, including the convolutional neural network (CNN) and long short‐term memory (LSTM) network, deep learning approaches have been applied in the analysis of physiological signals. Gao et al. [22] developed a CNN structure that can learn spatio‐temporal features from multichannel EEG signals to detect driver fatigue. Mathews et al. [23] proposed an ECG‐based deep learning algorithm that not only offered accurate classification but also provided a potential physiological signal classification. Faust et al. [24] reviewed several physiological signal‐based deep learning methods in the field of healthcare. Furthermore, studies focused on sleep‐stage detection using deep learning have been reported. Sors et al. [25] introduced a 14‐layer CNN using raw EEG signals as input for sleep‐stage detection. Cui et al. [26] combined CNN and fine‐grained segment in multiscale entropy for automatic sleep‐stage classification. Ansari et al. [27] developed an 18‐layer CNN to distinguish quiet and non‐quiet sleep using EEG signals recorded from preterm infants. Michielli et al. [28] improved the traditional recurrent neural network and proposed a novel cascaded LSTM block for sleep‐stage scorings.
In this study, we presented a novel MVG motif method to classify the sleep stages using a two‐channel EEG signal. First, we segmented each two‐channel EEG signal into nonoverlapping 30‐s epochs to set up the multiplex network. Then, we obtained the corresponding multiplex motif sequence of each epoch and employed multiplex motif entropy (MME) for the significance analysis of the six sleep stages. Finally, we fed the multiplex motif sequence into a CNN model to classify the six sleep stages.
2 EEG dataset
The sleep EEG dataset analyzed in this study, which was used to demonstrate the efficiency of the proposed methodology, was acquired from the publicly available PhysioNet Sleep‐EDF database [29]. The dataset comprised two groups, i.e., the sleep cassette group comprising four healthy volunteers and the sleep telemetry group comprising four subjects experiencing mild sleep disturbances. For each subject, their respective polysomnographic recording, comprising one EOG channel and two EEG channels (from Fpz‐Cz and Pz‐Oz electrodes location), was saved in a corresponding EDF file. The three‐channel signals were obtained with a sampling frequency of 100 Hz. Every 30 s of EEG data, containing 3000 data points, were designed as one of six sleep stages based on R&K rules by well‐trained experts. The six sleep stages include awake (W), stage 1 (S1), stage 2 (S2), stage 3 (S3), stage 4 (S4), and REM. In this study, we performed six‐state classification (W, S1, S2, S3, S4, and REM), five‐state classification (W, S1, S2, S3 & S4, and REM), four‐state classification (W, S1 & S2, S3 & S4, and REM), three‐state classification (W, S1–S4, and REM), and two‐state classification (W, S1–S4 & REM). We employed both the EEG channels (Fpz‐Cz and Pz‐Oz) to construct the MVG and evaluated the performance of the proposed multiplex sequential VG motifs method.
3 Methodology
In this section, we first introduced the construction of VG and the derivation of the sequential motif of four nodes from a univariate time series. Then, we derived the MVG motifs of the four nodes from the two‐channel EEG epoch. Finally, we developed a CNN model to classify the six sleep stages.
3.1 VG and sequenced motifs
We supposed

As shown in Fig. 1(a), we performed the above‐mentioned procedure and converted the time series into the corresponding VG. Network motifs of VG could be obtained to investigate the characteristics of the corresponding time series. Herein, we focused on the VG motifs of the four nodes, as shown in Fig. 1(c). The eight motifs are denoted as
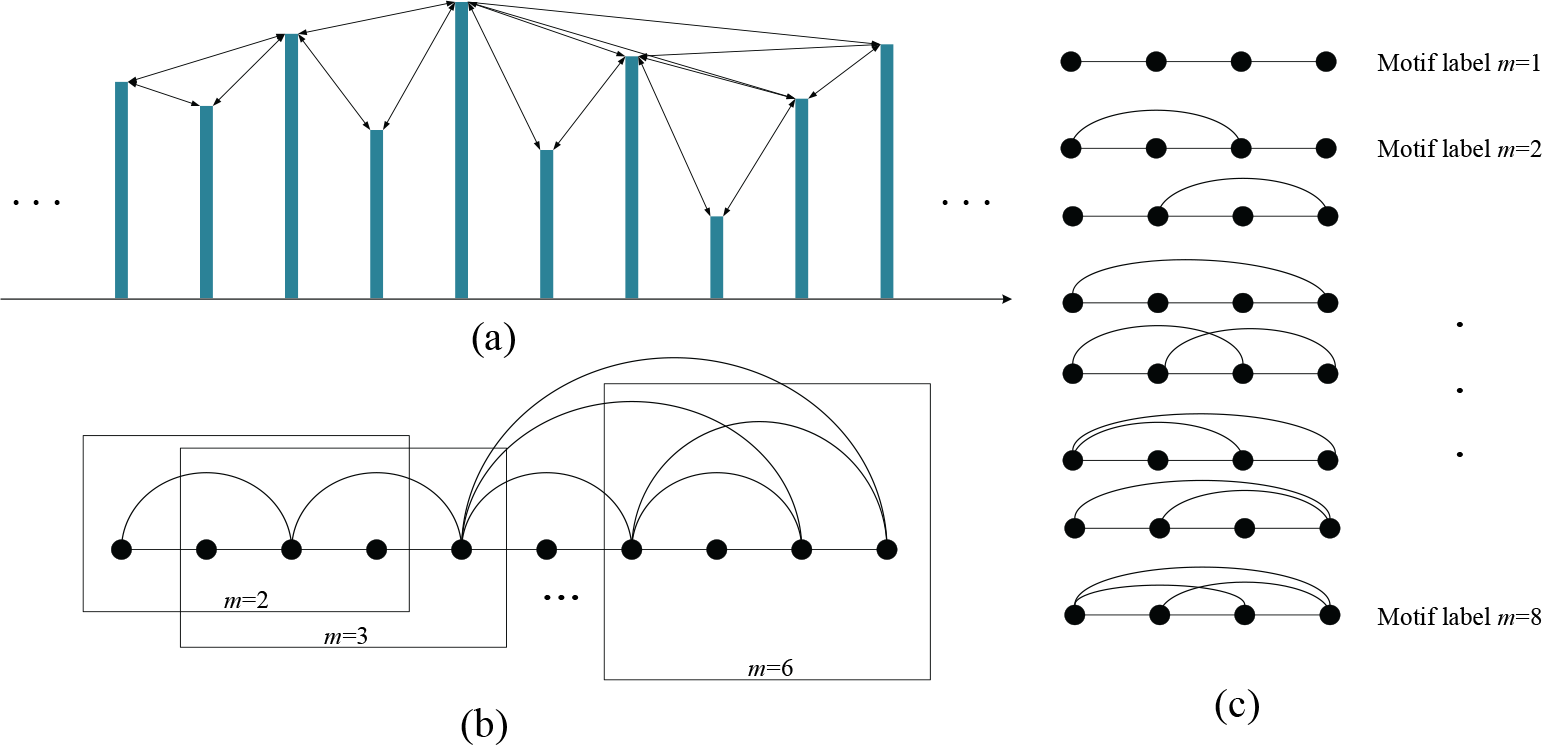
Illustration of (a) a time series, (b) its corresponding VG and sequenced motifs of four nodes, and (c) eight motifs of the four nodes. The visibility lines between data points define the edges coupling nodes in the graph.
3.2 Multiplex motif entropy
For the above‐mentioned two‐channel sleep epochs, we developed the VG motif to the MVG motif, as shown in Fig. 2. Eight labeled motifs of four nodes could be obtained from a VG, whereas for an MVG of two layers, we could obtain 64 possible motifs with a combination of eight motifs at each layer. Particularly, we employed MME to describe the dynamics of the underlying system as follows:

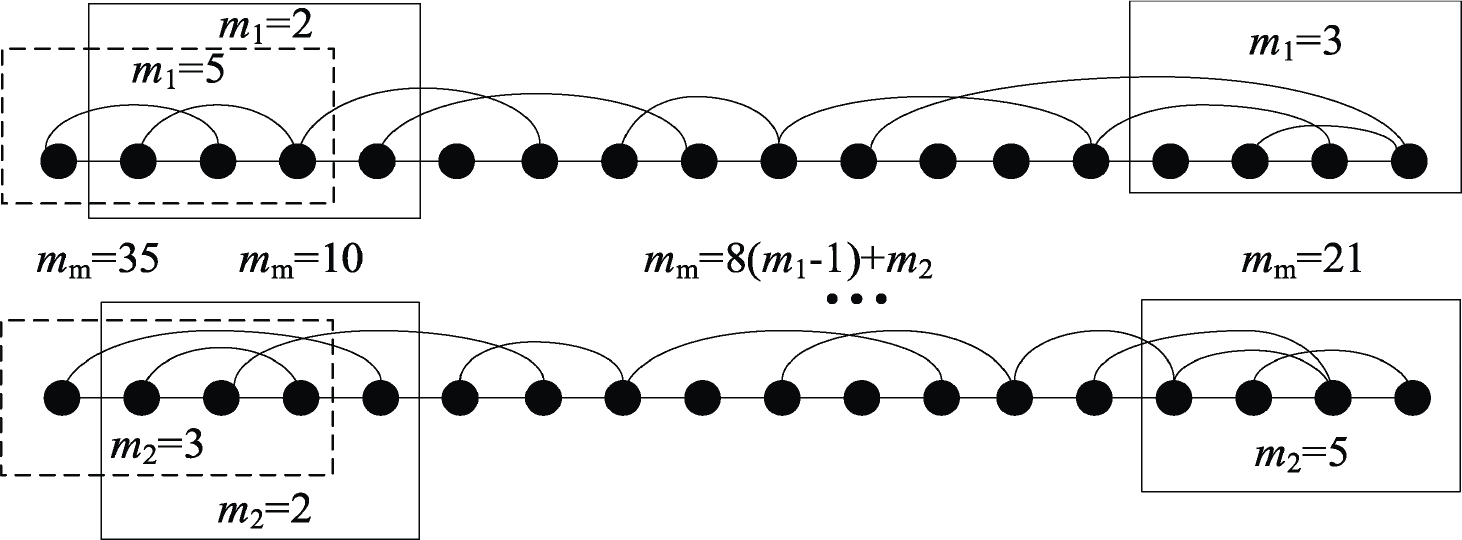
Illustration of MVG motif of the four nodes.
where
3.3 CNN Model
The input used in our structure is the multiplex motif sequence, which comprises three convolutional layers and two max‐pooling layers. There are three operations, one dimensional (1D) convolution with its filters, batch normalization, and rectified linear unit (ReLU) activation, successively performed in each convolutional layer. Furthermore, three kernels with size 32 × 1, 64 × 1, and 32 × 1 are chosen for the three convolutional layers, respectively. The number of filters in these convolutional layers is 16, 32, and 16, respectively. The batch normalization and ReLU activation, following each convolutional layer, constitute an activation block to bypass the normalization operation on input data. Each pooling layer downsamples input using maximum operations.
After the convolution and pooling operations, the obtained feature maps are flattened into a 1D vector. Finally, the cross‐entropy objective function is used in the softmax layer to produce a probability for each sleep stage. Thus, the stage that obtains the maximum probability is regarded as the predicted annotation. Through three convolution operations, the multiplex motif sequence is processed layer by layer to yield better representations to realize sleep-stage detection.

Framework of the multiplex motif sequence‐based CNN sleep‐stage detection system.
Furthermore, the Adam optimizer is applied during the model training process to initialize the weights of the convolutional layers. The Adam optimizer is employed with a learning rate of 0.0001 to optimize the model. The number of learning iterations is set at 300 and the batch size is 128. The traditional backpropagation method is used to fine‐tune the weights and biases for higher classification accuracy. In the case of the validation accuracy stops increasing, the early stop scheme will take effect with the aim to avoid overfitting.
4 Results
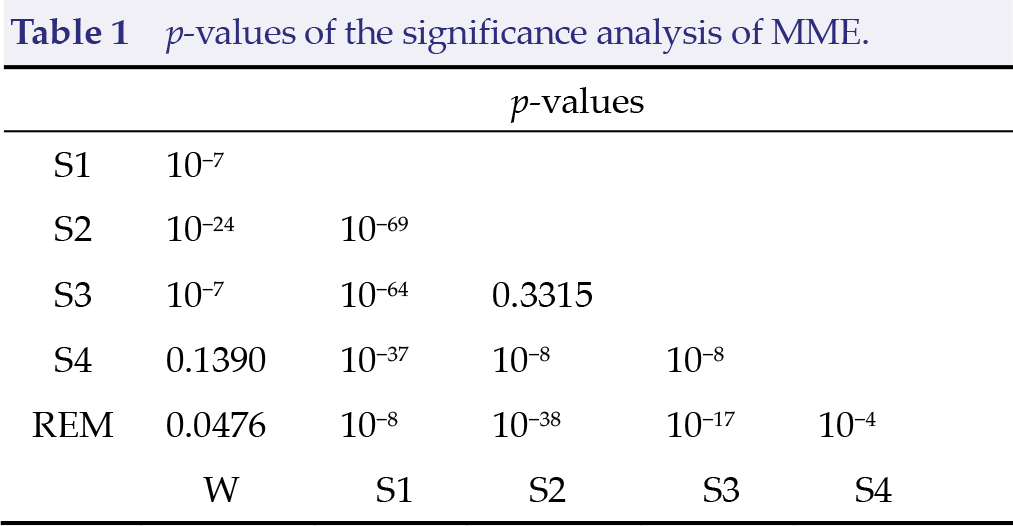
First, we used the MVG motif entropy to analyze the six sleep stages in eight subjects. In total, we have 8037 awake epochs, 604 S1 epochs, 3621 S2 epochs, 672 S3 epochs, 627 S4 epochs, and 1609 REM epochs. We derived MVG of two layers from each epoch, and we then calculated the corresponding MVG motif sequence. Then, we employed the MME to distinguish the six sleep stages. We compared the stages in pairs using the
Next, we fed the multiplex motif sequence into the proposed CNN model and employed a 10‐fold cross‐validation strategy to demonstrate the effectiveness of the multiplex motif. We randomly divided the entire sleep dataset into 10 subsets, and we then performed the validation by selecting one subset as the testing set and the remaining nine as the training set. This procedure was repeated 10 times such that each of the 10 subsets could be enumerated as the testing set. Thus, we obtained the average accuracy of the 10‐fold validations. The confusion matrix across 10 folds from the multiplex motif sequence of six‐state sleep stages detection is shown in Table 2. The classification accuracies of six- to two‐state detection are shown in Fig. 4.
Confusion matrix across the 10 folds from the multiplex motif sequence.


Classification accuracy of six- to two‐state sleep detection using the multiplex motif sequence‐based CNN system.
This PhysioNet Sleep‐EDF database has been recognized as a benchmark for developing sleep‐stage detection models, and many researchers have used this database to test their proposed methods. To provide a few examples, Zhu et al. [20] subtracted the edge set of the horizontal VG from that of the VG to develop a difference VG and then selected nine features from the graph domain to obtain classification accuracies of 97.90%, 92.60%, 89.30%, 88.90%, and 87.50% for twoto six‐state sleep detection, respectively. Ronzhina et al. [30] classified sleep EEG epochs corresponding to the Pz‐Oz channel and presented results for various multiclass sleep‐stage classification with different architectures of artificial neural network classifier. The obtained classification accuracies for six‐, four‐, three‐, and two‐class classification problems are 76.70%, 81.55%, 90.31%, and 98.62%, respectively. Sharma et al. [31] studied iterative filtering‐based decomposition for automated classification of sleep stages using EEG signals, and the classification accuracies for two- to six‐state detection are 96%, 90.66%, 87.45%, 86.19%, and 84.29%, respectively.
5 Conclusions
In this study, we developed an MVG motifbased CNN for characterizing sleep stages using EEG signals. We used the MME to represent the local features of the MVGs mapped from the two‐channel EEG sleep epochs. Results suggested that the MME shows significant differences between different sleep stages. Furthermore, we developed a CNN model and employed the multiplex motif sequence as input to classify the six sleep stages and obtain an accuracy of 85.27%. In future work, we will investigate the MVG motif analysis on a complex system with more layers.