
Abstract
Introduction
Since the introduction of the RNA-seq methodology around 2006,1–6 studies based on whole transcriptomes of both model and non-model species have been flourishing. RNA-seq data are widely used for discovering novel transcripts and splice variants, finding candidate genes, or comparing differential gene expression patterns. The applications of this technology in many fields are vast,1,7 including researches on, eg, splicing signatures of breast cancer,
8
host-pathogen interactions,
9
the evolution of the frog immunome,
10
the plasticity of butterfly wing patterns,
11
the study of conotoxin diversity in
Despite the tremendous decrease in sequencing costs, which allows virtually any laboratory to obtain RNA-seq data, transcriptome analyses are still challenging and remain the main bottleneck for the widespread use of this technology. User-friendly applications are scarce, 14 and the post-analysis of generated sequence data demands appropriate bioinformatics know-how and suitable computing infrastructures.
When a reference genome is available, which is normally the case for model system species, a reference-guided assembly is preferable to a
The first step of a
Once reads have been cleaned, they are assembled into transcripts, which are subsequently categorized into functional classes in order to understand their biological meaning. Finally, it is possible to perform expression quantification analyses by estimating the amount of reads sequenced per assembled transcript and taking into account that the number of reads sequenced theoretically correlates with the number of copies of the corresponding mRNA

Overview of the TRUFA pipeline.

Snapshot of the TRUFA web page for running RNA-seq analysis.
There are several online platforms already available to perform different parts of a RNA-seq analysis. For example, Galaxy (https://usegalaxy.org/)
22
allows analyzing RNA-seq data with a reference genome (using Tophat
23
and Cufflinks
24
), whereas GigaGalaxy (http://galaxy.cbiit.cuhk.edu.hk/) can produce
The TRUFA platform has been designed to be interactive, user-friendly, and to cover a large part of a RNA-seq analysis pipeline. Users can launch the pipeline from raw or cleaned Illumina reads as well as from already assembled transcripts. Each of the implemented programs (Table 1) can be easily integrated into the analysis and tuned depending on the needs of the user. TRUFA provides a comprehensive output, including read quality reports, cleaned read files, assembled transcript files, assembly quality statistics, Blast, Blat, and HMMER search results, read alignment files (BAM files), and expression quantification files (including values of read counts, expected counts, and TPM, ie, transcripts per million 30 ). Some outputs can be directly visualized from the web server, and all outputs can be downloaded in order to locally perform further analyses such as single nucleotide polymorphisms (SNPs) calling and differential expression quantification. The platform is mainly written in Javascript, Python, and Bash. The source code is available at Github (https://github.com/TRUFA-rnaseq). The long-term availability of the TRUFA web server (and further developed versions) is ensured given that it is currently installed in the ALTAMIRA supercomputer, a facility integrated in the Spanish Supercomputing Network (RES). The number of users is currently not limited and accounts are freely provided upon request.
List of available software on TRUFA.

Implementation
The overall workflow of TRUFA is shown in Figure 1. The input, output, and different components of the pipeline are the following:
Input
Currently, the input data accepted by TRUFA includes Illumina read files and/or reads already assembled into contigs. Read files should be in FASTQ format and can be uploaded as gzip compressed files (reducing uploading times). Reads from the NCBI SRA databases can be used but should be first formatted into FASTQ format using, eg, the SRA toolkit. 31 Already assembled contigs should be uploaded as FASTA files. Other FASTA files and HMM profiles can be uploaded as well for custom blast-like and protein profile-based transcript annotation steps, respectively. Thus far, no data size limitation is set.
Pipeline
Several programs can be called during the cleaning step (Table 1). The program FASTQC (http://www.bioinformatics.bbsrc.ac.uk/projects/fastqc) has been implemented to assess the quality of raw reads and give the statistics necessary to tune cleaning parameters (Fig. 1). After the quality of the data is determined, CUTADAPT 32 and PRINSEQ333 allow, among other functionalities, the removal of adapters as well as low quality bases/reads. In particular, PRINSEQ has been chosen for its ability to treat both single and paired-end reads and to perform read quality trimming as well as duplicate removal. Using the BLAT fast similarity search tool, reads can be compared against databases of potential contaminants such as, eg, UniVec (which allows identifying sequences of vector origin; http://www.ncbi.nlm.nih.gov/VecScreen/UniVec.html) or user-specified databases. TRUFA's scripts will automatically remove those reads, giving hits with such queried databases.
Cleaned reads, after passing an optional second quality control with FASTQC to verify the overall efficiency of the first cleaning step, are ready for assembly. TRUFA implements the software Trinity,
34
which is an extensively used
The newly assembled transcripts can be used as query for similarity searches with BLAT 40 or Blast+ against the NCBI nr and UniRef90 databases. In parallel, HMMER 41 searches can be performed applying hidden markov models (HMM) against the PFAM-A database. Both analysis can be run as well with user-specified databases or models respectively. Further annotation and assignation of gene ontology (GO) terms can be obtained with Blast2GO 28 for the transcripts with blast hits against the nr database.
For expression quantification, Bowtie2 42 is used to produce alignments of the reads against the assembled transcripts. Alignments are then properly formatted using SAMtools 43 and Picard (http://broadinstitute.github.io/picard/). 43 Using these alignments, eXpress 44 can be used to quantify the expression of all isoforms. Additionally, the script “run_RSEM_align_n_estimate” of the Trinity package implemented in TRUFA uses Bowtie 45 and RSEM 46 to provide an alternative procedure for expression quantification of both genes and isoforms. Moreover, the percentage of reads mapping back to the assembled transcripts (obtained with Bowtie and Bowtie2) can be used as another indication of the assembly quality.35,38
Output
TRUFA generates a large amount of output information from the different programs used in the customized pipeline. Briefly, a user should be able to download FastQC html reports, FASTQ files with cleaned reads (without duplicated reads and/or trimmed), Trinity-assembled transcripts (FASTA), read alignments against the transcripts (BAM files), GO annotations (.txt and.dat files which can be imported into the Blast2GO java application), and read counts (text files providing read counts and TPM). Various statistics are computed at each step and are reported in text files, such as the percentage of duplicated/trimmed reads, CEGMA completeness report, assembly sequence composition, percentage of mapped reads, and read count distributions.
Results and Discussion
We have built an informatics platform that performs a nearly complete
The results of a first run performing only a FASTQC analysis were used to set the parameters (see Supplementary Table 1) for the cleaning process, except for the yeast dataset, which was assembled without preprocessing. Read cleaning, assembly, mapping, and annotation statistics are shown in Tables 2 and 3. The yeast dataset showed highly similar results to the original analysis, validating the TRUFA assembly. The difference observed in the number of transcripts is most likely due to the not fully deterministic nature of the Trinity algorithm.
47
However, the percentage of reads mapped back to the transcripts was slightly higher in the original study.
47
For the other three datasets, TRUFA showed globally comparable results. Except for the mean transcript length for the

Measures of completeness and read usage for the assemblies produced with TRUFA. CEGMA results represent the percentage of completely and partially recovered genes in the assemblies for a subset of 248 highly conserved core eukaryotic genes. Overall alignment rate and concordant pairs (providing at least one alignment) were computed with Bowtie2.
Comparison of outputs between original and TRUFA analyses.

Summary of the
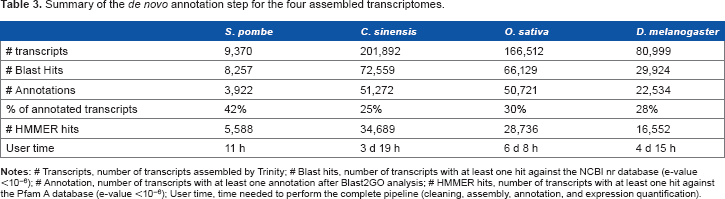
Considering the entire pipeline, each testing dataset was analyzed by TRUFA in less than a week (Table 3), confirming a good time efficiency of the platform. According to Macmanes 13 on the effect of read trimming for RNA-seq analysis, optimizing trimming parameters leads to better assembly results. This optimization should take no longer than 3 days of computation for datasets such as the ones used here and can be easily done with TRUFA by producing in parallel various assemblies and their quality statistics with different sets of trimming parameters and parameter values.
In Prospect
To complete the RNA-seq analysis pipeline available in TRUFA, we plan to expand the platform by incorporating programs for differential expression analysis and SNP calling. Other programs, especially for assembly (eg, SOAPdenovo-Trans, Velvet-Oases) and visualization (eg, GBrowse) of the data, are planned to be also included in the future. In addition, integrating GO terms for each annotated transcripts would permit the user to browse sequences of interest directly from the web server without the need to download large quantities of output. We also plan to complete the platform by providing features for read mapping against a reference genome (such as, eg, STAR, 50 Tophat, and Cufflinks). A cloud version of TRUFA, which would increase considerably its global capabilities, is also envisioned to be run in the EGI.eu Federated Cloud (see https://www.egi.eu/infrastructure/cloud/) in the near future.
Conclusion
We presented TRUFA, a bioinformatics platform offering a web interface for
The trimming and assembly steps are guided by the integration of widely used quality control programs toward the optimization of the assembly process. Moreover, the implementation of HMMER, BLAST+, and Blast2GO to the platform for
Data Accessibility
TRUFA platform, user manual, example data sets and tutorial videos are accessible at the web page https://trufa.ifca.es/web. Accession numbers to the read files used in this study are provided in the Results and Discussion section and can be obtained from http://www.ncbi.nlm.nih.gov/sra/.
Abbreviations
transcriptome user-friendly analysis
transcripts per million
single nucleotide polymorphism
high performance computing
Author Contributions
Conceived the study: RZ, EK. Constructed the pipeline: EK. Performed testing runs: EK, CFL. Implemented the web version: LC, FA, EK, JM. Tuned parts of the pipeline: CFL, JR. All authors contributed to the writing and improving of the manuscript, and read and approved the final version.
Supplementary Material
Supplementary Table 1.
List of the main command lines used for the analysis of each data sets. Datasets: 1,