
Abstract
Introduction
A voluminous research literature has used survey data to study the urban gradient in subjective well-being (Wang and Wang, 2016). No unambiguous conclusion has emerged. Some scholars have found that people are on average less happy/satisfied with life in cities than in towns and rural areas (Berry and Okulicz-Kozaryn, 2011; Lenzi and Perucca, 2016; Okulicz-Kozaryn, 2017; Okulicz-Kozaryn and Mazelis, 2018; Sørensen, 2014; Winters and Li, 2017). Other scholars have arrived at the opposite conclusion: life is better or at least not worse in cities (Easterlin et al., 2011; Florida et al., 2013; Glaeser et al., 2016; Millward and Spinney, 2013; Shucksmith et al., 2009).
Recently, Morrison (2020, 2023) has pointed out the importance of heterogeneity in city preferences for average subjective well-being in cities. Heterogeneity across sociodemographic groups is a possible explanation for the mixed results in the received literature. If some groups prefer to live in cities and other groups prefer smaller places, the urban gap in average subjective well-being will depend on the sociodemographic composition of cities and non-city areas, and research results will depend on the composition of survey samples.
A considerable literature, reviewed below, has discussed how various groups are affected by the positive and negative attributes of city life. However, few empirical studies have attempted to examine how the urban gradient in subjective well-being depends on personal characteristics. Okulicz-Kozaryn and Valente (2019) find that subjective well-being in the US is increasing in city size for persons born after 1981 (the millennials) but decreasing in city size for older cohorts. Migheli (2017) studies the association between life satisfaction and interaction terms between education level and city size for a sample of Western European countries but does not arrive at a clear conclusion. Using Eurobarometer survey waves during 2004–2010, Lenzi and Perucca (2022) conclude that living in a city with more than half a million inhabitants is associated with lower life satisfaction, but that this effect is weaker or even reversed for persons with tertiary education and persons without financial problems. Carlsen and Leknes (2022) find that, compared to other sociodemographic groups, young and well-educated persons have higher life satisfaction in the capital and largest city of Norway, Oslo, than in the rest of the country. 1 Our study extends this literature by using 55 waves of the Eurobarometer survey for 2010–2019 to examine how differences in life satisfaction between cities and non-city areas depend on several sociodemographic characteristics of respondents.
Our study makes three contributions to the literature on urban scale in subjective well-being. First, based on a comprehensive literature review, we systematise the various mechanisms by which preferences for city life may depend on age, sex, education level, partner and parental status and unemployment.
Second, in the empirical analysis we allow differences in life satisfaction between cities and non-city areas to depend simultaneously on several sociodemographic variables. This reduces the risk of spurious results. For instance, we can rule out that the association between education level and life satisfaction in cities is due to the fact that young adults tend to have more education than older cohorts, or that the association between having a partner and preferences for city living runs through the presence of children in the household.
Third, previous studies have found that the urban–rural gap in subjective well-being varies between rich and poor countries (Burger et al., 2020; Easterlin et al., 2011; Glaeser et al., 2016). Hence, there is evidence that the effect of city living on subjective well-being depends both on respondents’ attributes and their country of residence. A pertinent, yet unexplored question is therefore whether there are three-way interactions between city living, personal characteristics and resident country, that is, whether interaction effects of city living and personal characteristics on subjective well-being depend on country characteristics. We are able to take an initial step in examining this question as we have data for 25 European countries and on average more than 50,000 respondents per country. Specifically, we consider how country income and welfare state regime affect associations between sociodemographic variables and preferences for city living. Given the absence of theoretical literature addressing this topic, we emphasise that this part of our analysis is exploratory.
The next section presents our theoretical framework, reviews the literature on heterogeneity in city preferences, discusses sources of heterogeneity between EU countries and presents the main hypothesis. We then present the data set, variables and results. The last section contains concluding remarks.
Theory and hypotheses
Theoretical framework
Subjective well-being has been the subject of a large and expanding research effort within several disciplines (Wang and Wang, 2016). There exists, however, no convergence as to the theoretical foundations of the concept (Veenhoven, 2000). Our point of departure is the theoretical framework suggested by Veenhoven (2000) and elaborated by Shucksmith et al. (2009). In this framework, quality of life depends on how a person evaluates his/her life situation. The evaluation of one’s life is a function of the person’s intrinsic qualities and external circumstances.
External circumstances considered in our study are whether a person lives in city or non-city areas and country of residence. Sociodemographic characteristics of respondents are used as indicators of intrinsic qualities. Finally, we assume that quality of life can be measured by answers to questions about satisfaction with life. The Online Supplemental Appendix Figure illustrates our approach. Quality of life (reported satisfaction with life) depends on external circumstances (city living and country, represented by average GDP per capita and a dummy for welfare state regime) and intrinsic qualities (sociodemographic variables). In addition to the direct effects, sociodemographic variables and country also affect life satisfaction indirectly, as we allow these variables to affect associations between life satisfaction and city living.
City traits
Cities share some common traits that distinguish them from smaller towns and rural areas. Positive traits include a vibrant nightlife, opportunities for meeting a partner as well as a variety of goods and services, for instance theatres, restaurants and education institutions (Glaeser et al., 2001; Glaeser and Gottlieb, 2006). Negative traits of cities, where smaller places of residence typically score better, include high house prices, crime, inequality, pollution, noise, and congestion (Okulicz-Kozaryn, 2015; Okulicz-Kozaryn and Mazelis, 2018; Okulicz-Kozaryn and Valente, 2018). Incomes are in general higher and career prospects better in cities than in towns and rural areas due to production advantages, such as low transport costs, knowledge spillovers and large pools of workers, input providers and clients (Combes and Gobillon, 2015).
City size
Most scholars use population size (and less often density) to distinguish city and non-city areas (see the Online Literature Appendix). There is considerable variation in the size intervals included in the analyses: some studies compare large cities with medium cities and towns/rural areas, whereas others focus on differences between rural and urban areas. There is also heterogeneity in the number of population size categories examined.
We would expect population size thresholds of what constitutes a city to vary according to city traits. Large cities may stand out with respect to some traits, for instance technological progress and variety in job opportunities, whereas medium or smaller cities may score just as high on amenities such as architecture and cultural amenities. Moreover, the importance of traits for subjective well-being may vary between countries and over time. Consequently, the size threshold that distinguishes cities and non-city areas is likely to be heterogeneous, and we therefore employ alternative thresholds in our analysis.
Personal characteristics
The association between city traits and subjective well-being is not likely to be uniform across inhabitants but rather depends on personal characteristics. Based on our reading of the literature, we focus on six sociodemographic variables that may influence preferences for city versus non-city living: age, sex, education level, unemployment, partner status, and the presence of children in the family.
Age
On average, we expect young people more than other age groups to appreciate city life (Moos, 2014, 2016). Cities offer high quality educational services, career prospects and meeting places that facilitate matching with partners (Compton and Pollak, 2007; Costa and Kahn, 2000; Siedentop et al., 2018). These traits are less important to seniors who tend to be attracted by the slow quietness, safety, absence of pollution, moderate house prices and the beautiful nature of rural areas (Chen and Rosenthal, 2008; Clark, 2003; Dorfman and Mandich, 2016; Fokkema et al., 1996; Glaeser, 2020; Jauhiainen, 2009; Stockdale et al., 2013; Walters, 2002).
Sex
Several authors argue that rural areas are less attractive to women than to men (Leibert, 2016). Preferences for job attributes are sex-specific with women typically favouring jobs that involve human contact (Lordan and Pischke, 2022). As rural and urban labour market differ – the former offering more jobs in agriculture, and the latter a wider spectre of service sector jobs – the rural labour market will on average be relatively more attractive to men and vice versa for women. The deindustrialisation process in advanced economies has contributed to this polarisation as the number of jobs in manufacturing, where the majority of workers are men, has declined fastest in metropolitan regions (OECD, 2023), thus further shifting the industry structure in favour of women.
Another argument advanced in the literature is that cultural values in rural areas tend to be less attractive to women (Leibert, 2016). For instance, Haugen and Villa (2006) argue that some women perceive rural areas to be controlling and intrusive.
Based on our reading of the literature, we expect women to be relatively more satisfied with city living than men. A study by Graham and Chattopadhyay (2013) based on Gallup World Survey supports this conclusion, but the estimated difference in subjective well-being between sexes is only marginally higher (in favour of women) in urban areas.
Education and unemployment
Scholars have argued that the wide variety of goods and services in cities are particularly important to well-educated persons (Adamson et al., 2004; Brueckner et al., 1999; Florida, 2017; Lee, 2010). Moreover, the wage gap between education classes tends to be bigger in cities (Autor, 2019; Carlsen et al., 2016). The attraction of cities to high skilled workers causes an inflow of households that exert upward pressure on house prices and forces low qualified workers to locate in less attractive neighbourhoods further from work (Morrison, 2020, 2023). We therefore hypothesise that well-educated people are overall more satisfied with city life than persons with lower education levels.
Our data set does not contain information comparable across countries about income but includes information about unemployment. There is consistent evidence of a negative relationship between unemployment and life satisfaction (Clark, 2018). Since unemployment is associated with low income, in line with the arguments above, one may expect unemployed persons to be relatively less satisfied with life in cities compared to the employed. Moreover, intra-community social capital often found in the countryside may lessen the stigma of unemployment (Sørensen, 2016). However, other mechanisms may point in the opposite direction. Urban labour markets usually provide a larger pool of potential jobs in case of job loss (Duranton and Puga, 2004), as well as better opportunities for additional education and upgrading of skills. The effect of unemployment status on preferences for city living is hence ambiguous.
Partner and children
Compared to singles, families need more space, which increases the importance of house prices for location decisions and makes cities less attractive. Moreover, for persons who live in a relationship, the superior opportunities for matching with a partner in cities is less relevant. Pollution and crime, typically city challenges, reduce the attractiveness of cities for families with children (Barlindhaug et al., 2019; Laoire and Stockdale, 2016). Children are more vulnerable to diseases from air pollution than adults, and children growing up in high crime areas and polluted neighbourhoods are more likely to commit crimes later in life (Aizer and Currie, 2019; Chyn, 2018; Damm and Dustmann, 2014; Forouzanfar et al., 2016; Landrigan et al., 2018). On the other hand, the living conditions of children also depend on the quality of schools, leisure activities and other services, which may be better in urban areas. The effect of the presence of children in the household on subjective well-being is thus an empirical question.
Hypothesis
Based on our reading of the literature, we postulate that young, single and well-educated persons are more satisfied with city living than older people, persons with less education and persons living in a relationship. We also expect women to be relatively more satisfied in cities but have not arrived at unambiguous predictions for the presence of children in the household and unemployment status.
Country income and welfare state regime
We next consider whether the associations between sociodemographic variables and preferences for city living may vary according to country income and welfare state regime.
Country income
There is considerable heterogeneity in income between EU countries; GDP per capita was 4–5 times higher in the richest countries compared to the poorest countries during the period covered by our data. Ceteris paribus, subjective well-being is higher in richer countries, as GDP per capita is one of the main determinants of average happiness (Helliwell et al., 2019). Moreover, the urban–rural gap in subjective well-being is negatively associated with average country income (Burger et al., 2020; Easterlin et al., 2011; Glaeser et al., 2016). The same pattern can be found within the EU; in the richer EU countries, subjective well-being tends to be higher in rural areas, whereas the opposite is the case in poorer EU countries (Shucksmith et al., 2009). It is also known that the strength of the association between personal characteristics and subjective well-being depends on country income, see Online Country Income Appendix.
Since country income affects the urban–rural gap in subjective well-being as well as the association between subjective well-being and personal characteristics, a natural question is whether the country income gradient of the urban–rural gap is heterogeneous across demographic groups; that is, whether associations between personal characteristics and preferences for living in urban areas vary with country income. We have not found literature that discusses this question.
Welfare state regimes
Scholars often distinguish five welfare state regimes within the EU: the Nordic/social-democratic, Anglo-Saxon/liberal, Continental/conservative, Southern European and Eastern European models (Greve, 2019). Regimes vary according to, for example, the level of social security expenditures, the use of transfer and taxes to equalise income, the degree of decommodification of public services, and coverage of benefits (Causa and Hermansen, 2020; Eikemo and Bambra, 2008). In this paper, we compare the Nordic model with the others. Nordic countries are characterised by relatively low level of income inequality, universal welfare benefits and a high degree of decommodification of public services and score high on rankings of subjective well-being (and not only because of high income level; Helliwell et al., 2019). Prior literature has discussed how the Nordic model affects the well-being of distinct population segments, but for GDP per capita, not whether and how the characteristics of the Nordic welfare state model affect the urban–rural gap in subjective well-being for different sociodemographic groups.
The following empirical analysis presents evidence that some associations between preferences for city living and personal characteristics vary according to GDP per capita within the EU and differs between Nordic countries and the rest of the EU. As existing literature has not considered this issue, this part of our empirical analysis is explorative; developing and testing hypotheses of potential reasons for this heterogeneity is relegated to future studies.
Data and variable description
We employ data from the Eurobarometer surveys 2010–2019. In this period, 76 survey waves were performed among people 15 years and older, of which 56 surveys included the following question about life satisfaction: On the whole, how satisfied are you with the life you lead?
For our purpose, we use the 55 surveys where respondents were given four response alternatives from 1 to 4, where 1 is ‘very satisfied’ and 4 is ‘not at all satisfied’. 2 We reverse the scale for ease of interpretation of the results. 3
We restrict the sample to the 25 countries that are regular participants in the Eurobarometer surveys and report the respondents’ subnational region of residence: Austria, Belgium, Bulgaria, Croatia, Czech Republic, Denmark, Estonia, Finland, France, Germany, Great Britain 4 , Greece, Hungary, Ireland, Italy, Lithuania, Latvia, the Netherlands, Poland, Portugal, Romania, Slovakia, Slovenia, Spain, and Sweden. The number of respondents drawn per wave is approximately 1000 per country, giving an initial data set of 1,343,278 observations.
We removed 6426 respondents that did not rank their life satisfaction. As the newer surveys are censored at age 98, we also dropped 264 respondents older than 98 from the older surveys. Finally, we dropped 35,566 respondents who did not provide complete information about the six sociodemographic variables that we focus on or did not answer a question we use to assign respondents to city/non-city areas, leaving a sample of 1,301,022 observations for our analysis.
As noted above, there is considerable heterogeneity in the literature with respect to the variables used to identify a city as the place of residence of respondents. Moreover, medium sized places may have some city traits but not others, making classification ambiguous. We therefore compare the results for alternative city variables.
Our first city variable is based on answers to the following question in the questionnaire: ‘Would you say you live in a (1) rural area or village, (2) small or middle-sized town or (3) large town?’. The city variable is one if respondents indicated the latter alternative. Next, we use information from the surveys about NUTS region to obtain an estimate of the size of a respondent’s place of residence. The dataset contains information about, respectively, NUTS 3 region for 23%, NUTS 2 for 63% and NUTS 1 for 14% of the sample. Following Lenzi and Perucca (2022), we assign city residents to the largest city within the NUTS region. Information about city size is taken from the 2019 edition of World Population Review. 5 Our second (third) city variable is one if the respondent answers that he/she lives in a large town, and the largest city within the respondent’s NUTS region is larger than 250,000 (500,000) inhabitants.
The sociodemographic variables are computed on the basis of answers to questions by respondents. Having a partner includes being married and cohabitation, and the presence of children in the family is defined as at least one child below 15 in the household. The surveys do not include questions that which allow us to compute number of years of education or highest achieved degree. There is, however, a question about age when the respondent finished his/her education. Our proxy for a long education is a dummy equal to one if the respondent was 20 years or older when he/she completed education; in the robustness analyses, we consider alternative cut-off ages. Since some respondents had not concluded their education, we include a dummy for being a student as control variable.
The first panel of Table 1 presents summary statistics of life satisfaction and the socio-economic variables for the full sample and for the city/non-city subsamples.
Descriptive statistics. Eurobarometer 2010–2019.
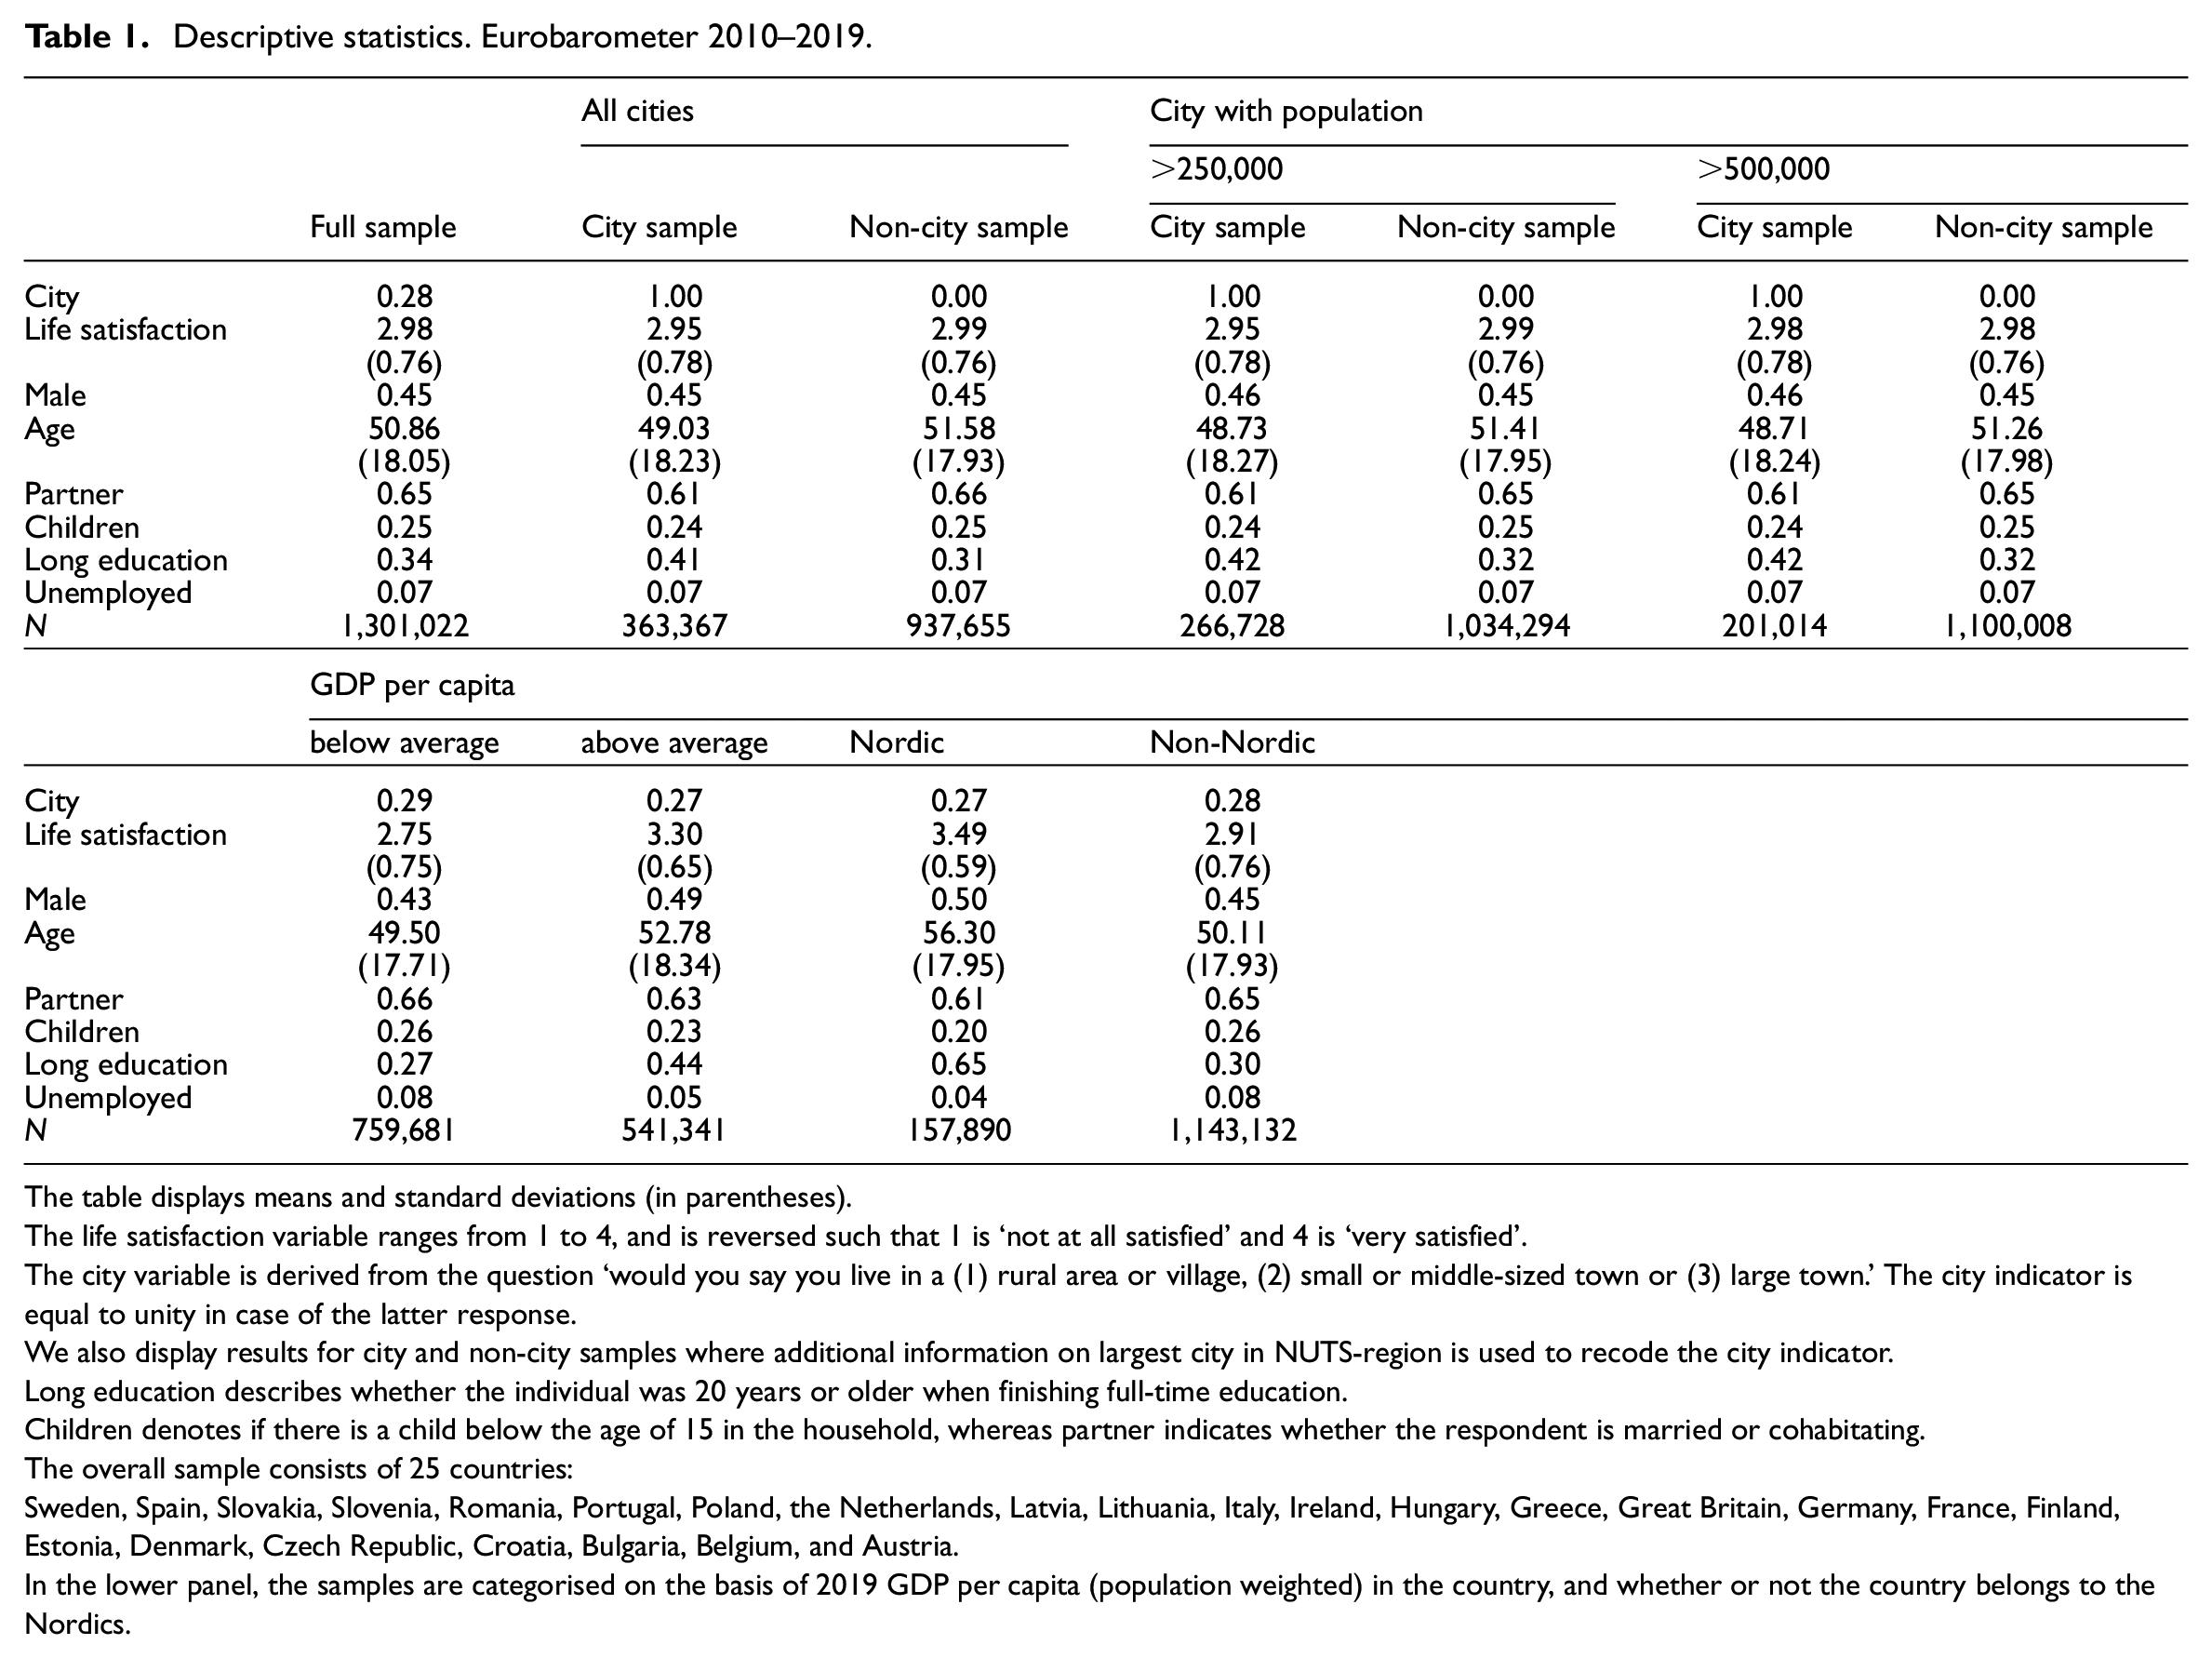
The table displays means and standard deviations (in parentheses).
The life satisfaction variable ranges from 1 to 4, and is reversed such that 1 is ‘not at all satisfied’ and 4 is ‘very satisfied’.
The city variable is derived from the question ‘would you say you live in a (1) rural area or village, (2) small or middle-sized town or (3) large town.’ The city indicator is equal to unity in case of the latter response.
We also display results for city and non-city samples where additional information on largest city in NUTS-region is used to recode the city indicator.
Long education describes whether the individual was 20 years or older when finishing full-time education.
Children denotes if there is a child below the age of 15 in the household, whereas partner indicates whether the respondent is married or cohabitating.
The overall sample consists of 25 countries:
Sweden, Spain, Slovakia, Slovenia, Romania, Portugal, Poland, the Netherlands, Latvia, Lithuania, Italy, Ireland, Hungary, Greece, Great Britain, Germany, France, Finland, Estonia, Denmark, Czech Republic, Croatia, Bulgaria, Belgium, and Austria.
In the lower panel, the samples are categorised on the basis of 2019 GDP per capita (population weighted) in the country, and whether or not the country belongs to the Nordics.
Twenty-eight per cent of the sample live in a city, 21% in a city with population above 250,000 and 15% in a city with a population above 500,000. Average life satisfaction is close to three, that is, the second highest alternative, and slightly lower in city areas with the exception of cities with a population above 500,000. About two-thirds have a partner, one-fourth have children below 15 in the household, one-third completed education at 20 years of age or older and 7% are unemployed. Comparison of the city/non-city samples shows that city dwellers are on average younger, a lower percentage of city dwellers have partner, and a higher percentage have long education.
In the second panel of Table 1, we split the sample according to GDP per capita in 2019 and whether the respondent lives in a Nordic country; more respondents live in countries with lower than average (weighted by population size) GDP per capita as richer EU countries tend to be bigger and therefore are represented in the surveys by a smaller percentage of the population. Average life satisfaction is considerably higher in richer countries, and especially in the Nordic countries.
Empirical approach and results
We estimate a series of pooled regressions with fixed effects for countries and survey waves to account for permanent differences in life satisfaction between countries and time trends common to all countries. We allow for direct effects of the sociodemographic variables on life satisfaction by including partner status, presence of children, long education, unemployment and a full set of 1-year age by sex fixed effects as explanatory variables. In the first part of the section, we include interaction effects of the respective city variables with the sociodemographic variables to test our main hypothesis. 6 In the second part, we also include three-way interactions between sociodemographic variables, city variables and GDP per capita/dummy for the Nordic countries (Denmark, Finland and Sweden) to examine whether and how interaction effects between city variables and sociodemographic variables depend on country income and living in a Nordic countries.
To check that our data set produces associations between life satisfaction and personal characteristics/city living that are broadly consistent with the existing literature on subjective well-being, we start by running regressions explaining life satisfaction as a function only of sociodemographic and city variables in addition to survey wave and country fixed effects. Consistent with expectations, we find that life satisfaction is U-shaped in age, higher for partners and people with long education and lower for the unemployed; also consistent with several studies, we find a negative effect of living in a city and the effect is strongest for the largest cities (Online Supplemental Appendix Table A.1).
Testing the hypothesis
According to our main hypothesis, young, female, single and well-educated persons are relatively most satisfied with city living, implying negative coefficients for the interaction terms between city variables and age, male and partner status, whereas positive coefficients are expected for interaction terms between city variables and long education.
Coefficients of interaction terms with age, partner status and long education are consistent with our hypothesis and statistically significant (Table 2). We find that an increase in age (up to 50–60 years of age) is associated with a steeper decline, or a smaller increase, in life satisfaction in cities than in non-city areas. This aligns with younger persons valuing urban qualities such as better education and career opportunities and social/matching prospects more than older persons, who may be more sensitive to city features like crime, pollution, housing affordability, and limited access to nature. Individuals with long education tend to prefer cities, which may reflect that they benefit from the urban wage premium and appreciate the wide range of goods and service available in cities. In contrast, having a partner is associated with lower life satisfaction in cities, possibly because the urban advantages related to matching and social interaction are less relevant for this group, and they may be more sensitive to high housing costs. Contrary to expectations, the coefficient of the interaction term with male is close to zero and statistically insignificant.
Life satisfaction in the city for sociodemographic groups.

All regressions include survey wave, country, and age by sex fixed effects, and student status.
Robust standard errors are in parentheses.
In the theory section, we concluded that the effects of children in the household and unemployment on preferences for city living are ambiguous. The coefficients of interaction terms with children and unemployment are, respectively, close to zero and insignificant and negative and significant. Hence, the presence of children does not affect preferences for city living, whereas being unemployed decreases life satisfaction most in cities. A possible interpretation of the latter result is that work income is most important in cities due to the higher costs of living in urban areas.
Unemployment shows the strongest relationship with life satisfaction: expected life satisfaction decreases by 0.40 (about half a standard deviation of life satisfaction) in cities and by 0.36 in non-city areas. 7 The association with having a long education or a partner is about half as strong, or approximately equal to one quarter of a standard deviation: in cities (non-city areas) expected life satisfaction increases by 0.19 (0.16) if the respondent has long education and by 0.17 (0.20) if respondent has a partner. 8
Robustness tests
We test the robustness of our results by conducting several checks. First, we use an ordered probit model to estimate our specification, given that the dependent variable is discrete, and we weigh observations in accordance with country population size in 2019, ensuring that every inhabitant has the same expected impact on the results, independent of country of residence (see Online Supplemental Appendix Table A.4 for both results). Next, we consider two alternative cut-off ages for definition of long education − older than 17 and older than 22 years (see Online Supplemental Appendix Table A.5). A comparison with Table 2 shows that the main conclusions are robust. The coefficients of the interaction terms of city variables with age, partner status, long education and unemployment have the same signs and, with the exception of interactions with age and unemployment in the weighted regressions, remain statistically significant.
Country income/welfare regime
We first check how associations between life satisfaction and sociodemographic/city variables depend on GDP per capita/living in a Nordic country. Consistent with earlier studies, we find that the negative effect of living in a city is increasing in GDP per capita (Online Supplemental Appendix Table A.6). The estimates imply that city living has a positive or neutral effect on life satisfaction in the poorer EU members and a negative effect in the rest of the EU. This result is consistent with the hypothesis advanced by Easterlin et al. (2011), Burger et al. (2020) and Burger (2021) that economic progress initially creates urbanisation and higher income in cities, whereas rural areas subsequently catch up as urban centres expand and mobility increases, becoming more diversified and accessible, and benefitting from urban amenities without incurring the drawbacks of city living.
The interaction term between city variables and the dummy for Nordic countries is positive and significant. The coefficients imply that the association between city living and life satisfaction is positive in the Nordic countries even though GDP per capita is among the highest in the EU.
An increase in GDP per capita as well as living in a Nordic country raise expected life satisfaction (relative to reference categories) for the elderly, women, partners, and the low-educated (Online Supplemental Appendix Table A.7). GDP per capita does not affect the impact on life satisfaction of children in the households, whereas in the Nordic countries, children contribute to higher life satisfaction. The negative effect of being unemployed is weaker in the Nordic countries than in the rest of the EU. The differences between Nordic and other countries are consistent with a hypothesis that generous welfare states improve subjective well-being of groups with on average relatively low income (elderly, unemployed, women, low-educated).
GDP per capita
In Table 3, we put all ingredients together and present regressions with three types of two-way interaction terms - between city variables and sociodemographic variables, sociodemographic variables and GDP per capita/the Nordic dummy, and city variables and GDP per capita/the Nordic dummy – as well as three-way interaction terms between all three variable categories. Coefficients of the three-way effects state how the associations between sociodemographic variables and preferences for city living vary between countries. 9
Life satisfaction in the city for sociodemographic groups. Interaction terms with GDP per capita and welfare state regime.

The Nordic countries consist of Sweden, Denmark, and Finland.
GDP per capita is measured in 10,000 USD and as deviations from population weighted average.
In columns (2), (4), and (6), interaction terms with significance level below 5% are omitted.
All regressions include survey wave, country, and age by sex fixed effects, and student status.
Robust standard errors are in parentheses.
The one-way interaction term is statistically significant in all specifications: the interaction between male, city living and GDP per capita has a negative and significant coefficient, whereas the two-way interaction effects between male and city living and male and GDP per capita are close to zero and insignificant. The implication of these coefficients is that cities become relatively less attractive to men as the country grows richer, whereas for women country income does not affect preferences for living in cities versus non-city areas. Relative to women, men prefer cities in the poorest EU countries and non-city areas in the richest EU-countries. Moving from the poorest to the richest EU countries reduces expected life satisfaction of men in cities compared to other areas by approximately 0.07, or about 10% of a standard deviation. A possible explanation is that city living is relatively more difficult for men in richer countries because the trend towards deindustrialisation has bigger consequences for cities and has proceeded further in rich countries.
Living in a Nordic country
Two-way interaction terms with the dummy for Nordic countries are consistently significant: with partner (positive coefficient) and long education (negative coefficient). The two-way interaction term between partner and living in a city has a negative coefficient that is lower in magnitude than the coefficient of the three-way interaction term, implying that having a partner increases preferences for city living in Nordic countries and reduces preferences for city living in other countries. However, the direct effect of a partner is considerably larger than the interaction effects, implying that having a partner always raises expected life satisfaction.
The coefficients of the three-way and two-way interaction terms with the indicator for long education, indicate that having a long education in a Nordic country raises expected life satisfaction less than in other countries. The difference is considerable (about half of the positive effect of long education disappears) and larger for city residents (0.1 less in cities and 0.07 less in non-city areas). A possible interpretation is that the equalising effect of a generous welfare state is more important for city residents as higher income is required in cities to obtain a good living standard.
Conclusion and discussion
Based on Eurobarometer survey waves during 2010–2019 with almost 1.5 million respondents, our empirical analysis produces three main conclusions. First, as outlined in the theory section, several authors argue that cities are particularly attractive to young, single and well-educated people. Our empirical results are consistent with this hypothesis. We also find that the unemployed tend to be least satisfied in cities relative to the rest of the population. Second, sex is on average not associated with preferences for city living: compared to the opposite sex, women (men) are relatively more satisfied with city life in the richest (poorest) EU countries.
Third, the associations between sociodemographic variables and life satisfaction differ between the Nordic countries and the rest of EU: the elderly, women, couples with children, the low-educated and the unemployed fare better in the Nordic countries relative to other groups. These effects are found both in city and non-city areas and may be due to features of the Nordic welfare state, such as income equalisation, good public services, and universal welfare benefits. Whereas average life satisfaction in rich EU countries tends to be lower in cities, average life satisfaction in the Nordic countries is higher in the cities. Hence, the Nordic model seems to be conducive to city life, but the sociodemographic groups that benefit most from the model fare better in both urban and rural areas.
Whereas these conclusions are robust with respect to choice of statistical estimator and definitions of variables, we should emphasise that the relations between sociodemographic variables and preferences for city living should not be interpreted as causal. Although there are considerable barriers to mobility for the majority of inhabitants (Carlsen and Leknes, 2021), mobility may create correlations between unobservable characteristics of respondents and traits of the places of residence.
A strength of our study is that we provide a more complete description of preferences for city living than earlier studies by considering several interaction effects with sociodemographic variables. In addition, the sociodemographic variables interacted with the city dummy are included simultaneously in the regressions, which reduces the risk of spurious effects of personal characteristics that are correlated. Information about subjective well-being in cities of different sociodemographic groups is valuable to decision makers. City planners and local politicians typically want their cities to be inclusive places, where a variety of individuals are happy with their lives. Our study gives information about groups that should receive special attention as they report relatively lower life satisfaction in cities than in other areas, for instance, by making sure that these groups are heard in the cities’ planning and budgeting processes.
Another strength of our study is that the large number of respondents allows us to identify differences in life satisfaction between cities and non-cities areas even when moderate in magnitude, as well as to compare combined effects of city living and personal characteristics with the direct effects of personal characteristics. For instance, we are able to conclude that having a partner is always associated with higher life satisfaction, independent of area of residence.
A third strength of our contribution is that we compare effects of sociodemographic variables across groups of countries. Our results indicate that European countries differ with respect to which groups are most happy with city life. Since global heterogeneity is larger than heterogeneity within Europe, our results indicate that there may exist differences across countries in preferences for city living also on a global scale.
Our study suggests promising avenues for future work. First, countries differ in other aspects than income level and welfare regime, including culture, inequality, and industry structure. For instance, values, such as trust in others and obedience, as well as inequality in disposable income, vary considerably within the EU (Eurostat, 2023; Tabellini, 2010). Examining heterogeneity in determinants of preferences for city living across these other dimensions may prove fruitful.
Second, cities are heterogeneous in several dimensions, including size, density, inequality, industry structure, pollution, and social capital. Future studies should examine how the various dimensions affect sociodemographic differences in preferences for city living as well as how life satisfaction of different groups is affected by travelling distance to larger cities along the lines suggested by Lenzi and Perucca (2021).
A third extension is to use survey data for longer periods to explore how differences in preferences for city living have evolved over time. Some decades ago, the richest countries in the European Union had the same income level as the poorest members have today. Did they at that time exhibit the same empirical pattern as the poorest countries do today? Finally, the literature may benefit from similar empirical studies for other continents, including poorer parts of the world.
Supplemental Material
sj-pdf-1-usj-10.1177_00420980241310375 – Supplemental material for Who are satisfied with life in cities? Evidence for 25 European countries
Supplemental material, sj-pdf-1-usj-10.1177_00420980241310375 for Who are satisfied with life in cities? Evidence for 25 European countries by Fredrik Carlsen and Stefan Leknes in Urban Studies
Supplemental Material
sj-pdf-2-usj-10.1177_00420980241310375 – Supplemental material for Who are satisfied with life in cities? Evidence for 25 European countries
Supplemental material, sj-pdf-2-usj-10.1177_00420980241310375 for Who are satisfied with life in cities? Evidence for 25 European countries by Fredrik Carlsen and Stefan Leknes in Urban Studies
Footnotes
Declaration of conflicting interests
Funding
ORCID iDs
Supplemental material
References
Supplementary Material
Please find the following supplemental material available below.
For Open Access articles published under a Creative Commons License, all supplemental material carries the same license as the article it is associated with.
For non-Open Access articles published, all supplemental material carries a non-exclusive license, and permission requests for re-use of supplemental material or any part of supplemental material shall be sent directly to the copyright owner as specified in the copyright notice associated with the article.