
Abstract
Introduction
Shale gas reservoir has become an important source of natural gas, and a significant portion of the gas in this reservoir exists in an adsorbed state. Thus, knowledge of gas adsorption behavior is important to estimate gas in place. Researchers all over the world have done many studies on shale gas adsorption characteristics and influence factors. Lu et al. (1995), who measured isothermal adsorption curves of Devonian shale samples by experiments, found that the amount of the adsorbed phase depended on the pressure and temperature. Chalmers and Bustin (2008) investigated the geological controls on methane sorption capacity for the Lower Cretaceous Buckinghorse Formation and equivalent strata in northeastern British Columbia and drew a conclusion that total organic content (TOC) was the most significant control on methane sorption capacity and other important factors included the kerogen type, maturity, and clay content, in particular, abundance of illite. Zhang et al. (2012) conducted a series of methane adsorption experiments on bulk organic-rich shale and their isolated kerogen at different temperatures and pressures and found that the total amount of methane adsorbed was directly proportional to the TOC and was related to kerogen type. Liming et al. (2012) studied the methane adsorption of clay rocks which is the main components of shale and the results show that clay mineral type greatly affects CH4 sorption capacity under experimental conditions. All the obtained conclusions above were based on experiments qualitatively. In this paper, we study shale gas adsorption influence factors quantitatively and systematically using simplified local density (SLD) model, including temperature, pressure, pore type, diameters, and so on. The SLD model which was first developed by Rangarajan et al. (1995) can be used to describe the adsorption behavior of pure gases. It has been successfully used in several studies on gas adsorption on activated carbon and coal (Fitzgerald et al., 2003, 2006; Mohammad et al., 2011). Recently, it was used in shale gas adsorption (Chareonsuppanimit et al., 2012, 2015, 2016), and yet the conclusions were not systematically and quantitatively obtained.
Simplified local density adsorption model
The SLD model envisions the adsorbent to be composed of rectangular-shaped slits and the adsorbate molecules reside within these two surface slits (Figure 1).
Slit pore of SLD model (Fitzgerald et al., 2003). SLD: simplified local density.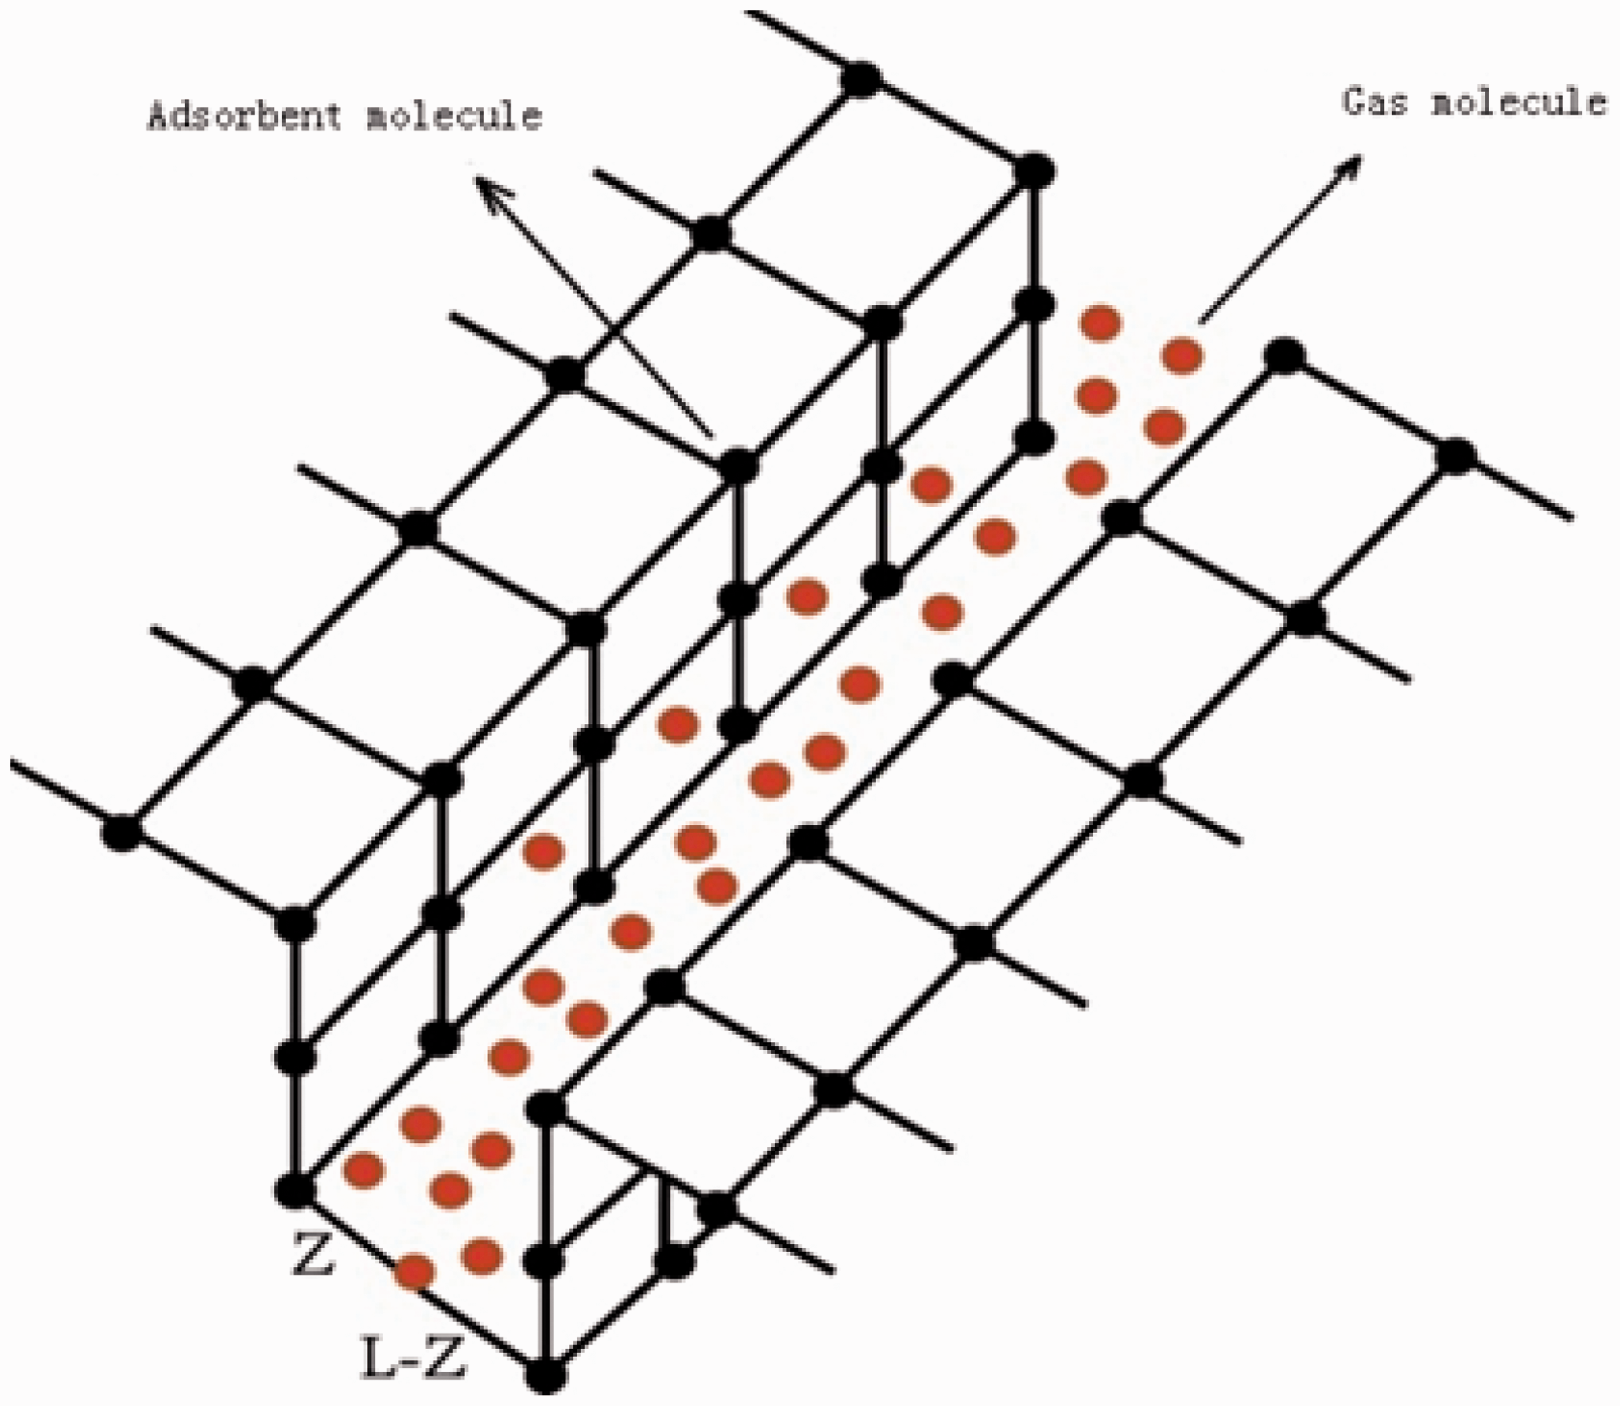
A molecule within a slit has interactions with both walls of the adsorbent slit. The SLD model accounts for both fluid–fluid and fluid–solid interactions in the slit-shaped pore. Several researchers have used different equations of state within the SLD framework (Chen et al., 1997; Soule et al., 2001; Yang and Lira, 2012), and the Peng–Robinson equation of state (PR EOS) is used in this study. At equilibrium, the chemical potential of the fluid 


Substituting equations (2), (3), and (4) into equation (1), the equilibrium relationship for adsorption within the slit is


Applying the SLD model, the excess adsorption (


The fugacity of the bulk fluid using PR EOS is

For the adsorbing fluid, the fugacity for fluid–fluid interactions is

The parameter
For 


For 2 < 


For 1.5 ≤ 
For 1 ≤ 
And 
Database employed for adsorption modeling over large temperature ranges
Database and SLD regression parameters for methane adsorption on kerogen and clay minerals.

Geochemical characteristics of three kinds of kerogen (Zhang et al., 2012).

HI: hydrocarbon generation index; OI: oxygen index; PI: PI = S1/(S1 + S2).
The following methodology was used in this work:
The SLD model parameters (namely surface area, The regressed values of The generalized values of
Results and discussion
SLD model representations for gas adsorption on kerogens and clay minerals
The SLD model was used to match gas adsorption data on several kerogens from the literature. Table 1 presents the model parameters for each of the experimental data used in this research. The regression results produced parameters that characterize adsorbent surface properties such as the surface area, effective pore width, and solid–fluid interaction energy. These regressed parameters were within the range as expected of kerogens and clay minerals. The regressed parameter SLD model representations of methane adsorption on: (a) type I kerogen, (b) type II kerogen, and (c) type III kerogen (points are data from Zhang et al. (2012)). SLD: simplified local density. (a) SLD model representations of methane adsorption on smectite (points are data from Liming et al. (2012)), (b). SLD model representations of methane adsorption on illite (points are data from Hartman et al. (2008)), (c) SLD model representations of methane adsorption on smectite/illite mixed (points are data from Liming et al. (2012)), and (d) SLD model representations of methane adsorption on chlorite (points are data from Liming et al. (2012)). SLD: simplified local density.

Impact of temperature on gas adsorption
Local molecular density in pores can be obtained by equation (14). The ratio of excess adsorption gas to free gas then can be given by

And the ratio of excess adsorption gas to total gas in a pore is given by

Take type I kerogen for an example, the local gas density in a pore with diameter of 2 nm at a fixed pressure of 1 MPa under temperature of 35.4, 50.4, and 65.4℃, respectively, is given in Figure 4. It is shown that there is a peak density near the pore face. The local gas density in the middle of the pore is the lowest. The increment of density as temperature decreases near the pore face is significant, but the bulk gas density shows a very small change due to temperature change.
Local gas densities of a 2 nm pore at a fixed pressure of 1 MPa under different temperatures.
Impact of pressure on gas adsorption
Figure 5 demonstrates the local gas density of various kerogen pores with a fixed diameter of 1.5 nm and a fixed temperature of 35.4℃ under different pressures. It is shown that the gas peak density and the bulk density increase as pressure increases. The ratio of excess adsorption gas to free gas using equation (24) is shown in Figure 6. It can be seen that in a specific pore the ratio declines and its rate slows down as pressure increases. It can be inferred that with the pressure increasing continuously the excess gas adsorption may reach a very low level and the gas in the pore can all be considered as free gas. Zuo et al. (2016) drew the same conclusion in their experiment. So using Langmuir equation to calculate excess gas adsorption of shale is not valid when the pressure is very high, and the gas-in-place calculation should also take this into consideration.
Local gas density of pores at a fixed diameter of 1.5 nm and temperature of 35.4℃ under different pressure: (a) type I kerogen, (b) type II kerogen, and (c) type III kerogen. Ratio of excess adsorption gas to free gas under different pressures with a fixed diameter of 1.5 nm and a fixed temperature of 35.4℃.

Impact of pore type and diameter on gas adsorption
From Figures 2 and 3, it can be seen that the gas excess adsorption capacity varies with different kinds of matters by experimental data. Because type I kerogen and type III kerogen have the lowest and the largest excess gas adsorption capacity, respectively, the peak gas density of type I kerogen is the lowest and type III kerogen is the highest under the same condition when compared to the other two kinds of kerogens from Figure 5. The ratio of excess adsorption gas to free gas is also impacted by pore types too. From Figure 6 it can be seen that the type I kerogen has the lowest ratio and type III kerogen has the highest ratio under the same conditions of temperature, pressure, and pore diameter. And the ratio decline rate is the highest as the pressure of type III kerogen increases. Pore diameters also have a great impact on gas adsorption. Figure 7 illustrates the ratio of excess adsorption gas to free gas with various pore diameters under 35.4℃ and 4 MPa. The ratio of excess adsorption gas to free gas declines as pore diameter increases and pores of different types have different ratios under the same condition. The ratio of excess adsorption gas to total gas amount in different pores with different pore diameters calculated by equation (25) is shown in Figure 8. As is shown, when the pore diameter increased from 1.5 to 5 nm, the ratio of excess adsorption gas to the total gas amount decreases rapidly. The excess adsorption gas of type III kerogen takes up 89% of the total gas amount with diameter of 1.5 nm and takes 70% of the total gas amount with diameter increases to 5 nm, and the reduction ratio due to increase of pore diameter is 21%. The excess adsorption gas of type I kerogen takes 71% of the total gas amount with diameter of 1.5 nm and takes up 43% of the total gas amount with diameter increases to 5 nm, and the reduction ratio due to increase of pore diameter is 39%.
Ratio of excess adsorption gas to free gas with various pore diameters under 35.4℃ and 4 MPa. Ratio of excess adsorption gas to total gas amount with various pore diameters under 35.4℃ and 4 MPa.

Conclusions
The experimental data from literature were regressed, and the SLD model parameters, surface area, slit length, and solid–fluid interaction energy were obtained. It was found that the SLD-PR method can well represent isothermal curves of kerogen and clay minerals. The solid–fluid interaction energy showed a linear relationship with temperature and it provided gas adsorption on kerogen and clay minerals over a wide range of temperature. The gas local densities in pores under different conditions were calculated by SLD method. The excess gas adsorption amount and free gas under different conditions were also calculated from gas local densities. It was found that the main factors that affected the shale adsorption gas were temperature, pore type and diameter, pressure, and clay content.