
Abstract
Keywords
Introduction
Organic matter (OM) is not only the source of shale gases but is also the dominant sorption substance in shales (Gasparik et al., 2014; Hill et al., 2007; Lane et al., 1991; Rodriguez and Paul, 2010; Romero and Paul, 2012). The total organic carbon (TOC) content and the type and thermal maturity of kerogen are major factors that define the sorption roles of OM in shales (Bowker, 2007; Chalmers and Bustin, 2007; 2008; Curtis et al., 2012; Guo et al., 2014; Hartwig and Schulz, 2010; Hu et al., 2015; Lu et al., 1995; Manger, 1991; Merkel et al., 2016; Tian et al., 2016; Zhang et al., 2012). For example, it has been demonstrated that thermal maturity is the key factor for pore development in shales as it promotes the formation of both micropores and mesopores (macropores) in kerogen and mineral matrix (Bakshi et al., 2018; Bust et al., 2012; Chalmers and Bustin, 2007; Kang et al., 2010; Schettler et al., 1991; Tan et al., 2014; Wang et al., 2013; 2016). As the TOC content is regarded as the major proxy in shale gas evaluation, the methane adsorption capacity (MAC) of kerogen is the primary factor in the resource assessment of the shale gas. However, there is a fundamental lack of quantitative evaluation on kerogen adsorption capacity and the influence of soluble organic matter (SOM) on the sorption of shales. This study aimed to quantitatively evaluate the role of OM in the adsorption capacity of shales. Therefore, the influence of OM on the MAC of shale was examined by quantitatively measuring the MAC of shale with varying maturity, shale with SOM removed, and kerogen, and by comparing the changes in their adsorption capacities.
The Upper Yangtze region covers a vast area over the Yunnan Province, Sichuan Province, Guizhou Province, and Chongqing metropolitan (Figure 1), and is associated with widely distributed Palaeozoic organic-rich marine shales in this region (Li et al., 2019a, Zou et al., 2010). The Palaeozoic shales (Li et al., 2019b, Li et al., 2020) include the Lower Cambrian Qiong-zhu-si Formation shales, Lower Silurian Long-ma-xi Formation shales, and Upper Permian shales (Figure 2). These shales exhibit high thicknesses and TOC, in addition to spatial variation. The Lower Cambrian Qiong-zhu-si Formation shales are mainly distributed in the Sichuan basin, and their thickness varies from 74 to 400 m (average 139 m), whereas their TOC content is in the range of 0.5–4.0 wt.% and is mainly composed of sapropel type OM with vitrinite reflectance (Ro) of 2.0–5.0% (Li et al., 2009b, Li et al., 2009c). The Lower Silurian Long-ma-xi Formation shales are widely distributed throughout this region and contain mainly black carbonaceous shales with a thickness of a few meters to 500 m, with an average of 120 m. The average TOC content of the Silurian shales is approximately 4.0 wt.%, and the OM is mainly of the sapropel type. The Silurian shales have been considered as the most prospective shale gas reserves in this region owing to their thermal maturity, as their Ro values are in a narrow range of 2.0–4.5%, which favours the formation and preservation of shale gas. In comparison with the high thickness and maturity of the Cambrian and Silurian shales, the Upper Permian Da-long Formation shales in the Sichuan Province are characterised by a lower thermal maturity and considerably lower thickness of approximately 40 m, associated with a TOC content of 0.16–14.6 wt.% (Li et al., 2009a). The fundamental lithological and geochemical properties of these Palaeozoic shales favour the formation and preservation of shale gas.

Geographic location and tectonic division of the Upper Yangtze region, modified after Wang et al., 2013. Note. I Yan-yuan-Li-jiang platform margin depression fold belt; II Kang-dian uplift; III Xi-chang basin; IV Emei Mountain-Liang Montain block-faulted belt; V Long-men Mountain platform margin depression fold belt; VI Mi-chang Mountain platform margin depression fold belt; VII Da-ba Mountain platform margin depression fold belt; VIII Yunan-Guizhou-Sichuan-Hubei platform fold belt.
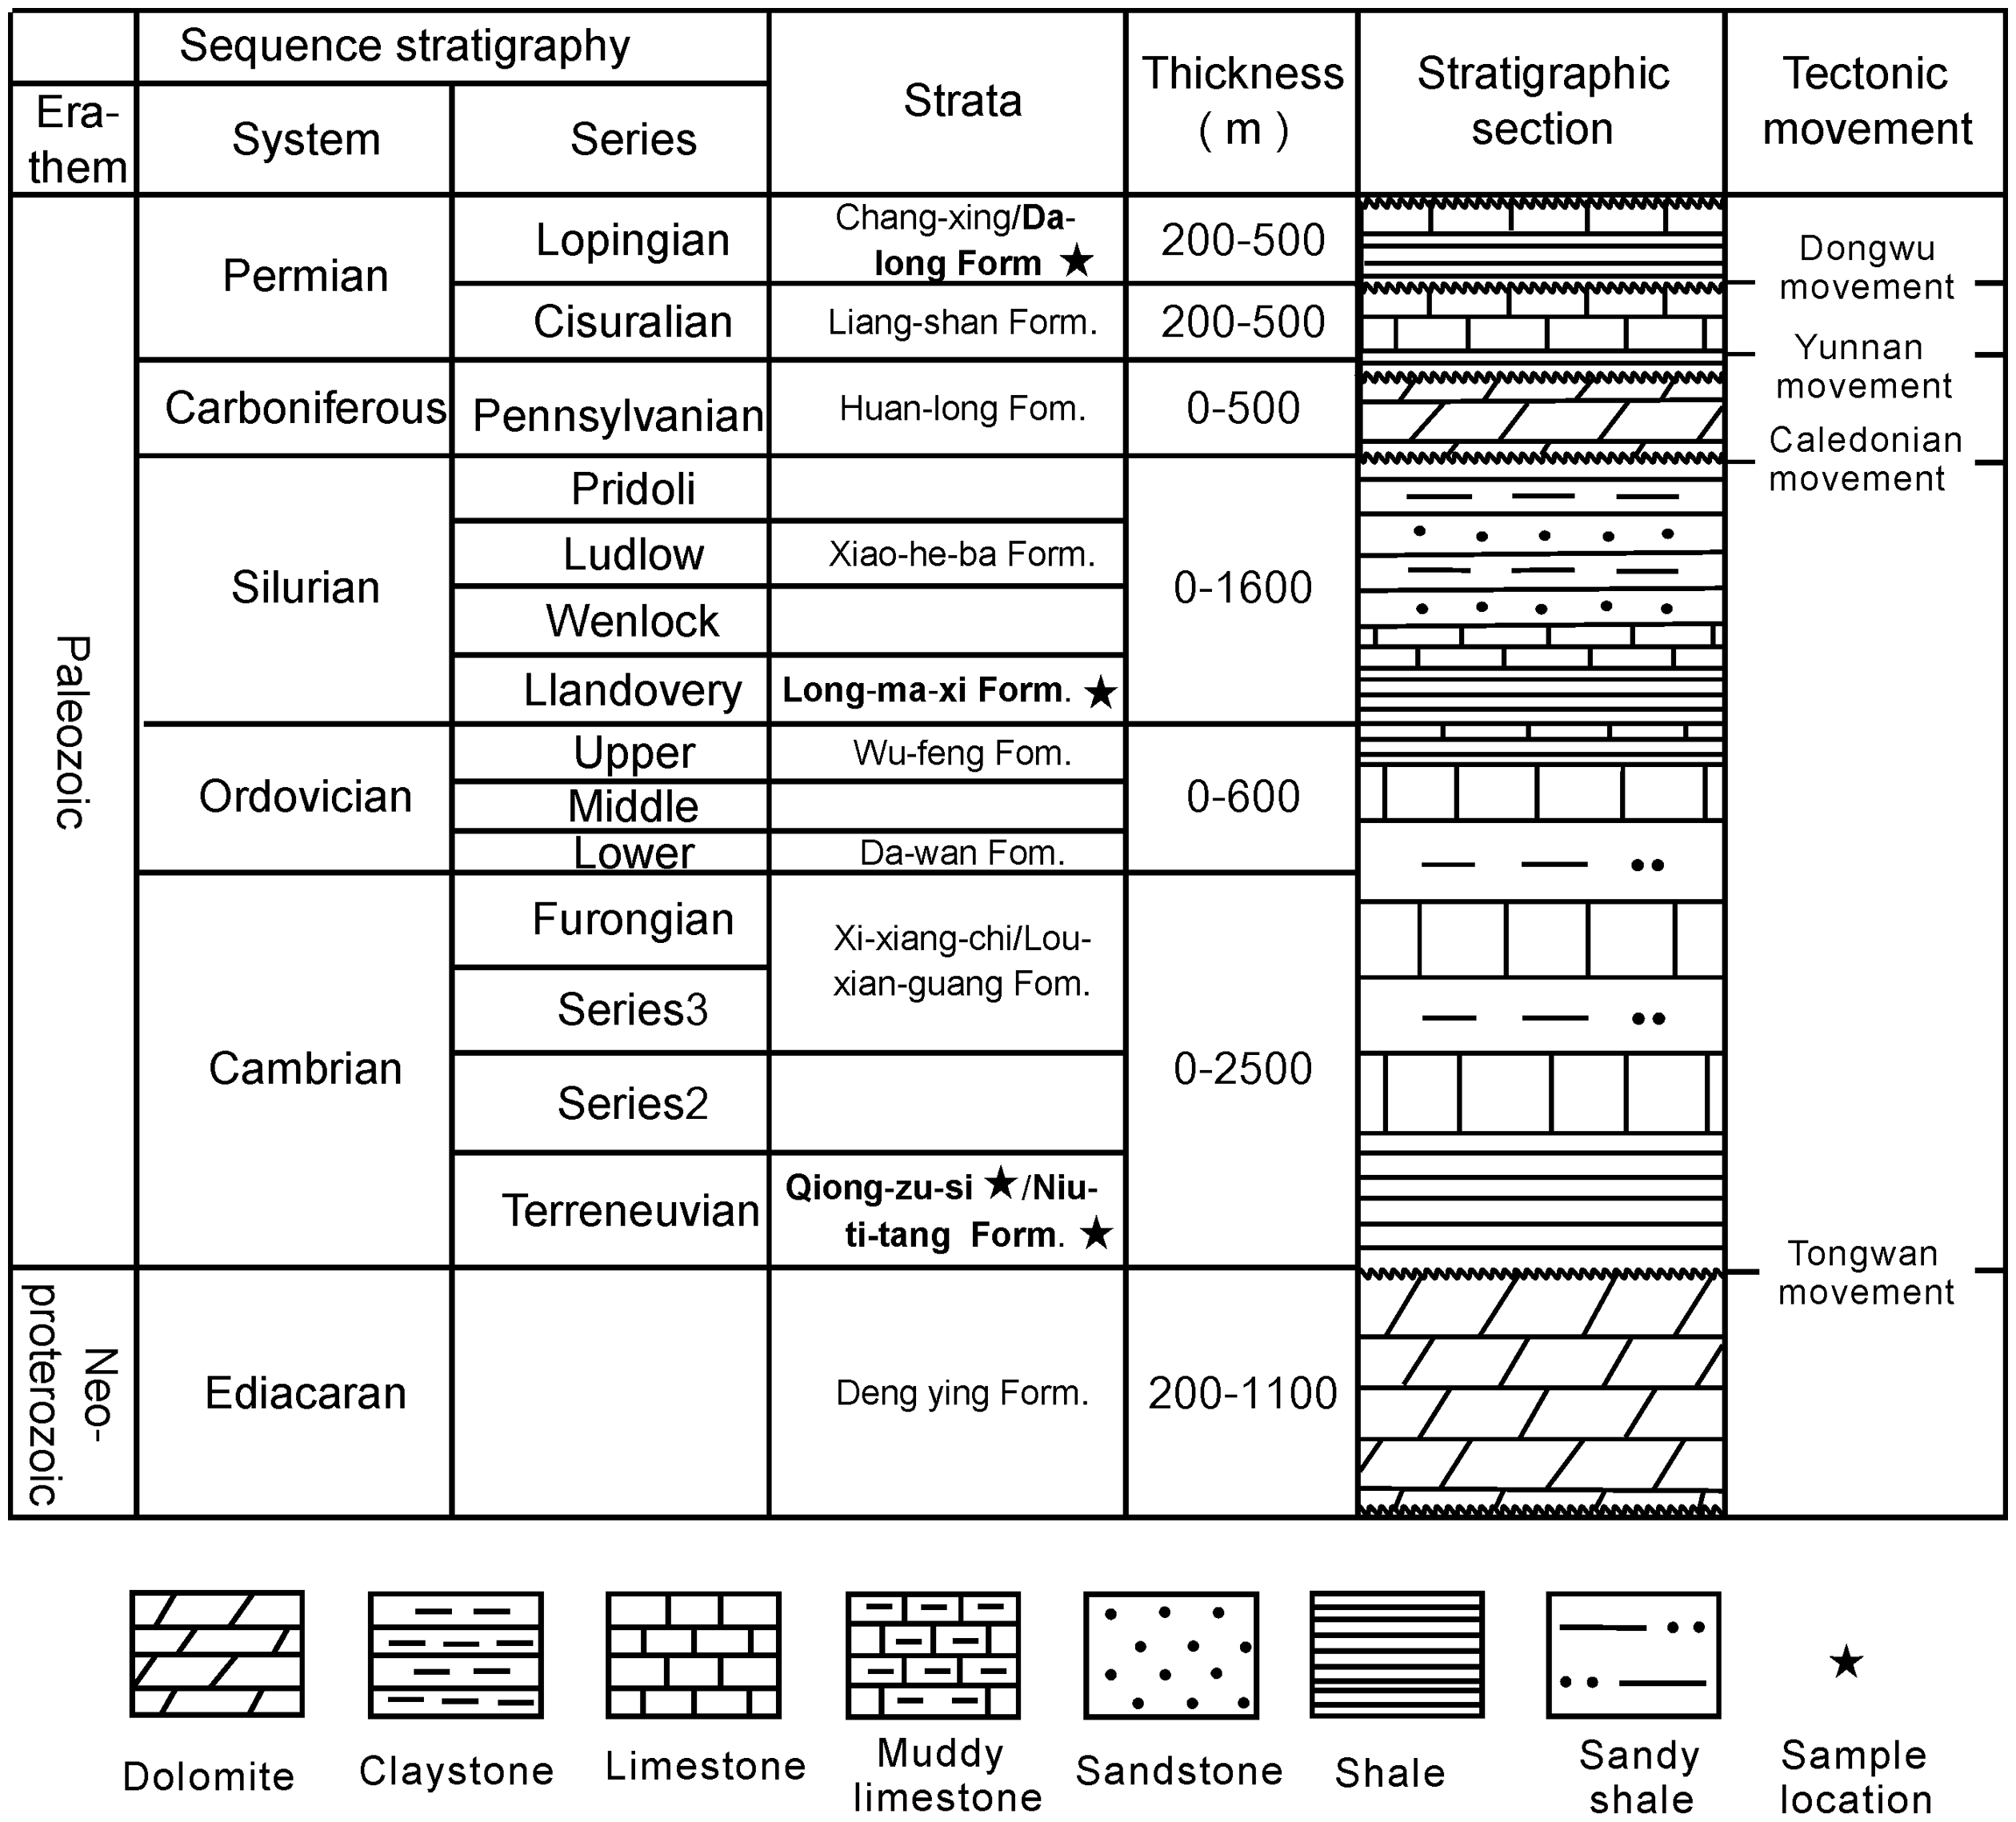
Palaeozoic stratigraphic system of the study area, modified after Wang et al., 2013.
Several studies have been conducted on factors influencing the adsorption of Palaeozoic shales in China (Tan et al., 2014; Tian et al., 2016). However, mechanical studies, particularly those on shale OM adsorption, are scarce. The type of OM, maturity, SOM, and kerogen, all affect the adsorption of shale. Therefore, by conducting a series of measurements on the adsorption capacity of kerogen in the Palaeozoic shales from the Upper Yangtze region and comparing the influence of SOM on the adsorption capacity of shales, this study aimed at quantitatively evaluating the role of OM in methane adsorption of shales to provide a deeper understanding of the occurrence of shale gas.
Samples and experimental method
Samples
Ten samples were collected from the lower Cambrian-upper Permian from the Sichuan Province and Guizhou Province (Figures 1 and 2), one immature Paleogene oil shale from the Guangdong Province, and one immature Triassic coal sample from the Guangxi Province. The details of the strata ages, sampling locations, lithological features, TOC content, and pyrolysis results are listed in Table 1.
Geological and geochemical information of shale samples.

Age is geological age: ϵ1 — Lower Cambrian; S1 — Lower Silurian; P2 — Upper Permian; T2 — Middle Triassic; E2 — Middle Paleogene; Fm.— Formation.
Samples with no available T
Experimental procedures
All samples were initially surface cleaned using analytical reagent ethanol and then crushed to 100 mesh and dried at 110 °C for 48 h before further treatment. Powdered samples were Soxhlet extracted using a mixture of CH2Cl2/MeOH (9:1) to obtain the SOM. The SOM removed powder residues were dried and stored for methane adsorption analysis, while the solvent extracts (i.e. SOM) were subjected to chromatographic separation using alumina/silica gel column and divided into aliphatic, aromatic, and polar fractions using hexane, a mixture of hexane/CH2Cl2 (4:1), and a mixture of CH2Cl2/MeOH (1:1) as eluents, respectively. The SOM removed powder residues of shales were subjected to kerogen isolation following the procedure of the Standardization Administration of the People’s Republic of China (SAC) for isolating kerogen from rocks (SAC, 2010), and dried for methane sorption measurement. The instrument details and analytical items used in this study are presented in Table 2.
Instrument information and related analysis items.

TOC contents of the shales were measured using a LECO C230 elemental analyser. Powdered samples of approximately 100 mg were initially treated with 5% HCl at 80 °C to remove the carbonates, and then washed with pure water six times to remove residual HCl. The HCl-treated and dried powder residues were mixed with iron powder and tungsten-tin alloy as additives for combustion, with O2 as the combustion accelerating gas and N2 as the carrier gas. The combustion temperature of the analyser was automatically increased to 3000 °C, and the TOC was calculated by the peak area of CO2 generated from combustion of the OM.
The thermal pyrolysis was conducted on a Rock-Eval 6 (French Vinci Technologies). The Tmax temperature generated by pyrolysis was regarded as an alternative to the maturity index, as the maturity of most shales was significantly high to directly measure their vitrinite reflectance (Ro).
The gas chromatography analyses of aliphatic and aromatic hydrocarbons were conducted on an Agilent 7890 A GC system using a flame ionisation detector. An HP-5 fused silica column (30 m × 0.32 mm i.d.; film thickness 0.25 μm) was used. The injector and detector temperatures were 290 and 300 °C, respectively. The samples were injected in splitless mode, and N2 was used as the carrier gas. The oven temperature was initially 80 °C (held for 1.5 min) and was programmed to increase at 4 °C/min till it reached 290 °C (held for 20 min).
The aromatic compounds were further identified using a gas chromatography-mass spectrometer (GC-MS) with an HP 6890 series II GC instrument interfaced to an HP5972 mass spectrometer (electron impact ion source, 70 eV). GC conditions were as above and helium was used as the carrier gas with a flow rate of 1.0 ml/min. The MS scan range was m/z 50–600 da.
The mineral composition of these Palaeozoic shales and other samples was analysed using a Bruker D8 advance X-ray diffractometer (XRD), with an Ni filter and Cu K alpha radiation (λ = 0.154 nm), a voltage of 40 kV, and a current of 40 mA. A scan rate of 1° (2
Methane sorption of the initial shales, solvent extracted shales, and isolated kerogen was conducted in a high-pressure gas isothermal sorption instrument of PCT Pro E&E, manufactured by France Setaram Instrumentation. The experimental pressure of the instrument was set in the range of 0–12 MPa with a pressure increment of 1 MPa between the two neighbouring equilibration points. Helium was used as the calibration gas with N2 as the valve carrier gas. The case temperature (Tr) of the instrument was set to be constant at 28.8 °C, while the sample cell temperature was set at 60 °C within an error (△t) of ±0.2 °C. The sorption volume of the samples was calculated with respect to that of standard gas at 0 °C and 1 atm pressure. The room temperature of the laboratory was maintained at approximately 26 °C using a central air conditioner. The relative standard deviation of the sorption measurement was 1.62% for the kerogen sample (based on six measurements on the same kerogen sample) and 2.36% for the shale sample (based on six measurements on the same shale sample). The improved experimental method mainly used a larger sample cell, and the test accuracy was higher. The shale sample had a mass of 20–30 g in comparison with the sample mass of 8 g used in a previous study (Wang et al., 2013).
Calculation methods
Methane sorption of the initial shales, solvent extracted shales, and isolated kerogen was tested under the instrumental conditions of 60 °C and 12 MPa, and this adsorption volume was automatically converted into a volume at 0 °C and 1 atm (STP) using the software of the high-pressure gas isothermal sorption instrument. Under medium and low pressures, the adsorption curve of the shale methane conformed to the Langmuir equation, which is expressed as follows:

OM content is an important factor affecting the MAC of shale. Kerogen is generally considered to be the OM in sedimentary rocks insoluble in conventional organic agents. The OM in shale is divided into kerogen and SOM, where kerogen accounts for 80–99 wt.% and SOM accounts for 1–20 wt.% (Tissot and Welte, 1984). The influence of SOM on the MAC of shale can be quantified by the difference (Δ) of MAC between the extracted and initial shales under an equilibrium pressure of 12 MPa. This can be expressed as follows:

The impact of SOM on the methane sorption of the total shale can be expressed as follows:

When kerogen is obtained by removing minerals from the extracted shale, changes in the pore structure of the OM are inevitable. In this process, the loss of the adsorption point of methane mainly includes the loss of the specific surface area of minerals and mineral OM complexes. As kerogen is insoluble in strong acids, the specific surface area of kerogen and its interior remains almost constant. However, owing to the relatively large specific surface area and strong adsorption capacity of kerogen, the study on the adsorption capacity of kerogen is of immense significance for understanding the adsorption effect of OM on shale. Additionally, we can also identify the extent to which the removed mineral affects the extracted shale. The contribution of kerogen to the adsorption capacity of the extracted shale can be demonstrated by the following equation.

Thus, β can be calculated by modifying equation (4) as

The contribution of minerals or their impact on the MAC of the extracted shale is γ, which can be expressed as

Results and discussion
TOC content and type of OM
The TOC content and pyrolysis parameters of the shales are tabulated in Table 1. The results indicate that the TOC content of the Cambrian and Silurian shales was in the range of 2.76–4.74% and the TOC content of two Permian shales was 4.87%. The TOC contents of the Paleogene oil shale and Triassic coal were 13.60% and 59.20%, respectively. The Cambrian shales and Silurian shales are highly matured as their Tmax values were in the range of 505–606°C. The Paleogene oil shale and Triassic coal exhibited lower maturity with Tmax values of 420 and 427 °C, respectively.
The hydrogen index (HI) of the Cambrian and Silurian shales was significantly low with a value of only 0–2 mgHC/g TOC due to extremely high thermal maturity, indicating that these shales bear considerably limited hydrocarbon generation potential; it is difficult to determine the original OM types using their HI index. In contrast, the Permian shales exhibited relatively high HI values of 269 and 305 mg HC/g TOC, suggesting a relatively low maturity and a moderate level of hydrocarbon generation potential. The HI values of the oil shale and coal were 566 and 196 mg HC/g TOC, respectively.
Mineral composition of Palaeozoic shales
The mineral composition of the shales obtained from the XRD analysis is listed in Table 3. There was a large variation in the clay mineral composition and the total clay mineral content in these Palaeozoic shales. The total clay mineral content ranged from 3.0 to 60.4 wt.% with both temporal and spatial variation. In general, the total clay mineral contents in the Cambrian shales varied from 52.9 to 60.4 wt.%, and from 35.1 to 47.9 wt.% in the Silurian shales. The Permian shales are extremely low in clay minerals as the two shales exhibited a total content of 3.0 and 6.6 wt.%.
Mineral composition of shales and reference samples.

Age is geological age: ϵ1 — Lower Cambrian; S1 — Lower Silurian; P2 —Upper Permian; T2 —Middle Triassic; E2 — Middle Paleogene; Mont. —montmorillonite.
The unit of mineral composition is wt.%. Total clay wt.%= Mont. wt.%+ Illite wt.%+ Chlorite wt.%.
Clay minerals include montmorillonite, illite, and chlorite. Illite is the major clay mineral in the Cambrian and Silurian shales and its content varied from 32.3 to 54.8 wt.%, while chlorite was found in two Silurian shales, with contents of 6.0 and 15.6 wt.%. In addition, a significant amount of montmorillonite was present in all the Cambrian and Permian shales. The Triassic coal and Paleogene oil shales were characterised by a large amount of illite and montmorillonite. The clay mineral composition generally reflects the diagenetic evolution and depositional environments and are important in the study of the methane sorption characteristics of these shales.
Abundance and hydrocarbon composition of soluble organic matter in Palaeozoic shales
The chromatograms of aliphatic hydrocarbons in the Palaeozoic shales and Paleogene oil shale are depicted in Figure 3. The X-axis in Figure 3 represents retention time, and the Y-axis represents current. The SOM contents in the Cambrian and Silurian shales were too low to determine their quantity. However, the column chromatography separation and gas chromatography analysis indicate that the SOM in these shales is mainly composed of aliphatic and aromatic hydrocarbons, exhibiting variations with their geological age. The aliphatic hydrocarbons in the Cambrian and Silurian shales mainly consist of low carbon number n-alkanes ranging from n-C11 to n-C20, dominated by n-C15 to n-C18 peaks (Figure 3), whereas the aliphatic hydrocarbons in the Permian shales consist of a broader range of n-alkanes ranging from n-C12 to n-C26 with n-C15 and n-C16 as the dominated peaks. The composition and distribution of the aliphatic hydrocarbons of the Palaeozoic shales were found to be significantly different from those of the immature oil shale and coal (Figure 3).

Chromatograms of aliphatic hydrocarbons in the Palaeozoic shales from Upper Yangtze region and Paleogene oil shale of Mao-ming.
The chromatograms of the aromatic hydrocarbons in the Palaeozoic shales from the Upper Yangtze region are depicted in Figure 4, and their compositions were determined using mass spectrometry. The aromatic compounds in the Cambrian and Silurian shales were mostly decomposed as only few tiny peaks of residual compounds were observed on the chromatograms of the aromatic hydrocarbons. By contrast, a significant number of aromatic compounds were observed in the Permian shales (Figure 4). As depicted in Figure 4, the Permian Dalong Formation shales contain a relatively high abundance of phenanthrene and methylated isomers (i.e. P, MP, DMP, TMP, and TeMP), benzo naphthalenes, trimethyl naphthalenes, and tetramethyl naphthalenes, in addition to the significant presence of dimethyl naphthalene (DMN), trimethyl naphthalenes (TMN), and tetramethyl naphthalenes (TeMN). The Permian shales also contain a significant abundance of naphthalene, methylnaphthalenes, and dibenzothiophenes. In summary, the aliphatic and aromatic hydrocarbons in Cambrian and Silurian shales mainly consist of n-alkanes, whereas the Permian shales consist of a broad range of n-alkanes and aromatic compounds.

Chromatograms of aromatic hydrocarbons in the Palaeozoic shales from Upper Yangtze region.
Impact of SOM on the MAC of shales
The comparisons of methane adsorption isotherms of initial Palaeozoic shales (including oil shale) and their SOM removed samples are illustrated in Figure 5. These isotherms show that the measured adsorption curves match well with the Langmuir fitting curves. The amount of methane adsorbed for these initial shales and their solvent extracted samples are listed and compared in Table 4 and Figure 6. The comparison of the MAC between the initial and solvent extracted shale samples revealed that the removal of SOM had both positive and negative impacts on the MAC of the shales, depending on their geological age (Table 4 and Figure 5).

Representative adsorption isotherms of shales and their extracted samples (ϵ1 — Lower Cambrian; S1 — Lower Silurian; P2 — Upper Permian; E2 — Middle Paleogene).
Langmuir fitting results of methane adsorption for the bulk of shales, extracted shales, and isolated kerogen samples.

The MAC represents the volume of methane adsorbed under the instrumental condition of 60 °C and 12 MPa, and this volume was calculated to the equal volume of standard gas at 0 °C and 1 atm (STP).
MAC is the abbreviation of the methane adsorption capacity.
VL is the Langmuir volume, which is calculated by the least square method with the adsorption data.
Δ is the difference in methane adsorption capacity between extracted shale and initial shale under an equilibrium pressure of 12 MPa and Δ = MAC (extracted shale) − MAC (shale).
MAC (coal’s kerogen) was calculated from MAC (coal). It was assumed that the OM of coal contributes to the total adsorption of methane from the coal, and that the amount of kerogen is equal to the amount of OM. MAC (coal’s kerogen) = MAC(coal)/(TOC × K), K = 1.12 (Tissot and Welte, 1984).

Comparison between Langmuir adsorption volume of shales and their extracted samples (ϵ1 — Lower Cambrian; S1 — Lower Silurian; P2 — Upper Permian).
The adsorption capacity of initial Cambrian and their SOM removed shales varied from 1.40 to 2.70 cm3/g and from 1.59 to 2.56 cm3/g at 12 MPa, respectively. The removal of SOM demonstrated both increasing and decreasing adsorption effects on the adsorption capacity of these Cambrian shales (Figure 6). The adsorption capacity of two SOM removed shales, ZY-2 and ZY-3, sampled from Zunyi County of Guizhou Province, demonstrated a decrease in adsorption of 0.28 and 0.14 cm3/g at 12 MPa, respectively, whereas the SOM removed CK-1 shale, collected from Chengkou County of Sichuan Province, exhibited an increase of 0.22 cm3/g in comparison with the initial shale at 12 MPa. In contrast, the calculated maximum MAC (VL) of three SOM removed Cambrian shales demonstrated a uniformly decreasing adsorption affect in comparison with that of their initial shales, resulting in a decreased adsorption of 0.63, 0.17, and 0.22 cm3/g (Table 4). The discrepancy between the adsorption capacity of the SOM removed shales at 12 MPa and the calculated maximum adsorption capacity in the CK-1 shale imply that the removal of SOM may somehow cause a change in the sorption behaviour due to the pore structure of the sorption substance.
The solvent extracted Silurian shales also exhibited both reduced and enhanced adsorption capacities in comparison with those of the initial shales (Figure 6). The adsorption capacities of two extracted samples, NJ-5 and NJ-6 shales, exhibited a sorption decrease of 0.32 and 0.34 cm3/g at 12 MPa, respectively, while the SOM removed NJ-2 sample exhibited a sorption increase of 0.32 cm3/g at 12 MPa. In contrast, the calculated maximum MAC (VL) of two SOM removed Silurian shales were smaller than that of the initial shales (Table 4), indicating a decrease in the sorption amount of 0.42 and 1.09 cm3/g, respectively; however, the solvent extracted NJ-2 sample exhibited an increased amount of 0.42 cm3/g. The sorption increase and decrease after SOM removal accounted for a positive change of 17%, and negative changes of −23% and −15% in comparison with the sorption capacity of the initial shales, respectively.
By contrast, two SOM removed Permian shales, JG-1 and JG-4, exhibited an increase in sorption capacity in comparison with those of their initial shales (Figure 6). The sorption capacities of these SOM removed shales increased to 0.24 and 0.15 cm3/g at 12 MPa, respectively. The increased sorption amounts accounted for positive changes of 34% and 23% in comparison with the total sorption capacity of their initial Permian shales. The calculated maximum MAC (VL) of two SOM removed Permian shales were also higher than those of the initial shales (Table 4), demonstrating an increased sorption of 0.25 and 0.30 cm3/g.
The SOM content in the shales demonstrated a complicated but significant impact on the sorption capacity of these shales, as the removal of SOM caused a maximum increase of 34.29% and a decrease of 23.36% in the sorption capacity of the shales, which is significantly higher than the experimental error. The reason for this could be complicated as the SOM in the shales may dissolve methane or may occupy some organic pore space. Therefore, further investigation is needed to understand the impact of SOM on the sorption capacity of shales.
MAC of kerogen
The sorption isotherms and sorption capacity of the isolated kerogen from the Cambrian, Silurian, and Permian shales are depicted and listed in Figure 7 and Table 3, respectively. The isotherm curves of all kerogen samples were similar and appeared to be typical Langmuir sorption curves. All Cambrian and Silurian kerogen isotherms demonstrated a rapid increase in sorption at pressures below 6 MPa and a gradual increase beyond 6 MPa. However, two Permian kerogen samples exhibited steadily increasing sorption curves from 0 to 12 MPa.

Representative methane adsorption isotherms of shale kerogen and coal (ϵ1 — Lower Cambrian; S1 — Lower Silurian; P2 — Upper Permian; T2— Middle Triassic; E2 — Middle Paleogene).
The sorption capacities of three isolated Cambrian kerogens at 12 MPa were 17.02, 23.22, and 14.48 cm3/g, while their calculated maximum sorption capacities (VL) were 21.78, 29.60, and 29.14 cm3/g (Table 3), respectively. The sorption capacities of three isolated Silurian kerogens at 12 MPa were 36.06, 15.50, and 26.51 cm3/g, and the calculated maximum sorption capacities (VL) of these Silurian kerogens were 44.26, 28.05, and 31.66 cm3/g, respectively. For two Permian kerogen samples, their sorption capacities at 12 MPa were 11.15 and 10.71 cm3/g, with a calculated maximum sorption capacity (VL) of 22.37 and 25.58 cm3/g (Table 3), respectively. It appears that the Silurian kerogen exhibits the highest sorption capacity, the Cambrian kerogen exhibits a moderate sorption capacity, and Permian kerogen exhibits the lowest sorption capacity. These are in good agreement with the specific surface areas of kerogen in the shales of the same region, as a previous study demonstrated that the specific surface areas of the Cambrian, Silurian, and Permian kerogens were 161, 279–300, and 20–28 m2/g (Cao et al., 2015), respectively.
To determine the proportion of kerogen sorption to the total sorption of the extracted shales, the TOC content was converted into the equivalent kerogen content, whereas the SOM was negligible due to its low content. Therefore, the calculated kerogen sorption per gram of shale against the total sorption per gram of extracted shale varied from 33.67% to 45.63% for the Cambrian kerogen, 43.78% to 61.89% for the Silurian kerogen, and 62.23% to 70.23% for the Permian kerogen (Table 4). Thus, the kerogen was the dominant sorbent in the shales and the sorption of kerogen contributed a predominant proportion of sorption capacity of shales. This is in agreement with the previous suggestion that the TOC content is the primary controlling factor of sorption capacity of these Palaeozoic shales (Wang et al., 2013). In contrast, the proportion of kerogen sorption against the total sorption capacity of extracted shales demonstrated a declining trend along with the increase in the geological age of shales, as the proportions of kerogen sorption in the Permian, Silurian, and Cambrian shales were 62.23–70.23%, 43.78–61.89%, and 33.67–45.63%, respectively. This implies that the significance of the kerogen sorption in the shales decreases with the increase in thermal maturity. This may be related to thermal maturity and the type of kerogen.
The MAC of minerals accounted for 29.77–67.33% of the total MAC of these extracted shales (Table 4, γ). It is also worthwhile to notice that the contribution of kerogen sorption to the total sorption capacity of shales, in particular the Cambrian shales, was not predominant, which may indicate that other inorganic matrices may also play an important role in the sorption capacity of shales.
The sorption isotherms of the Palaeozoic kerogen, oil shale kerogen, and coal are depicted in Figure 7. According to the sorption isotherm curves, the sorption isotherms of all the Cambrian and Silurian kerogens were similar to those of the mature Triassic coal, while the sorption isotherms of two Permian kerogens were similar to those of less mature oil shale kerogens. These suggest that the sorption behaviours and capacity of over-matured kerogens resemble those of the type III kerogens such as coal, exhibiting significant sorption capability, while the less mature kerogens of the Permian shales demonstrate a similar sorption pattern and capacity as that of immature oil shale kerogens.
Conclusions
The estimation of MAC indicates that there was a significant variation among the kerogens of different geological ages, as the Silurian kerogens exhibited the highest adsorption capacity, the Cambrian kerogen exhibited moderate adsorption capacity, and the Permian kerogen exhibited the least adsorption capacity. Accordingly, these are in good agreement with the adsorption capacity and the specific surface area of kerogen in the Cambrian, Silurian, and Permian shales.
The adsorption contribution of kerogen to shale demonstrated that kerogen is an important factor controlling the sorption in shales. The contribution of kerogen adsorption to shale decreased with the increase in geological age, indicating that the increasing thermal maturity may have enhanced the sorption capacity of the inorganic matrix in shales.
The SOM demonstrated a significant but complicated impact on the adsorption capacity of the Palaeozoic shales, as the removal of SOM either increased or decreased the adsorption capacity of the Cambrian and Silurian shales but only increased the adsorption capacity of the Permian shales. This may also imply that the SOM may occupy some pore space in shales or the removal of the SOM may cause some side effects on the pore structure of the shales. However, this needs further investigation.